




 texto em
  Inglês (pdf)
 Artigo em XML
 Referências do artigo
 Tradução automática
 Enviar este artigo por email
 Citado por SciELO
  Similares em
SciELO
Similares em
SciELO 
 Permalink

1. Introduction
In the digital age, social media has reshaped how protests are organised and circulated across borders. In the Global South, platforms like X, Facebook and YouTube enable civic resistance that merges street activism with online advocacy (Tufekci, 2017). These platforms allow grassroots groups to bypass traditional media and reach a wider audience, sometimes achieving global visibility (Papacharissi, 2015). Yet participation alone does not ensure equal visibility, as attention often reproduces inequalities tied to geography, language, and access (Arora, 2019; Udupa, 2019). This problem is visible in postcolonial democracies like India, where recognition varies by region and linguistic identity. Ruralcoastal and non-urban communities often struggle to gain visibility in both mainstream and digital arenas. Weak infrastructure, language barriers (including the indigenous dialect of the same language and inefficiency in English), and urban-centric media limit their ability to frame concerns as legitimate claims to citizenship. Digital communication thus reinforces a territorial hierarchy in which a few regions gain global attention, while others remain marginal.
This study is guided by a few concepts, such as “digital participation”, which encompasses everyday actions, such as sharing, framing, and mobilising, that influence public discussions (Tufekci, 2017). “Digital visibility” involves how platforms prioritise and showcase issues based on engagement and network dynamics (Gillespie, 2018). “Digital citizenship” means gaining recognition and legitimacy in these online spaces (Isin & Ruppert, 2020). “Territorial inequality” shows the differences in infrastructure, language use, media representation, and cultural legitimacy across regions (Arora, 2019; Udupa, 2019).
Against this backdrop, this study compares two major environmental justice movements in Tamil Nadu, India: the Kudankulam anti-nuclear protest (2011-2013) and the Thoothukudi anti-Sterlite protest (2018). Both addressed ecological damage and relied on digital platforms, yet their online paths were very different (Joynes & Dwivedy, 2025). Kudankulam, rooted in a rural coastal region with limited infrastructure, struggled for national recognition and was often delegitimised. Thoothukudi, situated in an urban-industrial hub, gained viral visibility after the police firing that killed 13 civilians, amplified by journalists, celebrities, and global rights networks (Arora, 2019; Udupa, 2019). Emotional symbols such as martyr photos, funeral images, and hashtags boosted its reach, while Kudankulam’s technical framing limited engagement (Papacharissi, 2015; Tufekci, 2017). These contrasts highlight a gap in research: digital activism overlooks territorial inequality, and environmental justice often fails to address communicative legitimacy (Nixon, 2011; Schlosberg, 2007). This study fills this gap.
The study advances three arguments. First, digital visibility is shaped not only by participation but by emotions, symbols, and gatekeeping. Second, visibility is unevenly distributed across regions, favouring urban-industrial settings and sidelining rural-coastal ones. Third, digital communication constitutes a form of territorial identity and citizenship, granting some regions recognition while rendering others invisible.
Therefore, the main research question is: why did the Thoothukudi protest achieve widespread digital visibility while the Kudankulam protest remained marginalised? And what does this reveal about the relationship between digital communication, territorial inequality, and citizenship in India?
By situating digital activism within the context of territorial communication, this article contributes to discussions on globalisation, civic engagement, and cultural diversity in urban and regional contexts. More generally, it emphasises that the fight for environmental justice in the Global South involves not only ecological issues but also questions of who is recognised, who is heard, and whose territories are valued in the symbolic landscape of the digital world. This study presents “territorial inequality” as a key concept in research on communication and digital activism. It shows that recognition, legitimacy, and symbolic power are unevenly distributed across regions, even within the same linguistic group. By placing Tamil environmental protests in this context, the article contributes to discussions on digital citizenship. It highlights how communication systems and emotional stories influence which struggles are seen as legitimate public issues.
2. Literature Review
To avoid fragmentation, this section is organised into four thematic groups that relate directly to the study’s aims: (a) digital activism and inequalities, (b) affective strategies of engagement in digital protests, (c) environmental justice and media communication, and (d) territorial inequality and symbolic power. This structure clarifies how each strand contributes to the comparative analysis of the two movements. These approaches show that digital protest visibility comes from the interaction of multiple factors, including digital access, emotional mobilisation, framing, and symbolic legitimacy, rather than from any single component (Cammaerts, 2015; Papacharissi, 2015). This is especially relevant in multilingual postcolonial contexts, where language, geography, and institutional power shape who becomes visible.
2.1. Digital Activism and Inequalities
Digital activism has been celebrated for amplifying marginalised voices and enabling communication that bypasses traditional gatekeepers (Bennett & Segerberg, 2012). However, research shows that online visibility remains uneven and shaped by existing power hierarchies (Cammaerts, 2015). Digital platforms operate within attention economies, where visibility depends not only on technological affordances but also on algorithmic filtering, emotional resonance, and endorsement from influential actors (Gillespie, 2018; Poell & van Dijck, 2015).
Recent research suggests that incorporating digital participation features doesn’t always lead to increased audience engagement or visibility. A study of popular Portuguese news websites found no clear relationship between the number of participatory tools and user interaction levels. Instead, audiences engaged more with outlets they viewed as credible and newsworthy. This indicates that visibility in digital spaces relies less on technical features and more on established trust, brand authority, and user habits. These findings support the notion that digital audiences are not equally empowered, even when platforms appear to offer more opportunities for participation (Sixto-García et al., 2024).
Further evidence shows that digital visibility is shaped by communication practices. Joynes and Vijay Kumar (2025) demonstrate that institutional and State-linked actors use digital platforms to build credibility, selectively frame narratives, and manage audience perception. Their study shows that online visibility is not only limited by platform design but also created through coordinated communication efforts. This reinforces the idea that digital publics remain hierarchically structured, even in settings that appear open and participatory.
In India, these inequalities are particularly pronounced. Arora (2019) notes that the narrative of “digital India” obscures deep divides structured around caste, class, and geography. Udupa (2019) shows that digital spaces privilege metropolitan, upper-caste, and Hindi/English-speaking users, often marginalising activism expressed in regional languages. Similarly, Sindakis and Showkat (2024) demonstrate that rural and coastal movements face infrastructural constraints, limited recognition, and linguistic barriers, all of which reduce their visibility. These findings suggest that digital platforms are not neutral arenas, but contested spaces where visibility is uneven and must be actively negotiated.
These factors are pivotal for understanding the protests in Kudankulam and Thoothukudi. While both movements utilised digital media, differences in location, language, access to infrastructure, and proximity to institutional actors resulted in unequal starting points in the digital public sphere.
2.2. Affective Strategies of Engagement in Digital Protests
Visibility in digital spaces depends not only on access but also on how protests are emotionally and narratively framed. Narratives influence legitimacy, empathy, and connection, determining whether a movement grows or fades (Papacharissi, 2015; Waisbord, 2013; Waisbord & Mellado, 2014). Papacharissi’s (2015) concept of “affective publics” highlights that emotionally intense content, such as grief, outrage, or hope, can bring users together into supportive communities.
For environmental movements, emotional communication is crucial because ecological harm is often invisible or occurs over a long period. Abstract risks, such as radiation, elicit weaker emotional engagement (McDonald, 2013; Nelkin, 1981), whereas images of suffering or repression evoke a sense of urgency and prompt rapid sharing. Tufekci (2017) argues that successful digital protests highlight their issues by sharing stories of injustice and sacrifice. Emotional storytelling, utilising hashtags, images of martyrs, or viral videos, is crucial for gaining visibility (Papacharissi, 2015; Waisbord, 2011). In contrast, movements that rely on technical or expert-driven messages often struggle to generate immediate empathy (Gamson & Modigliani, 1989; McDonald, 2013).
2.3. Environmental Justice and Media Communication
Research on environmental justice reveals that ecological damage disproportionately affects marginalised communities defined by caste, class, ethnicity, and geography (Nixon, 2011; Schlosberg, 2007). Nixon (2011) refers to this as “slow violence”. This type of harm is often gradual and unnoticed, making it difficult to gain attention in a fastpaced media landscape that focuses on urgent crises.
Postcolonial scholarship highlights that State-supported development projects, such as nuclear infrastructure, often receive positive or uncritical media coverage. This coverage frequently ignores opposing views (Reddy, 2019). In contrast, environmental protests that connect with global narratives about corporate responsibility tend to receive more attention. Mainstream media plays a key role in legitimising these movements. As Hutchins and Lester (2006) argue, grassroots struggles gain recognition by becoming part of the “space of media flows” (p. 437).
Transnational advocacy research demonstrates how activist networks employ symbolic, informational, and leverage strategies to elevate local issues to international prominence (Keck & Sikkink, 2014). Recent digital movements also underscore the growing role of influencers and celebrities in disseminating protest messages. For instance, during the Indian farmers’ protest, celebrity involvement significantly increased global visibility and linked local concerns to international audiences (Mishra et al., 2021). These studies emphasise the importance of media systems, advocacy networks, and prominent figures in determining which environmental movements receive recognition.
2.4. Territorial Inequality and Symbolic Power
Postcolonial communication studies highlight that global media systems are organised hierarchically. They favour dominant languages and urban areas, while overlooking the voices of marginalised regions (Thussu, 2000, 2009). In multilingual countries like India, territorial and language hierarchies intersect, leading to symbolic erasure. Protests, mainly expressed in Tamil or other regional languages, may be clear locally but remain hidden nationally and globally unless translated or shared by bilingual intermediaries (Arora, 2019; Udupa, 2019).
Sundar (2016) points out that symbolic exclusion not only shows limited coverage but also a more profound inability to recognise regional struggles as legitimate claims to citizenship. Content in English or bilingual formats reaches a broader audience. It connects with diasporic networks and international media. This ultimately reinforces existing social and territorial hierarchies.
Territorial inequality is not only a communication gap. It shows deeper symbolic hierarchies. Research on urban place branding reveals how digital communication fosters the creation of symbolic images of areas. A study of São Paulo’s branding videos produced between 2014 and 2019 found that city officials consistently employed recurring themes of multiculturalism, cosmopolitan identity, cultural diversity, and openness. They aimed to position the capital as a national trendsetter, even amid changes in political leadership. These findings demonstrate how planned communication fosters steady symbolic narratives about a place, thereby strengthening its status within broader territorial hierarchies (Andrade, Sampaio, Garcia, Cairrão, et al., 2024). Bourdieu’s (1991) concept of “symbolic power” explains why some regions and identities gain legitimacy while others do not. These disadvantages make it harder for movements to emerge from rural coastal areas, like Kudankulam.
Research on urban governance reveals that digital communication affects territorial identity and symbolic power beyond protest situations. Studies of Brazilian city governments demonstrate how digital strategies combine citizen engagement with place branding (Andrade, Sampaio, Garcia, & Fonseca, 2024). This positions cities as appealing and connected while managing their public image. It illustrates that digital visibility is not only about sharing information but also about symbolism. It shapes how territories are perceived and valued. These findings support the notion that digital communication fosters territorial legitimacy, whether through State-led branding or, as observed in this study, grassroots protests that alter perceptions of specific regions.
While existing research provides helpful insights into digital activism, emotional mobilisation, environmental justice, and symbolic power, very few studies compare protest movements within the same language and culture that differ in their levels of digital visibility. This gap is especially significant in multilingual postcolonial contexts, such as India, where territorial inequalities, language hierarchies, and symbolic legitimacy shape how environmental struggles are acknowledged. This study examines the Kudankulam and Thoothukudi movements, two protests originating from the same state, cultural background, and linguistic community. It offers a unique comparison, showing that visibility outcomes vary not because of cultural differences but due to changes in symbolic framing, territorial positioning, access to resources, and emotional impact. This analysis enhances Indian digital activism research by demonstrating how territorial inequality operates within a shared cultural space, resulting in unequal communication outcomes even for movements addressing similar ecological issues.
3. Theoretical Framework: Digital Visibility and Territorial Inequalities
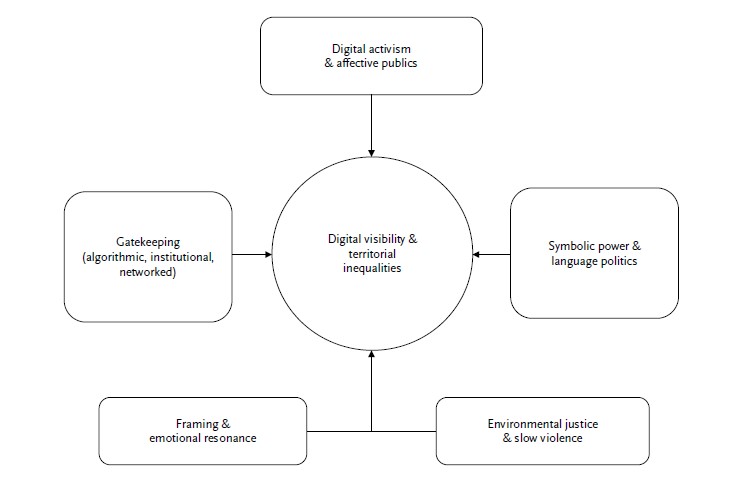
This study presents the framework of digital visibility and territorial inequalities to explain the differing levels of digital visibility achieved by the Kudankulam anti-nuclear movement and the Thoothukudi anti-Sterlite protest. The framework combines five areas of research: digital activism, environmental justice, media framing, digital gatekeeping, and symbolic power. It illustrates how communication practices interact with language, geography, and politics to shape the visibility of territorial struggles.
Research on digital activism highlights the rise of connective action. Here, participation occurs through networked practices, such as hashtags, retweets, and digital storytelling, rather than centralised leadership (Bennett & Segerberg, 2012). These interactions build emotional communities centred on strong narratives (Papacharissi, 2015). However, visibility within these groups is uneven. Platform algorithms, infrastructure gaps, and social hierarchies shape which voices are heard widely (Cammaerts, 2015; Udupa, 2019). As a result, rural and regional language movements in Tamil Nadu often struggle to reach national and global audiences, despite having strong local support.
Environmental justice situates these protests within a broader context of inequalities in how ecological harm is perceived and articulated. Schlosberg’s (2007) framework of distributive, procedural, and recognitional justice shows that affected communities seek not only protection from damage but also acknowledgement and fair involvement in decision-making. Nixon’s (2011) concept of “slow violence” explains why long-term nuclear risks in Kudankulam did not attract much attention, while the immediate and visible police violence in Thoothukudi sparked widespread outrage. Therefore, visibility becomes an issue of both environmental and communicative justice, influencing which harms are deemed urgent and which are overlooked.
Framing theory demonstrates how our interpretations shape public understanding. Frames that highlight visible suffering, injustice, and moral urgency spread more easily online compared to technical or abstract messages (Entman, 1993; Waisbord, 2011). This difference is evident when we compare Kudankulam’s technical discussions about radiation with Thoothukudi’s emotionally charged stories of corporate harm and State violence. This example demonstrates how framing affects both engagement and perceived legitimacy.
Although digital platforms enable participation, gatekeeping still affects visibility. Algorithmic ranking promotes content with high engagement. Mainstream media might amplify or overlook specific movements. Networked gatekeepers, journalists, influencers, and non-governmental organisations determine which causes receive attention (Napoli, 2019). For grassroots protests, visibility relies not only on participation but also on whether their stories fit the platform’s logic and gain backing from influential figures.
Symbolic power (Bourdieu, 1991) reveals the deeper social hierarchies that determine who is perceived as a valid speaker. In India, symbolic power is closely tied to language politics (Thussu, 2009). Movements that primarily speak in Tamil, without translations into English or Hindi, often face exclusion from national media (Sundar, 2016). Additionally, protests against State-supported industrial or nuclear projects are usually labelled as “anti-national”, while movements opposing private corporations more easily connect with global frames of corporate responsibility and environmental racism. These differences in symbolic resources help clarify why Thoothukudi receives broader recognition than Kudankulam.
Figure 1 summarises the framework. At the centre are “digital visibility” and “territorial inequalities”. Surrounding these are five interconnected dimensions: “digital activism” (connective action and affective publics), “environmental justice” (distributive, procedural, and recognitional), “framing” (emotional and narrative resonance), “gatekeeping” (algorithmic, institutional, and networked), and “symbolic power” (language and legitimacy). Together, these concepts explain why two protests from similar regional and linguistic contexts produced significantly different levels of digital visibility.
4. Research Objectives, Hypotheses, and Analytical Premises
This study seeks to explain why two grassroots environmental protests in Tamil Nadu, the Kudankulam anti-nuclear movement and the Thoothukudi anti-Sterlite movement, achieved different levels of digital visibility despite having similar goals in environmental justice. Guided by an interdisciplinary framework, the research has four objectives:
to identify communicative and symbolic factors that shape protest visibility;
to assess how narratives are framed emotionally, symbolically, and digitally;
to investigate audience perceptions of these narratives on social media; and
to analyse the role of symbolic power, gatekeeping, and platform dynamics in boosting or sidelining grassroots voices.
A quantitative content analysis of 400 posts tests six hypotheses, as shown in Table 1.
Table 1 Hypotheses, analytical dimensions, premises, and focus
| Analytical dimension | Hypothesis | Premise/rationale | Focus |
|---|---|---|---|
| Digital activism and affective publics | H1: Thoothukudi posts received significantly more engagement than Kudankulam posts. | Engagement reflects public attention; dramatic events, such as State violence, trigger virality (Tufekci, 2017). | Platform metrics: likes, shares, comments. |
| H2: Thoothukudi posts show stronger emotional intensity than Kudankulam posts. | Affective publics form around grief, anger, and outrage (Papacharissi, 2015). | Emotional tone in text, captions, hashtags. | |
| Framing and emotional resonance | H3: Thoothukudi posts are more likely to use symbolic visuals than Kudankulam posts. | Visuals like martyr images and candles evoke moral witnessing and empathy, unlike technical nuclear imagery (Cammaerts, 2015). | Image/video content: symbolic versus technical. |
| H5: posts combining emotional intensity with injustice framing generated more engagement. | Virality is shaped by emotionally resonant framing of injustice (Gillespie, 2018; Poell & van Dijck, 2015) | Interaction between emotion, injustice framing, and engagement levels. | |
| Gatekeeping and symbolic power | H4: verified accounts and media organisations boosted Thoothukudi more than Kudankulam. | Symbolic power and networked gatekeeping amplify some struggles more than others (Bourdieu, 1991; Napoli, 2019). | Source credibility: verified users, journalists, non-governmental organisations. |
| H6: Thoothukudi posts were more likely to use international frames and hashtags than Kudankulam posts. | Transnational frames (corporate crime, human rights) gain visibility more easily than State-security discourses (Costanza-Chock, 2012). | Use of international hashtags and references to global norms. |
Together, these hypotheses capture the narrative, symbolic, and amplification aspects of digital protest visibility.
5. Methodology
This study uses a convergent parallel mixed-methods design (Creswell & Clark, 2017) to explain why the Kudankulam anti-nuclear movement and the Thoothukudi antiSterlite protest had different levels of digital visibility. Quantitative content patterns and qualitative audience interpretations were collected simultaneously and integrated to capture both structural dynamics and the meanings attached to protest narratives.
5.1. Rationale for Mixed Methods
Convergent designs allow for the simultaneous collection of quantitative and qualitative data, which are analysed separately and then combined to explore convergence or divergence (Creswell & Clark, 2017). This approach is particularly suitable for postcolonial protest contexts, where numerical visibility and experiential recognition often diverge (Couldry, 2010; Udupa, 2019).
5.2. Quantitative Strand: Content Analysis
The final dataset comprised 400 original posts, with 200 from each protest and an equal number from X (200) and Facebook (200). Posts were gathered from the peak protest periods (2011-2013 and 2018) using protest-related hashtags (#StopSterlite, #JusticeForThoothukudi, #StopKudankulam, #Idinthakarai). Only posts containing meaningful user-generated content were included; retweets without commentary, duplicates, and irrelevant material were excluded. Tamil posts comprised 57% of the dataset, while English posts accounted for 43%. A sample of 400 posts was deemed sufficient because coding saturation occurred at approximately 350 posts, aligning with standards for digital content analysis (Krippendorff, 2018; Neuendorf, 2010).
The coding categories included: engagement metrics (likes, shares, retweets, comments), emotional tone (anger, grief, pride, fear), framing (injustice, corporate harm, anti-national), visuals (martyr images, technical charts, symbolic icons), and source type (ordinary user, activist, journalist, verified account).
5.2.1. Operational Definitions of Key Variables
All variables were defined following the standard methods for digital content analysis (Krippendorff, 2018; Neuendorf, 2010). Engagement was measured by counting likes, shares, retweets, and comments (Papacharissi, 2015). The emotional tone captured the main feelings, anger, grief, pride, and fear, while emotional intensity was ranked on a 3-point scale from neutral/technical to highly expressive (Tufekci, 2017). Framing identified the primary interpretive angle of the post, whether it focused on injustice, corporate harm, or anti-national themes, based on Entman’s (1993) model. Frame strength assessed how clearly a post expressed the problem, cause, and demand, with scores ranging from 1 (weak) to 3 (strong). Visuals included images of martyrs, technical visuals, symbolic icons, or text-only content. Source type categorised posts as coming from regular users, activists/non-governmental organisations, journalists/media, or verified accounts (Bennett & Segerberg, 2012).
To address platform-specific influences, platform type (X and Facebook) was included as a control variable in all regression models. This helped ensure that engagement effects were not skewed by features or algorithmic differences. Additionally, other structural factors known to affect visibility were accounted for, including language (Tamil/ English), media type (text, image, video), posting time, and log-transformed account size (follower count). The reliability of coding these variables was high (κ ≥ .82), showing strong consistency.
However, we did not have access to paid promotion data and algorithmic amplification metrics for older posts on both platforms. This limitation may explain some of the differences in reach and engagement, and we now clearly acknowledge this issue.
5.3. Qualitative Strand: Audience Interviews
To complement the content analysis, semi-structured interviews were conducted to examine audience perceptions. The guiding question is: how do social media users perceive, emotionally respond to, and interpret the digital narratives of the Kudankulam and Thoothukudi protests?
This qualitative strand reveals how digital audiences co-create visibility, placing protest communication within broader hierarchies of recognition in postcolonial contexts (Couldry, 2010; Papacharissi, 2015).
Participants were recruited through purposive sampling using Tamil digital activism forums, Facebook groups, and WhatsApp networks. Eligibility required (a) active social media use during the protest periods and (b) prior engagement with Kudankulam- or Thoothukudi-related content. A total of 30 participants (ages 18-55) from both rural and urban settings met these criteria.
Semi-structured interviews, lasting 30-60 minutes and conducted in Tamil or English, explored topics such as perceived visibility, emotional connection, trust in sources, language preferences, and engagement practices. Data were analysed thematically following Braun and Clarke’s (2006) framework, with support from NVivo 15. Five themes emerged from the analysis: visibility, emotional connection, narrative interpretation, trust, and structural barriers.
All procedures adhered to ethical guidelines for digital research. Only publicly accessible posts were used, and no personal identifiers were kept. Interview participants gave informed consent, and all transcripts were anonymised.
5.4. Integration and Justification
Quantitative analysis looked at how protest content spread, attracted engagement, and was framed on digital platforms. Qualitative analysis focused on how audiences interpreted and emotionally connected with these stories. The study achieved triangulation through a joint-display matrix that compared quantitative indicators, such as engagement levels, emotional intensity, symbolic visuals, and verified account presence, with qualitative insights about perceived visibility, urgency, trust, and suppression.
Convergence occurred when Thoothukudi’s emotionally charged, symbolic content matched higher engagement metrics. Divergence emerged in participants’ perceptions of algorithmic suppression, which was not evident in the platforms’ engagement data. This mixed-methods triangulation enhances our analysis by explaining not only what was visible online but also why certain narratives resonated with some audiences while others remained marginal.
6. Quantitative Findings
This study tested six hypotheses (H1-H6) using independent-samples t-tests, chisquare tests, and multiple regression models. For each hypothesis, a null (H0) and an alternative (H1) were evaluated.
6.1. Engagement Metrics Differences (H1)
H0: there is no significant difference in mean engagement (likes/reactions, shares/ retweets, comments) between Kudankulam and Thoothukudi posts.
H1: Thoothukudi posts receive significantly higher engagement than Kudankulam posts.
Independent-samples t-tests showed significant differences in engagement levels between the two protests (Table 2). Posts about Thoothukudi received much higher averages across all three metrics: likes/reactions (M = 372.23, SD = 294.36), shares/ retweets (M = 293.36, SD = 275.58), and comments (M = 44.94, SD = 105.72). In contrast, Kudankulam posts had significantly lower engagement, as indicated by the following metrics: likes/reactions (M = 6.38, SD = 12.12), shares/retweets (M = 11.42, SD = 38.53), and comments (M = 3.68, SD = 11.44).
Table 2 Independent samples t-test results for engagement metrics (H1)
| Metric | Protest | N | Mean | Standard deviation | t (df) | p-value | Cohen’s d |
|---|---|---|---|---|---|---|---|
| Likes/reactions | Kudankulam | 199 | 6.38 | 12.12 | -17.52 (327) | < .001 | -1.98 |
| Thoothukudi | 130 | 372.23 | 294.36 | ||||
| Shares/retweets | Kudankulam | 200 | 11.42 | 38.53 | -14.27 (330) | < .001 | -1.60 |
| Thoothukudi | 132 | 293.36 | 275.58 | ||||
| Comments | Kudankulam | 200 | 3.68 | 11.44 | -5.49 (394) | < .001 | -0.55 |
| Thoothukudi | 196 | 44.94 | 105.72 |
The t-tests confirmed these differences: likes: t(327) = -17.52, p < .001, d = -1.98; shares: t(330) = -14.27, p < .001, d = -1.60; comments: t(394) = -5.49, p < .001, d = -0.55. The effect sizes were substantial for likes and shares and moderate for comments. Therefore, the H0 is rejected. Thoothukudi posts generated significantly more engagement, highlighting the unequal symbolic impact of the two protest narratives.
6.2. Emotional Intensity Differences (H2)
H0: emotional intensity distribution (low, moderate, high) does not differ significantly between the two protests.
H2: Thoothukudi posts are significantly more emotionally intense than Kudankulam posts.
A chi-square test of independence showed a strong and significant link between protest type and emotional intensity, χ²(2, N = 400) = 113.26, p < .001. More than half of the Thoothukudi protest posts (51%) were in the “high” intensity category. This category included expressions of grief, anger and outrage, as well as calls for justice. In contrast, most Kudankulam posts fell into the “low” (44%) and “moderate” (47.5%) categories, with only 8.5% classified as “high” intensity (Table 3 and Table 4).
Table 3 Crosstabulation of protest name and emotional intensity (H2)
| Protest Name | Low | Moderate | High | Total |
|---|---|---|---|---|
| Kudankulam | 88 | 95 | 17 | 200 |
| Thoothukudi | 15 | 83 | 102 | 200 |
| Total | 103 | 178 | 119 | 400 |
Table 4 Chi-square test results for emotional intensity (H2)
| Test Statistic | Value | Degrees of freedom | Significance (2-sided) |
|---|---|---|---|
| Pearson chi-square | 113.261 | 2 | < .001 |
| Likelihood ratio | 125.458 | 2 | < .001 |
| Number of valid cases | 400 |
H0 is rejected, and the H2 is accepted. Thoothukudi posts displayed significantly greater emotional intensity than Kudankulam posts.
6.3. Visual Symbolism (H3)
H0: the presence of symbolic visuals is not associated with protest type.
H3: symbolic visuals appear significantly more in Thoothukudi posts than in Kudankulam posts.
A chi-square test of independence revealed a highly significant association between protest type and the use of symbolic visuals, χ²(1, N = 400) = 65.13, p < .001, φ = .40. Symbolic visuals were present in 34.5% of Thoothukudi posts, compared to only 3% of Kudankulam posts. The gap is striking: nearly one in three Thoothukudi posts featured symbolic imagery, such as martyr portraits, funeral processions, or religious icons; in contrast, symbolic visuals were almost absent in Kudankulam’s digital repertoire (Table 5 and Table 6).
Table 5 Crosstabulation of protest and symbolic visuals (H3)
| Protest | Visuals absent | Visuals present | Total |
|---|---|---|---|
| Kudankulam | 194 | 6 | 200 |
| Thoothukudi | 131 | 69 | 200 |
| Total | 325 | 75 | 400 |
Table 6 Chi-square test results for symbolic visuals (H3)
| Test | Value | Degrees of freedom | Significance (2-sided) |
|---|---|---|---|
| Pearson chi-square | 65.132 | 1 | < .001 |
| Continuity correction | 63.081 | 1 | < .001 |
| Likelihood ratio | 74.447 | 1 | < .001 |
| Valid cases | 400 |
Therefore, H0 is rejected, and the alternative hypothesis is accepted. Symbolic visuals were far more prevalent in Thoothukudi posts.
6.4. Verified Accounts and Media Attention (H4)
H0: verified/media-affiliated accounts posted equally about both protests.
H4: verified/media-affiliated accounts posted significantly more about Thoothukudi than Kudankulam.
A chi-square test of independence showed a statistically significant association between protest type and the presence of verified or media-affiliated accounts posting content, χ²(1, N = 400) = 39.81, p < .001, φ = .32. Among Thoothukudi posts, 68.5% originated from verified users or institutional actors (such as journalists, non-governmental organisations, or media organisations), compared to only 37% of Kudankulam posts (Table 7 and Table 8).
Table 7 Crosstabulation of protest and verified/media accounts (H4)
| Protest | Non-verified/ ordinary users | Verified/ media accounts | Total |
|---|---|---|---|
| Kudankulam | 126 | 74 | 200 |
| Thoothukudi | 63 | 137 | 200 |
| Total | 189 | 211 | 400 |
Table 8 Chi-square test results for verified accounts (H4)
| Test | Value | Degrees of frredom | Significance (2-sided) |
|---|---|---|---|
| Pearson chi-square | 39.810 | 1 | < .001 |
| Continuity correction | 38.557 | 1 | < .001 |
| Likelihood ratio | 40.508 | 1 | < .001 |
| Valid cases | 400 |
This indicates a substantial disparity in who amplified each protest online. The results confirm H4, highlighting the central role of gatekeeping in protest communication. Verified accounts and media organisations amplified Thoothukudi significantly more than Kudankulam.
6.5. Emotional Intensity and Frame Strength as Predictors of Engagement (H5)
H0: emotional intensity and frame strength do not significantly predict engagement (likes, shares, comments).
H5: emotional intensity and/or frame strength significantly predict engagement.
Three multiple regression models were estimated with likes/reactions, shares/ retweets, and comments as dependent variables. The independent variables were emotional intensity score and frame strength score.
The model shows statistical significance, with F = 16.03 and p < .001. This means emotional intensity and frame strength together explain a notable part of the variation in likes and reactions (Table 9). The R² value is 0.084, indicating that about 8.4% of the variance in likes and reactions is explained by these two factors. While this may seem minor, it is significant in social media research, where engagement can be influenced by numerous external factors, such as algorithms, networks, and timing. Emotional intensity has a positive and significant effect, with a B = 88.22, β = 0.245, t = 3.19, and p = 0.002. This means that as emotional intensity increases, the number of likes and reactions also goes up. In simpler terms, posts with a stronger emotional impact are more likely to receive audience approval. Frame strength is not significant, with B = 24.30, β = .070, t = 0.91, and p = .364. This indicates that the strength of how an issue is framed does not meaningfully predict likes or reactions. The null hypothesis is rejected, and the alternative hypothesis is partially accepted. Emotional intensity was a significant predictor of engagement, but frame strength was not.
Table 9 Regression results for likes/reactions
| Predictor | B | Standard error | Beta | t | p |
|---|---|---|---|---|---|
| Emotional intensity | 88.22 | 27.66 | .245 | 3.19 | .002 |
| Frame strength | 24.30 | 26.72 | .070 | 0.91 | .364 |
Note. Model fit: R² = .084, F(2, 326) = 16.03, p < .001.
The regression results in Table 10 indicate that emotional intensity has a strong predictive relationship with the number of shares and retweets. The positive coefficient (B = 113.18, β = 0.373, t = 4.95, p < .001) indicates that posts expressing strong emotions, such as anger, grief, or outrage, are significantly more likely to be shared. In contrast, frame strength had no significant effect (B = -7.01, β = -.023, t = -0.31, p = .760). This suggests that the persuasiveness or clarity of an argument does not influence sharing behaviour. The overall model was significant (F(2, 329) = 23.99, p < .001), explaining 12.7% of the variance in shares and retweets (R² = .127). This highlights that emotional cues, rather than the argument structure, primarily drive social media sharing.
Table 10 Regression results for shares/retweets
| Predictor | B | Standard error | Beta | t | p |
|---|---|---|---|---|---|
| Emotional intensity | 113.18 | 22.88 | .373 | 4.95 | < .001 |
| Frame strength | -7.01 | 22.90 | -.023 | -0.31 | .760 |
Note. Model fit: R² = .127, F(2, 329) = 23.99, p < .001.
The regression results in Table 11 show that emotional intensity predicts comment activity. It has a positive coefficient (B = 34.70, β = 0.335, t = 4.71, p < .001), indicating that posts with strong emotions, such as anger, grief, or solidarity, received more user responses. In contrast, frame strength did not have a significant effect (B = -6.46, β = -.060, t = -0.84, p = .400). This suggests that the clarity or persuasiveness of the post did not impact commenting behaviour. The overall model was significant (F(2, 393) = 18.57, p < .001), explaining 8.6% of the variance in comments (R² = .086). This highlights that emotional appeal drives conversational engagement on social media, rather than argumentative framing.
Table 11 Regression results for comments
| Predictor | B | Standard Error | Beta | t | p |
|---|---|---|---|---|---|
| Emotional intensity | 34.70 | 7.37 | .335 | 4.71 | < .001 |
| Frame strength | -6.46 | 7.67 | -.060 | -0.84 | .400 |
Note. Model Fit: R² = .086, F(2, 393) = 18.57, p < .001.
The overall findings indicate that emotional intensity has a significant predictive value for all forms of engagement, including likes and reactions (p = .002), shares and retweets (p < .001), and comments (p < .001). In contrast, frame strength does not significantly affect any of the engagement metrics (p = .364, .760, and .400, respectively). Thus, we reject the null hypothesis (H0) for emotional intensity but keep it for frame strength. The alternative hypothesis (H5) is supported only for emotional intensity. This suggests that emotional cues, rather than argumentative framing, drive user engagement on social media.
6.6. International References (H6)
H0: international references occur equally in both protests.
H6: Thoothukudi posts contain significantly more international references than Kudankulam posts.
The crosstabulation and chi-square results show that, among 200 posts per protest, Kudankulam had 12 posts with international references, while Thoothukudi had 27. The Pearson chi-square test is significant (χ² = 6.392, df = 1, p = .011), with similar significance in the continuity correction and likelihood ratio tests (Table 12 and Table 13). This indicates that international references are not equally distributed across the two protests. Specifically, Thoothukudi posts contain significantly more international references. Therefore, H0 is rejected, and the alternative hypothesis (H6) is supported.
Table 12 Crosstabulation of protest and international references (H6)
| Protest | No international reference | International reference | Total |
|---|---|---|---|
| Kudankulam | 188 | 12 | 200 |
| Thoothukudi | 173 | 27 | 200 |
| Total | 361 | 39 | 400 |
Table 13 Chi-square test results for international references (H6)
| Test | Value | Degrees of freedom | Significance (2-sided) |
|---|---|---|---|
| Pearson chi-square | 6.392 | 1 | .011 |
| Continuity correction | 5.569 | 1 | .018 |
| Likelihood ratio | 6.544 | 1 | .011 |
| Valid cases | 400 |
Across all tests, the null hypotheses were rejected for H1-H4 and H6, with partial support for H5. The results show that emotional intensity, symbolic visuals, verified-account amplification and international references systematically contributed to Thoothukudi’s higher digital visibility. In contrast, Kudankulam’s technical framing and limited symbolic resources resulted in lower engagement and weaker algorithmic circulation. These findings confirm that digital visibility is not incidental but structured by emotional, symbolic, and institutional factors.
7. Qualitative Findings: Audience Perceptions of Protest Narratives
This section shares insights from the thematic analysis of the audience interviews. Five dominant themes illustrate how participants understood, evaluated, and emotionally responded to the two protest movements in digital spaces. These themes emerged from participant interpretations and are grounded in the study’s theoretical framework, which encompasses digital activism, symbolic power, media framing, and environmental justice. The findings also show how territorial, linguistic, and infrastructural hierarchies affected the uneven visibility of Kudankulam and Thoothukudi online.
7.1. Visibility and Perception
Participants consistently highlighted unequal visibility between the Thoothukudi and Kudankulam protests. While both addressed urgent environmental and human rights issues, Thoothukudi appeared highly visible, especially after the police shooting that led to 13 civilian deaths. Participants described this event as a moment that “caught the nation’s eye”. Several interviewees explained that Thoothukudi “felt unavoidable online”, with one noting, “whichever app I opened, someone had posted about it” (P12, urban male, 24, personal communication, 12 May 2025).
In contrast, Kudankulam was seen as a long struggle without a single dramatic incident, often overlooked by the national media. Participants repeatedly noted that they “hardly saw Kudankulam posts unless searching manually”, with others calling it “digitally silent” or “invisible”. Spatial and symbolic proximity influenced visibility. “Urbanindustrial protests get noticed; coastal villages don’t”, one participant (P4, urban female, 33, personal communication, 4 April 2025) stated. Visibility, according to audiences, depends not only on severity but on media circulation, platform algorithms, and urbancentric attention.
7.2. Emotional Resonance
Emotional intensity proved to be a key factor in audience engagement. Respondents were more likely to remember, share, and discuss content that stirred feelings of anger, grief, or solidarity. Thoothukudi’s powerful imagery, including martyr photographs, funeral scenes, and police violence, sparked strong emotional reactions, making the protest feel immediate and personal. As one participant explained, “the police firing… it hit emotionally. That’s why I shared it immediately” (P15, urban male, 21, personal communication, 16 May 2025). Another added, “there was grief everywhere in the Thoothukudi posts; it was impossible to ignore” (P11, rural male, 35, personal communication, 10 May 2025).
In contrast, Kudankulam relied on technical visuals, such as maps and radiation signs. While informative, these elicited less emotional involvement. One participant noted, “Kudankulam was serious, but the posts were too technical. It didn’t feel urgent” (P7, rural female, 32, personal communication, 17 April 2025). This difference highlights that digital protest visibility relies on being seen and being emotionally impactful.
7.3. Narrative Interpretation
The clarity of the narrative and the choice of language shaped understanding and engagement. Participants found Tamil-language content authentic and culturally relevant, which fostered a sense of closeness. English-language posts allowed for broader dissemination. However, many described English versions as “sanitised” or “less emotional”.
Narrative clarity was pivotal: “Thoothukudi was simple, corporate pollution, victims, police firing. The storyline was clear”, a participant observed (P10, urban male, 30, personal communication, 05 May 2025). Kudankulam’s scientific framing, however, required technical understanding. Another respondent explained, “posts talked about radiation and reactors; I didn’t fully understand the danger” (P14, rural male, 38, personal communication, 14 May 2025). Visual clarity and concise captions aided interpretation, whereas abstract or technical posts were often ignored.
7.4. Trust and Engagement
Trust in content sources affected engagement patterns. Verified users, journalists, and eyewitness accounts were generally considered credible, while content deemed overly emotional or unverified was approached with caution. One participant said, “I trusted Thoothukudi posts more because journalists and verified accounts were sharing them” (P12, personal communication, 12 May 2025).
Kudankulam content often circulated on local pages without broader credibility. “Some Kudankulam posts looked like forwarded messages. I didn’t know what was real”, a respondent explained (P6, rural male, 29, personal communication, 13 April 2025). Engagement also varied. Younger users interacted publicly by commenting and sharing, while older participants preferred to “quiet-like” or to forward content privately. Several people felt that digital activism was “loud but hollow”, suggesting a lack of confidence in the effectiveness of online involvement.
7.5. Structural Barriers and Justice
Structural inequalities shaped digital representation and recognition. Participants highlighted the struggles of rural, coastal, and minority communities to gain attention, describing Kudankulam as a case of “rural neglect” in which protests were often dismissed or undermined. Participants identified substantial urban-rural differences: “people in my village had patchy internet. Kudankulam updates never travelled fast” (P8, rural male, 40, personal communication, 19 April 2025). While social media was seen as accessible, it favoured the voices of the urban elite.
Language was another barrier. “English posts reached more people. Tamil-only messages stayed within our circles” (P18, urban female, 27, personal communication, 22 May 2025). Coastal and rural content struggled to gain traction without translation or support from celebrities and influencers. Participants also mentioned forms of digital suppression, pointing out the removal or downranking of sensitive content. For many, Tamil digital spaces provided solidarity but lacked a national audience. One participant described it as “shouting into a well” (P13, urban female, 37, personal communication, 13 May 2025).
Across themes, participants emphasised that visibility relied on emotional impact, language reach, and source credibility. Thoothukudi seemed “unavoidable online” (P12, personal communication, 12 May 2025), while Kudankulam looked “serious but not urgent” because of its technical framing (P7, personal communication, 17 April 2025). Participants noted that “English posts reached more people” (P18, personal communication, 22 May 2025), highlighting the connection between bilingual content and broader sharing. These responses clarify the audience-level factors behind the uneven engagement patterns seen in the quantitative results (Table 14).
Table 14 Summary of thematic coding
| Theme | Subcode | Code frequency | Participants | Sample insight/ interpretation |
|---|---|---|---|---|
| Visibility and perception | Kudankulam visibility | 42 | 23 | Long-running but largely ignored by the national media. |
| Thoothukudi visibility | 56 | 27 | Dramatic and widely recognised after the police firing. | |
| Media and platform influence | 31 | 20 | Metro-centric bias; urban protests amplified. | |
| Comparative judgments | 35 | 21 | Tragedy is perceived as more relatable than technical risks. | |
| Emotional resonance | Emotional reactions | 61 | 29 | Outrage and grief triggered by visuals of police violence. |
| Content triggers | 40 | 22 | Videos, images, and hashtags prompted emotional sharing. | |
| Emotional distance/fatigue | 18 | 11 | Some respondents felt overwhelmed or disconnected. | |
| Narrative interpretation | Clarity of protest goals | 28 | 17 | Thoothukudi goals seen as welldefined and actionable. |
| Framing and symbolism | 33 | 20 | Candle visuals, martyr language, funeral metaphors. | |
| Language and accessibility | 45 | 24 | Tamil content authentic; English broader reach. | |
| Trust and engagement | Source trust | 30 | 18 | Most trusted verified users and eyewitnesses. |
| Type of participation | 39 | 21 | Private sharing common; few public comments. | |
| Reasons for (non)engagement | 27 | 16 | Fear of backlash, political fatigue, or doubt about impact. | |
| Structural barriers and justice | Digital inequality | 25 | 15 | Rural/low-income communities lacked infrastructure. |
| Linguistic/regional marginalisation | 33 | 19 | Tamil-only content is “invisible” outside the state. | |
| Perceived protest legitimacy | 26 | 14 | Kudankulam delegitimised; Thoothukudi seen as just. | |
| Local vs national visibility | 37 | 22 | Strong local presence, but national attention is lacking. |
8. Discussion
This study shows that digital visibility varies significantly between protests in the same state and linguistic community. The Thoothukudi movement received high engagement due to its emotionally impactful visuals, straightforward narrative, and support from verified accounts, which matched well with platform trends that favour emotional and reactive content. In contrast, the Kudankulam protest, which took place in a rural coastal area and centred on technical discussions surrounding nuclear issues, attracted significantly less attention, despite serious environmental concerns.
Audience perceptions add depth to this explanation. Participants viewed Thoothukudi as “unavoidable” online because of the widespread sharing of police brutality images. In contrast, Kudankulam was seen as “silent or invisible”.
Insights from interviews reveal that infrastructure challenges, a lack of emotional imagery, and limited bilingual outreach limited Kudankulam’s digital presence. This illustrates how linguistic and geographical factors influence the perception of urgency.
Quantitative findings confirm that emotional intensity, rather than rational or technical explanations, is a better predictor of engagement. This supports broader research that indicates platforms tend to favour high-energy communication. Nixon’s (2011) concept of “slow violence” helps explain why the less visible, slower risks of nuclear damage struggle to gain public attention. This links environmental justice issues to communication inequalities; harms that go unnoticed are less likely to be recognised and addressed politically.
In a broader sense, the findings suggest that the success of digital activism hinges on symbolic resources and structural access, including bilingual outreach, close ties to influential networks, and the ability to amplify messages. Digital visibility serves as a form of symbolic capital that not all communities can access equally. Therefore, participation does not guarantee recognition; geographic inequality continues to shape who is seen as a legitimate democratic voice online.
At the same time, caution is needed. The lack of metadata, such as network size, posting timing, and algorithmic signals, may affect the trends observed in visibility. Participants’ concerns about content suppression could not be confirmed with quantitative data. These limitations emphasise the need for greater transparency at the platform level to enhance the understanding of visibility dynamics.
9. Conclusion
The analysis of the Kudankulam and Thoothukudi protests reveals that digital visibility is influenced by emotional connection, symbolic legitimacy, and communication infrastructure, rather than solely by participation. This shows that recognition on digital platforms is not evenly distributed across geographic and linguistic divides in postcolonial societies.
The study makes three key contributions to communication research:
it enhances digital activism theory by demonstrating that visibility relies on symbolic and emotional power, shaped by platform rules;
it expands environmental justice research by stressing that digital recognition is crucial for communities seeking legitimacy in democratic discussions;
it contributes to digital citizenship research by demonstrating how protest stories create uneven territorial legitimacy, highlighting specific areas while sidelining others.
These contributions offer practical suggestions for inclusive media representation. Journalists, platform users, and advocacy groups must actively promote multilingual sharing, translation into national and global contexts, and visibility for protests from rural and coastal areas.
The study is limited because it focuses on two cases in one state and doesn’t include visual-first platforms like Instagram and YouTube. Moreover, the lack of detailed metadata for older posts restricts conclusions about algorithmic control.
Future research should examine similar movements across different regions of the Global South to understand how infrastructure, platform governance, and language issues impact visibility and civic recognition. Greater transparency in algorithm processes would help clarify how environmental movements gain or lose national and global attention.
Ultimately, the varied outcomes of these protests demonstrate that communication justice is crucial for achieving environmental justice. Ensuring visibility for marginalised areas is vital for strengthening inclusive citizenship and allowing fair participation in public decision-making.

