




 Inglês (pdf)
 Artigo em XML
 Referências do artigo
 Tradução automática
 Enviar este artigo por email
 Citado por SciELO
  Similares em
SciELO
Similares em
SciELO 
 Permalink

INTRODUCTION
In developed countries, added salt to processed foods and food service meals are the main sources of sodium intake. These sources are outside the direct control of consumers (1). Eating out, in restaurants or canteens, has become a routine and takes place from increasingly earlier ages (2, 3). For every 1000 calories eaten, food consumed in restaurants and fast-food locations contained 2.151 mg and 1.864 mg sodium, respectively, compared to 1.369 mg of home-cooked foods (3).
In a study carried out in the north of Portugal, it was found that all lunches served in school canteens contained higher-than-recommended sodium levels (an average of 3.4g, far above the maximum recommended value of 1.5g). A correlation was found between the energy density and the sodium values, a higher meal’s energy value corresponded to a higher content of salt (4). Restaurants are an important setting for food supply and present key elements for the success of an intervention to reduce salt intake (5). In Portugal in 2009 it was published the Decree Law n.º 75/2009, established norms for the reduction of salt content in bread (6) and, on July 29, 2015, Order 8272/2015 established the Interministerial Working Group to propose a set of measures for the reduction of salt consumption by the population, focusing on food availability (7). The food service industry has dealt with and continues to deal with various challenges in its attempt to reduce the sodium content in the foods that they prepare and sell. Despite these challenges, several successful strategies have been used to reduce the sodium content in food services (8).
In Portugal, the Government defined and approved an Integrated Strategy for the Promotion of Healthy Eating (EIPAS), to promote and encourage the consumption of foods framed in a healthy food pattern, focusing mainly on the significant reduction of the daily excessive consumption of salt, sugar and fat (trans fatty acids), to meet the levels recommended by WHO. In the National Programme for the Promotion of Healthy Food, the goal is to reduce the salt content of the main salt-rich food groups by about 10% by 2020 (9).
According to the Integrated Strategy for the Promotion of Healthy Food, EIPAS, it is also an objective to establish guidelines for food supply in the social economy institutions, particularly those that support the elderly population (9). The universal method used for seasoning meals in catering facilities in Portugal is completely empirical, by using food handlers’ hands in a completely subjective amount. This may be a potential reason for the high amount of salt present in meals served (10, 11).
Despite several limitations, standardized measuring spoons have been used for the quantification and addition of salt in food service units (12). According to Gonçalves et al. (11), food handlers were concerned and aware of the recommended salt intake values and health-associated problems (Hypertension) - which may indicate that intervention programs in this audience can bring huge self-benefits and for those who will consume the meals they prepare (11).
The Private Institutions of Social Solidarity are places responsible for the food supply to a considerable number of children and elders (13). According to the Directorate-General for Education and Science Statistics (DGEEC), in the 2022/2023 academic year, 252,198 children were enrolled in pre-primary education in mainland Portugal. (14). According to the Social Charter 2023, the total number of social responses has increased significantly since 2000, particularly those aimed at supporting children, young people, and the elderly. In 2023, responses targeting early childhood, such as nurseries, totalled 2,587, representing a capacity of 130,787 places. Responses for the elderly, including Day Centers, Residential Structures for Elderly People, and Home Support Services, amounted to 7,386, with a capacity of 283,276 places, highlighting the pressure exerted by these populations in the context of social action (15).
Considering that people are the most important asset of organizations, training plays a crucial role in improving their quality. The low level of education, as well as the lack of training and updating, characteristic of these professionals is often one of the reasons for the maladjustment of cooked meals (16). A gradual reduction of the sodium content in food constitutes a potential strategy to gradually change consumers since small reductions are undetectable by the human taste (17). Sustained progressive reductions in sodium addition may lead to a future preference for a low-salt diet (18). In addition, WHO recommendations to reduce salt consumption in the population involve the reformulation of the composition of food products and changes in the availability of foods with high salt content (19).
In Portugal, high salt consumption is one of the greatest public health risks and the one that contributes most to the loss of healthy years of life, measures such as these can lead to improvements and health outcomes. The high salt content of the meals served in the Food Units, points to the need for intervention, directed to the introduction of good practices in the process of adding salt to foods. It is crucial to characterize the composition of the meal and to quantify the sodium added by the cooks (20).
Taste is the sense responsible for detecting and differentiating the five f lavours, being decisive in food choices. The preference for salty taste is not innate. The ability to respond to taste occurs with consequent exposure to salty taste. It should be noted that a low-salt diet has demonstrated positive effects on health. Considering that taste sensitivity to salt could determine the quantity of that added to meals, it is relevant to assess the cook’s saltiness sensitivity. Changes in the cook’s eating habits, such as a reduction of sodium intake, may contribute to a reduction of the addition in the cooking process.
This study verifies the impact of saltiness, taste sensitivity, and sodium intake by cooks on the meal’s sodium content.
MATERIAL AND METHODOLOGY
Study Design
An observational, analytical cross-sectional study was performed. The study was carried out in a small city in the center of Portugal. The city has 35 social institutions, of which 29 have a Food Unit, serving on average 4000 meals/day. The research was developed in two randomly selected institutions. The final sample consisted of six female cooks from the institutions that agreed to participate in the study.
The research was authorized by the association manager, as well as by each institution manager where the study was conducted. The informed consent was obtained from all participants after the study was explained, and the confidentiality of the data was guaranteed. This study respected all the ethical principles, and the recommendations of the Helsinki Declaration and WHO and was approved by the Ethics Committee of the Polytechnic Institute of Coimbra (n.º1/2019).
From a methodological point of view, research was carried out on the databases b-on, PubMed®, and ScienceDirect data without data or country limitations, using keywords.
Assessment of Salt Consumption
For the evaluation of cooks' salt intake, two 24-hour recalls in non consecutive days were applied (21), by using the photographic food quantification manual (22) and homemade measures to facilitate the reporting of food consumption. Food data was transformed into nutrients using Food Processor Plus® (FPP®) and the Portuguese Food Composition Table (23). For the quantification of foods, the Manual Food Weight and Portions (24) was used.
The 24-hour recall was replicated on two non-consecutive days, considering this methodology is systematically used by the investigators when analysis of sodium intake in urine is not possible (25, 26).
Assessment of Taste Sensitivity
The taste thresholds of detection and ability to recognize salt were initially evaluated using solutions of sodium chloride at increasing concentrations (27), as well as, with salt and sugar solutions, at different concentrations.
Participants were advised not to smoke, eat, brush their teeth, or consume alcoholic beverages at least two hours before the taste sensitivity test.
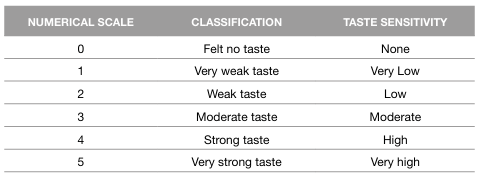
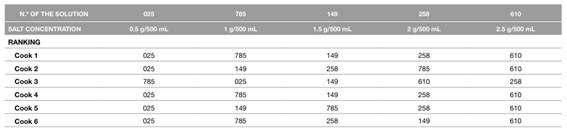
At the moment of the test, they were asked to taste each solution, for 1 minute. The solution should be tasted in the centre of the tongue. The cook should answer about the degree of sensitivity perceived, assigning a value on the scale of taste sensitivity from 0 to 5, as previously described by Neumann et al. (28) in Table 1. They were also asked to order the solutions according to the increase of intensity - Test 1 (Table 1). The second test consisted on testing the ability to identify the composition of the solutions presented in Table 2, identifying the sweet, salty taste or both. It was considered “hit” when the presence of the two solutes were correctly identified and “missed” when only one was indicated (Sweet or Salty). For this test, it was also requested that respondents classify the intensity of solutions for evaluate taste sensitivity. For each test, the participants had at their disposal water between evaluations.

Assessment of Meals Sodium Content
Samples were taken from the main course of two Private Social Institutions over 10 days at the lunch meal, accounting for 20 samples. Subsequently, the samples were grounded, homogenized, and frozen to perform the quantitative assessment of average sodium per meal. Sodium content quantification of meals was performed by laboratory analysis of the samples previously collected by Flame photometry at the Faculty of Nutrition and Food Sciences of the University of Porto (29, 30).
For all meals evaluated, the following data were collected: protein and carbohydrate supplying components, cooking method, institution and cook responsible for salt addition.
Anthropometric Data
The self-reported weight and height were collected to calculate and classify the BMI (31, 32).
Statistical Analysis
Statistical analysis was performed using the statistical program IBM SPSS Statistics® version 24.0 for Windows. Through a descriptive analysis, the mean, standard deviation, and variation intervals (minimum and maximum) were calculated. Due to the small sample size, non parametric tests were chosen.
Differences between the nutritional intake of cooks, the sodium content of meals between institutions, among protein components, and among cooks who added salt to the evaluated meals, and between the answers of Test 2, were evaluated by the Mann-Whitney U test. The Spearman correlation coefficient was used to test the correlations between the sodium content of meals and the sodium intake of the cooks responsible for their addition. The t-student test was used to evaluate the difference between averages of the answers of the sensitivity tests. The Wilcoxon test was used to evaluate the difference in the classification between the responses of the two Tests for the same salt concentration. A statistical significance level of 5% was considered.
RESULTS AND DISCUSSION OF THE RESULTS
Characterization of Nutritional Intake
The average consumption of energy, proteins, lipids, carbohydrates, fiber and sodium of cooks is presented in Table 3.
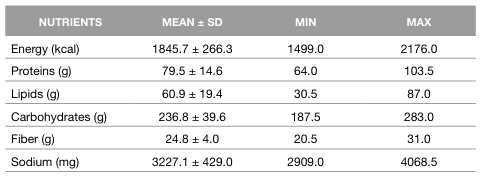
The average energy intake found was higher than the recommendations (31, 32), and the average energy intake of Portuguese women (33). This positive energy balance, besides monitoring overweight and obesity, may contribute to increased sodium intake and should therefore not be neglected (9).
It was found that all the cooks reported higher sodium intake than recommended (32, 34) which may indicate that the amount of salt added to meals they cook would also, probably be high. According to the data reported by The National Food, Nutrition and Physical Activity Survey, 2015-2016 (Portuguese acronym: IAN-AF) that collect representative nationwide and regional data (from 3 months up to 84 years of age) on dietary intake, the average sodium intake in Portuguese women was 2547mg/day (33), values lower than those observed in this study (Table 3). This survey reveals that this micronutrient has a high prevalence of inadequacy in the Portuguese population, with 63.2% of women exceeding the maximum recommended value (33). According to the results presented by Pinhão et al. (21), the average sodium intake in Portuguese adult women was 1837 mg/day, much lower than the value found in the present study (21).
The mean contribution of carbohydrates to total daily energy intake (51%) was higher than observed in the IAN-AF 2015-2016 (48%) (33). On the other hand, the contribution of protein (17%) and lipids (29%) was lower than for the general population (33). It was found that 33.3% of the cooks presented as overweight and 33.4% obese, according to the BMI classification (31) in line with data found by Paula et al. (34) in a similar population.
Assessment of Taste Sensitivity
All cooks showed an increased perception of saltiness following the increase in the solution concentration. However, large discrepancies were observed in the classification attributed to the same concentration by different cooks, with variation for the same solution ranging from “Low Taste” to “Very strong Taste” (Table 4). It was found that one cook didn’t detect the salty taste in the solution containing 0.5 g of salt/500ml, on the other hand, 30% of the cook’s responses pointed to a higher level of sensitivity to salt. Only 2 cooks were able to correctly rank the solutions presented considering salt concentration (Table 5). A study developed by Kim et al. (35) found a relationship between the preference for salt-rich foods and a higher threshold for the detection of salt, suggesting that preference for this type of food may be associated with a growing craving for salty taste (35).

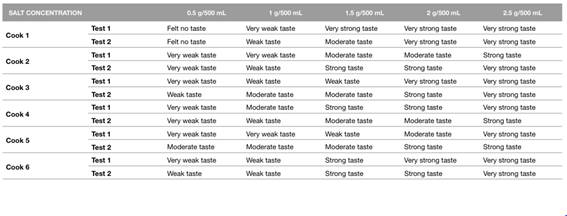
It was found that for all cooks, there was a growing perception of the salted taste with the increase in the sodium concentration of the solution with sucrose (Test 2). The discrepancy in classification attributed to the same salt concentration by different cooks was less expressive when compared to the testing of solutions with salt alone (Test 1).
None of the cooks correctly identified the totality of the samples. It should be noted that the perception of salty taste was masked by the incorporation of the sweet taste, since two cooks considered only the sweet taste up to a concentration of 1.5 g/500 ml of salt. On the other hand, it appears that two, other than those mentioned above, identified the salt concentration of 2.5 g/500 ml exclusively to the salty taste, although the solution also contained sucrose. Piovesana (36) suggested that a high salt intake, as observed among our participants, may lead to a lower taste sensitivity, especially regarding the ability to recognize the salty taste. These premises may justify the fact that two collaborators were only able to detect the salty taste of 2 g salt/500 ml (36).
A strong correlation (r=0.814; p=0.281) was found between the perception of salted solutions with and without sucrose. However, no statistically significant differences were observed between the average responses of the two sensitivity tests (p=0.281).
Comparing the classification of the cooks between the two tests (solutions with salt vs solutions with salt and sucrose) it was found that only 9 of the 30 samples (30%) were equal between the two tests. In 43% of the responses to Test 2 (“Positive Classification”), for samples with the same salt content as in Test 1, a classification with a higher score was observed, revealing a greater perception of salty taste. 27% of the cook’s responses classified salt and sucrose solutions (Test 2) at lower levels than salt-only solutions (Test 1) - Table 4. No statistically significant differences were observed between the classifications obtained in Test 1 and Test 2 (p=0.275). In Test 2, it was verified that only 17 samples out of 30 were identified with the two flavors by cooks. The average number of responses of the cooks correctly identifying the two flavors (“correct”) in Test 2 was higher than those who identified it separately, (p=0.01), suggesting that those who identified the two flavors will have a greater sensitivity to salt than the others (Table 4).
The presence of another flavor in Test 2 there seems to mask the salty flavor. By masking the taste, the perception of salty taste is diminished and may compromise the addition of salt to levels above those recommended by Piovesana (36) described that the sweetness suppresses the salty taste in moderate intensities (36), which may have led the cooks to confuse the flavors. This phenomenon may happen daily in the cooking process, in which salt is added using palate sensitivity, which may be influenced by the expression of meals’ taste.
Assessment of Meals’ Sodium Content
The highest meal sodium content was observed in Institution B, and no differences were observed between institutions (p=0.089).
In all samples, the sodium content was above recommendations (0.2 g of salt per 100 g of food) (4). The promotion of healthier ways of cooking food should be part of the strategy for salt reduction (12, 37, 38). The availability of technological recipes with ingredients and preparation instructions may be a useful tool to combat this problem, as well as the creation of utensils that help food workers in the process of adding salt (20, 39). Although there is a general awareness of slat reduction the concept of “low” is completely subjective, being dependent on the interpretation of everyone, and also subject to the taste of those who cook the meals (11).
According to the results of the IAN-AF 2015-2016, added salt is the largest contributor, about 29.2%, to the high levels of sodium consumption in Portugal (33, 39). Piovesana also pointed out that kitchens are the largest source of sodium (36). The same was observed in the study of Johnson, et al. (40), in which the added salt contributed more than 80% of the total salt intake (40). According to the results presented by Gonçalves et al. (11), 33.8% of the employees’ respondents believe that one of the determinants of the quantity of salt produced is the taste of the handler responsible for adding salt (11). The values found in the analysed meals are in line with results obtained by several authors (9, 41, 42). Viegas reported results 0.71-0.92 g of salt/100g of food for school meals (43).
No significant differences were observed between the salt content of the fish and meat meals nevertheless fish melas presented higher sodium content as already reported by the author (43).
Some studies support the evidence that salt masks the bitter taste of vegetables and fish and has probably been used as a strategy to promote the acceptance of these kinds of foods (41, 44), which may justify the results obtained in this study.
No correlation (p=0.74) was observed between the quantity of salt of meals and the salt intake of the workers responsible for its addition, in opposite to that observed by other authors (18). Although no significant differences were observed, the high sodium content found in meals, suggests an excessive addition of cooking salt, which may be attributed to the taste sensitivity of cooks responsible for preparing the meal (18, 27, 45). The implementation of salt reduction measures in catering should also integrate strategies related to the salt consumption of food workers. (43), stated that one of the aspects that may be the origin of the difficulties in implementing these measures is the fact that there is a need to quantify this reduction (43), once salt addition is most of the time performed empirically, and not quantified, being associated with individual variability of the person responsible for its addition (2, 27). The main limitations identified are related to the small sample size, the methodology for the quantification of salt intake that involves respondent’s memory as well as social desirability. Self-reporting of the anthropometric parameters was used due to the absence of equipment for evaluation and considering the reliability/correlation of the evaluated measurements and self-reporting already described by others (46).
CONCLUSIONS
There was no relationship between the cooks' salt intake and the salt content of the meals they cooked. The cooks' sodium intake was much higher than the recommendations. The sodium content of the meals analysed was also high. Sensitising and training food workers to reduce the amount of salt added to meals is fundamental to improving the nutritional quality of meals in accordance with health and nutritional guidelines. Reducing sodium intake is a viable, effective and safe non-pharmacological therapy for hypertension.
Sensitising and training cooks to reduce the salt content of meals is fundamental to improving the nutritional quality of meals in accordance with health and nutritional guidelines; the perception of salt by cooks is relevant, since taste sensitivity to salt can influence the seasoning of meals; The gradual reduction of sodium content in food is a potential strategy for gradual consumer change, since small reductions are undetectable by the human palate. Changing cooks' eating habits, such as reducing sodium intake, may contribute to a reduction of the addition in the cooking process.
AUTHORS’ CONTRIBUTIONS
Conceptualization: DAS, JPML and AR; Methodology: JPML and DAS; Formal analysis: DAS and JPF; Investigation: DAS and JPML; Data curation: DAS; Writing-original draft preparation: DAS and JPML; Writing-review and editing: AR; Supervision: JPML and AR. All authors have read and agreed to the published version of the manuscript.

