




 Inglês (pdf)
 Artigo em XML
 Referências do artigo
 Tradução automática
 Enviar este artigo por email
 Citado por SciELO
  Similares em
SciELO
Similares em
SciELO 
 Permalink

INTRODUCTION
The prevalence of overweight and obesity has risen dramatically in the last decades. According to data from the Portuguese National Food and Physical Activity Survey, 23.6% and 8.7% of adolescents live with overweight and obesity, respectively (1). Accordingly, about half of Portuguese adolescents have an unhealthy dietary pattern, with low consumption of fruits, vegetables, and pulses (2). Inadequate nutrition is one of the leading preventable causes of non-communicable chronic diseases (NCDs), loss of quality of life, and premature mortality in Portugal (3).
School lunches have the potential to tackle these challenging problems by establishing healthy eating habits early in life and contributing towards a sustainable healthy diet in adulthood (4-6). Students who participate in school lunch programs have been found to have better nutrient intake (7), higher overall diet quality (8), reduced risk of obesity (9), and better academic results (10) than those who do not participate. In Portugal, the National School Lunch Program has undergone several changes to fulfil new nutritional and public health concerns in the last decades. At the beginning of the 20th century, the initial aim was to improve food security by preventing children’s undernutrition. Nowadays, school lunch focuses on food quality and promoting healthy and sustainable food habits (5) as a strategy to reduce children’s overweight and obesity. Nevertheless, school meals are still an important safety net for many students from low-income families, mitigating disparities in access to nutritious meals (11).
Despite this investment, less than half (42.0%) of Portuguese students of the 2nd and 3rd cycles attend the school canteen (12). A recent study on the health of Portuguese adolescents reported that 54.4% of students say that school lunches are their least favourite thing at school (13). Also, food waste is high (32.3%) (14), indicating low satisfaction with meals (15). This scenario is also common in other countries (16-18). School lunch participation may be influenced by multiple factors, like the stigma associated with being a low-income student relying on the school meal program (19, 20), hunger (21), quality and variety of food offered (22), food appearance and taste (23), length of the lunch period (22), time waiting in line (22), price (24), food environment near schools, such as fast-food restaurants and grocery stores (25) and preference to eat lunch at or from home (21). Additionally, the food environment of the school canteen can influence students' satisfaction with the meal (26). Research shows that a meal served in a school canteen is less appreciated than when the same meal is served in a restaurant (27), revealing that the negative perception of school meals significantly impacts satisfaction.
To address the low school lunch participation and satisfaction among adolescents, the R23 project was implemented as a quasi-experimental trial in two schools in Benavente, Portugal. This study was designed to evaluate the impact of a co-created intervention, focusing on a comprehensive redesign of the lunchroom, meal service, and menu. The project spanned an entire school year, focusing on adolescents aged 10-16 years. The R23 project is based on the hypothesis that a school lunch experience co-created with students could increase participation and satisfaction, potentially promoting healthier eating habits and better health indicators.
OBJECTIVES
This cross-sectional study aimed to evaluate school lunch participation and explore the factors influencing students' decisions to participate. Additionally, it sought to examine the associations between school lunch participation and variables such as sociodemographic factors (age, nationality, grade), socioeconomic status, dietary behaviour (adherence to the Mediterranean Dietary Pattern (MDP) - KIDMED), and health outcomes (Body Mass Index (BMI) and Waist-to-Height Ratio (WHtR)).
METHODOLOGY
Study Design and Sample
This paper describes the baseline results of the R23 project and includes data collected during the first five weeks of the 2022/2023 school year.
The Benavente Municipality has two schools with 2nd and 3rd cycle education (5th to 8th grades; 10 to 16 years old; n = 1038). All students are eligible to participate in this study.
The study was reviewed and approved by the Faculty of Food and Nutrition Science of the University of Porto Ethics Committee (118/2023/ CEFCNAUP). All participants were informed of the study’s goals, and written informed consent was obtained from parents or guardians.
Measurements
Data were collected using a two-level measurement approach, encompassing both the individual (student) and institutional (school) levels. At the student level, trained research assistants administered a standardised, face-to-face structured questionnaire to gather sociodemographic data, socioeconomic status, anthropometric measurements, adherence to the MDP, average weekly school lunch participation and barriers to school lunch participation (SLP). At the school level, daily SLP was also measured.
Sociodemographic
Date of birth, nationality, grade, and gender were collected for each student.
Socioeconomic Status
Socioeconomic status was evaluated using two indicators: information on eligibility to subsidise free or reduced-price meals (FRPM) obtained via the school administrative database and a scale that indirectly determines family wealth (Family Affluence Scale (FAS)).
School lunch prices cover three brackets of family income level (A, B, and C). Students in brackets A and B have 100 per cent and 50 per cent of school food expenses covered by public funds, respectively. Those in bracket C pay the full price of their meal, currently set at €1.46. The FAS used in the protocol of the international study Health Behaviour in School-aged Children (HBSC) (28) is a way of assessing family wealth, solving the usual problem of lack of answers when used in questionnaires the parents' occupation and education level (29). The FAS includes items that reflect a family’s material resources, consumption patterns, and purchasing power (29). The FAS score was calculated for each student based on the answers to 6 questions on a scale ranging from 0 to 13 points, where higher values indicate a higher economic level.
Anthropometry
Anthropometric measurements were performed according to recommendations (30) in physical education classes. Weight, height, and waist circumference (WC) were measured using a portable electronic weight scale (Seca 877, Hamburg, Germany), a portable stadiometer (Seca 217), and a measurement tape (Seca 203), respectively, with the participant barefoot, wearing light clothing.
BMI-for-age Z-scores were calculated using the World Health Organization (WHO) software Anthroplus (31). The WHO cut-off points were used (32).
WHtR was calculated by dividing WC by height and categorised as follows: <0.5 appropriate and ≥0.5 increased risk of cardiovascular disease (33, 34).
Mediterranean Diet Quality Index for Children and Adolescents
To assess adherence to the MDP, the Mediterranean Diet Quality Index for Children and Adolescents (KIDMED) questionnaire was applied (35). The KIDMED score was calculated from sixteen yes/ no questions and validated for Portuguese adolescents (36). The f inal scores of the KIDMED index varied between -4 and 12 points, with higher scores indicating higher adherence to the MDP. Students were classified into three categories: ≥8, high adherence (optimal Mediterranean diet); 4-7, moderate adherence (improvement is needed to adjust intake to Mediterranean patterns); and ≤3, low adherence (very low diet quality).
School Lunch Participation
Adherence to the school canteen was studied in two ways: the daily number of meals served in each school canteen and the answers obtained in the questionnaire applied to students.
The number of meals served per day, for 25 days, was obtained through the EduBOX SIGA platform (Integrated Management and Learning System), which manages the school meal booking service. The daily SLP was calculated according to the following formulas:
SLPAdults (%) = No. of meals served to adults / No. Adults working in school x 100 (1)
SLPStudents (%) = No. of meals served to students / No. of enrolled students x 100 (2)
SLPFRPM (%) = No. of meals served to FRPM students / No. of eligible FRPM students x 100 (3)
With the question “On average, how many days a week do you have lunch in the canteen?” another variable was obtained, average weekly school lunch participation (awSLP), whose responses were categorised according to Sturion et al. (37) as: non-adherence (nonparticipation); partial adherence (participation one to three times a week) and effective adherence (participation four to five times a week).
Reasons for participation and nonparticipation were evaluated in the questionnaire with the application of 6 closed questions: What is the main reason why you eat lunch in the canteen? What is the main reason why you don't eat lunch every day in the canteen? Where do you usually have lunch when you have free mornings/afternoons? What is the main alternative when you don't have lunch in the canteen? What is the main reason for not attending your school's canteen? Where do you have lunch most often?
Statistical Analysis
Statistical analysis was performed using IBM SPSS Statistics for Windows (V.27.0). Descriptives are presented as the mean and standard deviation (SD) for continuous variables and counts and percentages for categorical variables.
The normality of continuous variables was assessed using the Shapiro Wilk test (n <50), or using the criteria of asymmetry and flatness coefficients (n >50), depending on sample size.
Pearson or Spearman correlation coefficients assessed associations between school lunch participation (awSLP) and age, grade, FAS, FRPM, BMI, WHtR, and KIDMED. Strength of the correlation is very weak if |r| <0.25, weak if 0.25≤ |r| <0.5, moderated if 0.5≤ |r| <0.75, strong if 0.75≤ |r| <0.9 or very strong if 0.9≤ |r| ≤1.
Multivariate Analysis of Covariance (MANCOVA, General Linear Model, multivariate) was used to evaluate the association between the dependent variables, BMI, WHtR, KIDMED, and the independent variable awSLP. Fixed factors included gender, nationality, FRPM, and grade. Covariates were age and FAS. Associations between BMI, WHtR, and KIDMED and the covariates were also analysed. The final model was determined using stepwise backward deletion until the adjusted R2 decreased. The level of significance was set at p <0.05.
RESULTS
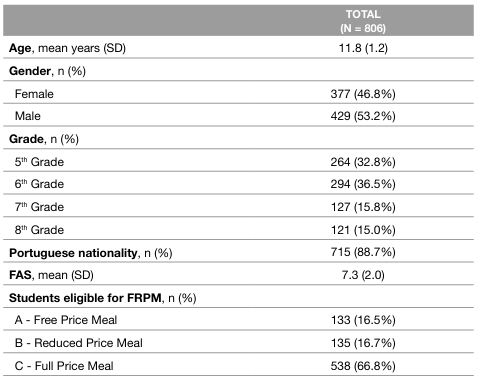
Of the total of 1038 students enrolled in these two schools, all invited to participate, 232 students were not evaluated due to refusal by the parent (n = 115), non-return of informed consent (n = 86), or absence in the evaluation day (n = 31). The student participation rate for the baseline data collection of this study was 77.6%. From this initial total sample, 806 students (377 girls and 429 boys) aged 10 - 16 years (mean age of 11.8 ± 1.2 years) provided complete data on the variables of interest of the present report. They, therefore, were included in the study (Table 1).
Table 1: Sociodemographic and socioeconomic characteristics of the participants
FAS: Family Affluence Scale
FRPM: Free or Reduced Price Meals
SD: Standard Deviation
One-third of the students were entitled to FRPM (33.2%; n = 268), 16.5% (n = 133) were entitled to free, and 16.7% (n = 135) to reduced-price meals. A weak, significant positive correlation exists between FAS and FRPM (rS=0.349; p <0.001).
School Lunch Participation and Factors that Influence Participation Decisions
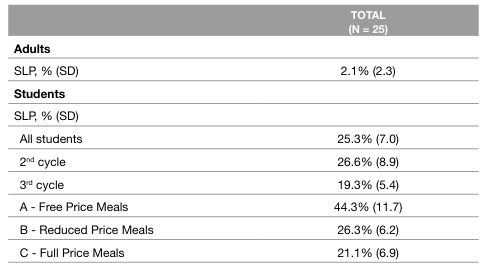
SLP was very low for students (25.3%) and adults (professors and school staff; 2.1%). The SLP was higher for 2nd cycle students (26.6%) than for 3rd cycle students (19.3%) (Table 2).
Table 2: School lunch participation, for adults and students, according to the school lunch booking system
SD: Standard Deviation
SLP: School lunch participation
On average, less than half of the students (44.3%) who benefit from free meals had lunch in the school canteen daily. An even inferior percentage was observed for reduced-price meals, with only 26.3% of students with this benefit having lunch at school (Table 2). 39.1% (n = 315) of students reported never attending the school canteen (Table 3). Most students had partial adherence to the canteen (37.8%) when compared to effective adherence (23.2%) (Table 3).
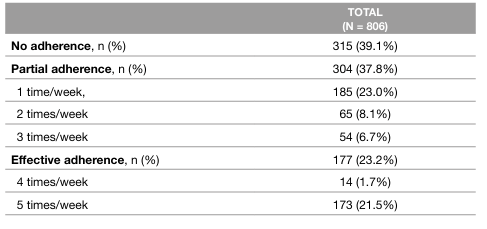
The main reasons stated by students to participate in school lunch (n=491; 60.9%) were the schedule (60.9%) when they only had one lunch hour and the fact that they had no one at home to cook lunch (17.1%). Some students mentioned lunch quality as a determining factor in choosing school lunch (7.6%). Students' main reason for not having lunch every day in the canteen was that they prefer to have lunch at home when they do not have classes in the morning or afternoon (87.8%). For most students, the main alternative to the canteen was having lunch at home (83.2%).
The main reasons given by the students for never having lunch at school (n=315; 39.1%) were the fact that they live close by (41.3%) and the quality of the meals (34.6%), which they did not like. These students chose to have lunch at home (69.5%), with family members (14.3%), take their lunch box (10.2%), or have lunch at nearby restaurants (4.8%).
Anthropometry and Adherence to the Mediterranean Dietary Pattern
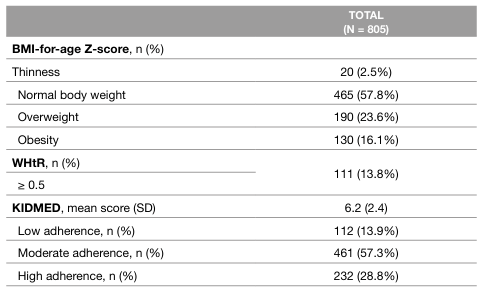
Overweight was 23.6%, and obesity was 16.1%. About 13.8% of students had an increased risk of cardiovascular disease (WHtR ≥ 0.5) (Table 4).
Table 4: Percentage of students according to Body Mass Index classes, Waist-to-Height ratio ≥ 0.5 and Mediterranean Diet Quality Index for Children and Adolescents
BMI: Body Mass Index
WHtR: Waist-to-Height ratio
KIDMED: Mediterranean Diet Quality Index for Children and Adolescents
SD: Standard Deviation
The average KIDMED Index score was 6.2 ± 2.4 points; 28.8% of students had high, 57.3% moderate, and 13.9% had low adherence to MDP (Table 4).
There was a statistically significant negative association between the KIDMED Index score and BMI Z score (rP= -0.083; p=0.019) and WHtR (rP= -0.116; p<0.001). The higher the BMI and the WHtR, the lower the adherence to MDP.
School Lunch Participation and its Association with Socioeconomic Status, Mediterranean Dietary Pattern, Body Mass Index, Waist-to-Height Ratio
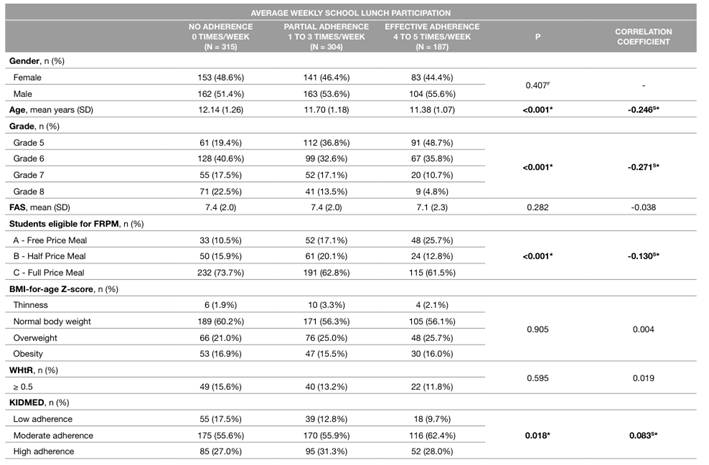
Using average awSLP data reported by students in the face-to-face questionnaire, we tested possible associations with the following variables: gender, age, grade, FAS, eligibility to FRPM, BMI, WHtR, and KIDMED (Table 5).
Table 5: Percentage of students by participation status in each variable. Correlation between school lunch participation classes and age, grade, Family Affluence Scale, Students eligible for Free or Reduced Price Meals, Body Mass Index-for-age Z-score, Waist-to-Height ratio, and Mediterranean Diet Quality Index for Children and Adolescents
* Values of p <0.05 indicate that there is a significant correlation between variables
BMI: Body Mass Index
F: Fisher Exact Test
FRPM: Free or Reduced Price Meals
FAS: Family Affluence Scale
WHtR: Waist-to-Height ratio
KIDMED: Mediterranean Diet Quality Index for Children and Adolescents
S: Spearman Correlation
SD: Standard Deviation
There was a negative, weak, but significant correlation between age (rS= -0.246; p<0.001), grade level (rS= -0.271; p<0.001), and awSLP. Students in higher education years and older went to the school canteen less often. There is also a negative, weak correlation between the eligibility for FRPM and school lunch participation (rS= -0.130; p<0.001). Students entitled to FRPM went to the canteen more often. In this study, 33.2% (n = 268) of students were eligible for FRPM. Notably, 31% (n = 83) of these students reported never having lunch in the school canteen (Table 5).
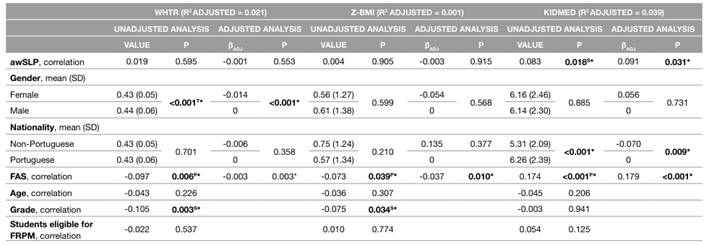
There was a positive correlation between awSLP (categorised as non-adherence, partial adherence, and effective adherence) and the KIDMED (rS= 0.083; p=0.018). Higher awSLP correlates with greater adherence to the MDP. After adjustment for gender, nationality, and FAS, an increase of 1 day per week in school lunch participation contributed to a significant KIDMED score increase of 0.091 (Table 6). However, there was no significant association between awSLP and BMI and WHtR (Tables 5 and 6).
Table 6: Associations between Body Mass Index, Waist-to-Height ratio, and Mediterranean Diet Quality Index for Children and Adolescents and average weekly school lunch participation, adjusted for gender, nationality, and Family Affluence Scale
awSLP: Average weekly School Lunch Participation
WHtR: Waist-to-Height ratio
Z-BMI: Z-score Body Mass Index
KIDMED: Mediterranean Diet Quality Index
FAS: Family Affluence Scale
FRPM: Free or Reduced Price Meals
βADJ: Adjusted Effect
P: Pearson Correlation
S: Spearman Correlation
SD: Standard Deviation
T: t-test
* Values of p <0.05 indicate that there is a significant correlation between variables
Furthermore, we found a significant correlation between FAS score and BMI (rP= - 0.073; p<0.039), WHtR (rP= - 0.097; p<0.006), and KIDMED (rP= 0.174; p<0.001), maintained after adjustment. Students with higher socioeconomic status had a greater adherence to the MDP and healthier BMI and WHtR (Table 6).
Female students had a significantly lower WHtR of -0.014 compared to males. Non-Portuguese students had a significant decrease in KIDMED scores of -0.07. Students in lower grades had significantly healthier WHtR and BMI (Table 6).
DISCUSSION OF THE RESULTS
Main Findings
Students' school lunch participation (awSLP) was significantly associated with age, school grade, eligibility to FRPM, and adherence to MDP. Younger students, mainly from the 2nd cycle, who were eligible for free or reduced-price meals, participated at a higher rate. Students with a higher awSLP had a healthier diet.
The average student’s daily SLP was 25.3%, with a higher rate for 2nd cycle students (26.6%) than for 3rd cycle students (19.3%). These results are much lower than the 42% reported by Madeira in 2014 (12) and showed very low adherence to school lunches by Benavente students. Adults’ participation rate was astonishingly low (2%), revealing that almost all professors and school staff chose not to have lunch in the canteen. This result was also found in the study by Thompson et al. (38). According to Martins et al. (39), the acceptability of a food unit can be classified into four categories: high (adherence above 70%), medium (50 to 70%), low (30 to 50%), and very low (below 30%). According to this classification, the degree of Benavente school food service acceptance was very low since only 25% of students and 2% of adults attended the school canteen every day.
The students’ main reasons for school lunch participation were the schedule, having no one at home, and lunch quality. On the other hand, students who never ate in the school canteen say that the primary reasons are that they lived close by and disliked the food served. These results align with a recent study on Portuguese adolescents’ health that reported that 54.4% of students consider lunches their least favourite thing at school (13). Disliking the taste of school lunches is one of the most frequently mentioned reasons for non-participation (21, 40, 41).
Association Between Average Weekly School Lunch Participation and Adherence to the Mediterranean Dietary Pattern, Body Mass Index, and Waist-to-Height Ratio
One of the most relevant results of this study was the positive association between adherence to MDP and SLP. Our results reinforce the assumption that school meals have the potential to improve children’s diets and add to the body of evidence (7, 8). A French cross-sectional study also found an association between school lunch participation and healthier eating habits among adolescents (41).
As several authors have pointed out, one advantage of school meals is the potential to fight the childhood obesity epidemic (9). However, this study found no evidence of an association between SLP and BMI and WHtR. This result is consistent with previous works (42, 43) and can be explained by the influence of food eaten outside the school canteen and physical activity level.
Association Between Average Weekly School Lunch Participation and Socioeconomic Status
We could observe an association between FRPM and SLP. Students not eligible for FRPM go to the school canteen less often. This finding is in line with American reports (21).
Furthermore, there was an association between FAS and MDP, BMI and WHtR. Students from low-affluence families had lower adherence to MDP and higher BMI and WHtR. Several studies from Portugal (44), Italy (45), Greece (46), and Spain (35) have reported similar results. Low-income students tend to have less access to healthy food (47), poorer dietary quality (48), and a higher risk of obesity (49-51).
These findings are important considering that the Portuguese school lunch program is committed to the principles sustaining MDP (52), has a reduced controlled cost of 1.46 €, and is eligible for FRPM application, constituting a great opportunity, especially for students from low-income families, to improve their diet quality. However, in our study, only 27% (n = 72) of the students eligible for FRPM effectively adhered to school lunch. Surprisingly, 31% (n = 83) of the students with economic support chose never to eat lunch at the school canteen. This may be due to a stigmatising problem already described by other authors (19, 20).
Study Implications
Ensuring the effective implementation of current Portuguese school food guidelines by defining a model for supervising compliance is an essential political priority action set by the Portuguese National Program for the Promotion of Healthy Eating (53). Investing in actions to promote school lunch participation and satisfaction should be of no lesser importance. Otherwise, we risk having perfectly safe and nutritious school meals served to just a minor percentage of students, mostly from low-income families that do not have any other option.
A recent systematic review has studied several strategies to increase SLP (54). These include taste tests (55), modified menu options (56), changes to the canteen environment (57), policy restrictions on competitive foods (58), and implementation of nutrition standards (59). Universal free school lunches (UFSL), free meals to all students regardless of family household income, are also considered a possible action to increase participation (17). To achieve higher school lunch participation, students’ opinions as consumers must be collected to understand their requirements. Also, more ambitious policies and public investment are necessary for high food service quality. A higher budget for food provision is essential, as well as hiring more staff, acquiring modern equipment, and redesigning the lunchroom, making it an appealing experience and hopefully stopping the widespread association of school lunches with bland food and second-class meals (5).
Strengths and Weaknesses
One limitation of this study was its scope. Our study examined a large sample size of 2nd and 3rd cycle students from Benavente but represented only a small study population from Portugal. Thus, a further study with a representative sample from all Portuguese regions would be an interesting next step.
Also, the study’s cross-sectional design does not allow cause and effect analysis.
On the other hand, to the best of our knowledge, this was the first study in Portugal to study associations between SLP and FRPM, MDP, BMI, and WHtR.
CONCLUSIONS
Our findings suggested that greater SLP was positively and significantly associated with higher adherence to MDP. On the other hand, greater adherence to MDP was associated with healthier BMI and WHtR. These results reinforce the role of school lunches in promoting a sustainable healthy diet in students and stress the need for more investment in the school food service. The next step should be co-creating a school food service that can serve not only safe and nutritious meals but also one that students and parents consider an enjoyable place to have lunch. Ignoring that the school canteen is more than a place to eat a healthy lunch will undermine the success of all the policy interventions.
AUTHORS’ CONTRIBUTIONS
RE, DT and MJG: Conceptualization; RE: Methodology; RE: Project administration; RE, CJS: Investigation; RE: Data curation; RE and BMPMO: Statistical analysis; RE: Writing-original draft preparation; RE, CJS, BMPMO, DT and MJG: Writing-review and editing; DT and MJG: Supervision. All authors have read and agreed to the published version of the manuscript

