Introduction
Olfactory pathways extend far beyond the simple detection of odors, acting as a vital link between the sense of smell and various brain functions, including cognition, behavior and immune system activity 1,2. This unique relationship between smell and cognition is further underscored by the evolutionary development of the olfactory system. Unlike other sensory modalities, olfaction bypasses the thalamus, a relay center for most senses, and projects directly to the limbic system and other higher brain regions 2,3. This intimate connection suggests that odors can trigger immediate emotional responses and influence behavior 4.
The interplay between olfaction and the limbic system, integrating emotions and memory, is likely to be a key factor in the success of OT. In fact, studies suggest a strong connection between olfactory training (OT) and cognition (5. Positron emission tomography (PET) studies further support the role of the orbitofrontal cortex in processing emotionally charged odors and decision-making (2,3,6. Ultimately, Electroencephalographic (EEG) readings can be performed at this region to detect activity in response to odors 7.
With this in mind, the primary objective of this work was to investigate the neurocognitive effects of OT in individuals with OD compared to healthy controls, by employing EEG to assess brain activity during the inhalation of common OT scents. Secondary objectives included examining potential relationships between specific odorants and unique brain activation patterns measured by EEG, as well as investigating whether individual variations in baseline smell function influenced the response to olfactory training as measured by brain activity.
Material and Methods
Participants
This case-control prospective study recruited participants from two groups: individuals diagnosed with olfactory dysfunction (OD) and healthy controls with normal olfactory function. To confirm or rule out OD, all participants underwent a standardized olfactory perception test (OPT) using the Sniffin' Sticks threshold test 8. A cut-off OPT of 7 was chosen to define hyposmia accordingly to relevant Literature and manufacturers´ information 9-12. Exclusion criteria for controls were: age < 18 years, OPT ≤ 7, chronic rhinosinusitis, history of head trauma with loss of consciousness, documented pre-existing olfactory dysfunction, pregnancy, previous neurosurgery or endoscopic nasal surgery, known olfactory bulb lesions on imaging, known neurologic disease (Parkinson's, Dementia, Epilepsy). Inclusion criteria for cases: age > 18 years, reporting OD with objective OPT ≤ 7.
Experimental Environment
The experiment was conducted in a controlled environment designed to minimize external influences on brain activity measured by EEG. The room was maintained at a standard temperature and ensured to be quiet and well-ventilated to optimize participant comfort and focus during the testing session.
Experimental Protocol
The experiment consisted of a series of odor exposures while EEG data was collected. Each participant underwent the following procedures:
Baseline Measurement: The session began with a one-minute baseline recording where participants were exposed only to clean, odorless distilled water. This established EEG resting brain activity before scent introduction. To ensure a neutral starting point for each odor presentation, this baseline measurement was repeated between each scent inhalation. Participants then proceeded with the one-minute exposure to the designated odor.
Odor Presentation: Following the baseline, participants were exposed to four different odorants: rose, lemon, eucalyptus, and clove. Each odor was presented for a duration of one minute. During odor presentation, participants were instructed to stay quiet and inhale deeply while focusing on the specific scent, minimizing any mental distractions.
Inter-Stimulus Interval: A brief inter-stimulus interval was included between each baseline-odor presentation sequence (approximately 30 seconds). This interval allowed participants' brains to return to a relatively neutral state.
EEG Recording and Analysis
This study employed a single-channel electroencephalography (EEG) sensor to record brain activity during odor exposure. The sensor, a NeuroSky Mindwave 2, was positioned on the participant's scalp according to the international 10-20 system at the AF3 channel, a location associated with olfactory processing. This non-invasive sensor offers a sampling rate of 512 Hz, capturing EEG data at a rate of approximately once per second.
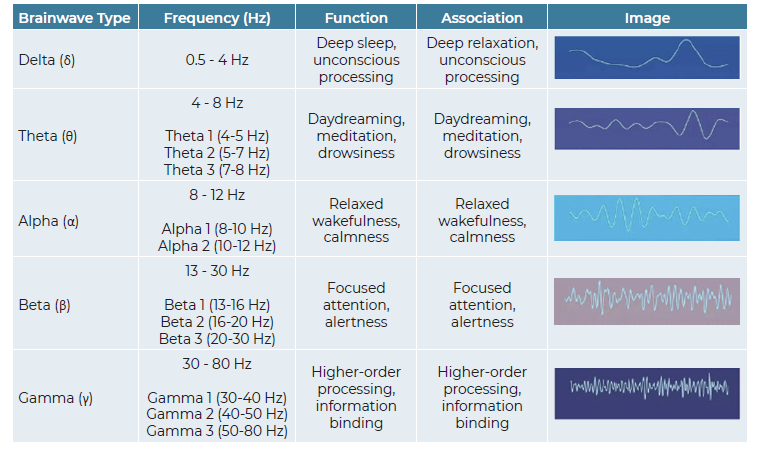
The EEG data was analyzed to assess the power spectrum frequencies of various brain waves, including Theta (θ), Delta (δ), Alpha 1 (α1), Alpha 2 (α2), Beta 1 (β1), Beta 2 (β2), and Gamma (γ) waves. Each of these wave types is associated with distinct brain states. For example, Alpha waves are typically associated with relaxed wakefulness, while Beta waves are linked to focused attention (see Table 1). The performance-to-baseline ratios for each brain-wave/odor sequence were recorded in a database. Performance-to-baseline ratios: refers to the ratio of the EEG activity during odor exposure (performance) to the EEG activity during the baseline recording (baseline). This ratio provides a measure of how odor exposure affects brain activity compared to a resting state.
To provide a more comprehensive understanding of brain activity during odor exposure, an "Activation Index" (AI) was calculated. This index aimed to capture the balance between mental activation and resting/sleep states. The AI was derived by dividing the sum of the power spectrum values for activating waves (Gamma 1, Gamma 2, Beta 1, and Beta 2) by the sum of the power spectrum values for resting/sleep waves (Theta, Delta, Alpha 1, and Alpha 2). A higher AI score indicates a greater level of mental activation during odor exposure.
Ethics
Informed consent was obtained for all patients and was submitted to local Ethics Committee approval. Design complies with the Declaration of Helsinki´s ethical standards.
Data Analysis
The collected EEG data, including individual wave power spectrums and the calculated AI scores, were statistically analyzed. This analysis compared brain activity patterns between the OD and control groups for each odorant presented. The goal was to identify any significant differences in neural responses to the various scents between individuals with and without OD.
Statistical analyses were conducted using IBM SPSS Statistics 29 software. Descriptive statistics were employed, presenting categorical variables as percentages and continuous variables as means and standard deviations. The Shapiro-Wilk test confirmed normal distribution for continuous variables. Bivariate analysis explored asymmetries in measurements between groups by means of independent t-test. Pearson Chi-square/ Fisher´s tests (95% confidence intervals) were used for categories and Spearman´s test for continuous variables. Mixed ANOVAs were performed to compare brain wave responses to each odor (test for between-subjects effects being group). An additional mixed ANOVA with within-subjects factor being type of odor and between-subjects factor being group (OD or control) checked asymmetries in activation index. This allowed the production of graphical representations on differences between groups for each scent. P-values derived from ANOVA models were obtained after Mauchly´s test of sphericity. When sphericity assumption was violated, Greenhouse-Geisser test was preferred. All reported p-values are two-tailed, with a significance level set at p ≤ 0.05.
Results
Population
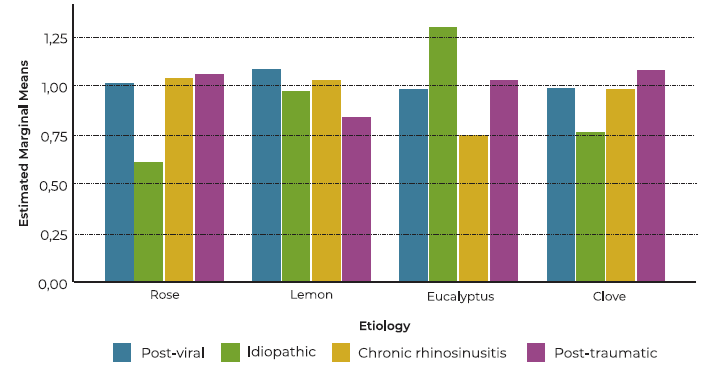
A general description of the main variables is displayed on Table 1 . A total of 34 patients were enrolled, 15 cases and 19 controls. 21 % of cases and 46.7 % of controls were male. No differences were noted in age and sex distribution between groups (p > 0.05). Within the 15 participants diagnosed with OD, nine (60%) had post-viral etiology, three (20%) had chronic rhinosinusitis, two (13.3%) were classified as idiopathic, and one (6.7%) post-traumatic. A within-group analysis revealed no significant effect of sex on the activation index for any of the tested odors (rose, lemon, eucalyptus, clove) in either the olfactory dysfunction (OD) group or the control group (all p > 0.05). This suggests that sex does not play a significant role in modulating the neural responses to these specific odors within the context of this study. Figure 1 displays mean activation index for each OD etiology.
Bivariate analysis
Rose inhalation showed a significant difference between OD and control groups, with lower Alpha 1 activation (OD: 0.90 ± 0.13 vs controls: 1.05 ± 0.19, p=0.021). Eucalyptus inhalation revealed lower Beta 1 activation in OD patients (OD: 0.88 ± 0,14 vs controls: 0.99 ± 0.15, p = 0.037). Clove inhalation presented significant differences in various frequency bands: Gamma 1, Beta 2 and Alpha 2 were lower in OD (OD γ1: 1.01 ± 0.12 vs controls γ1: 1.13 ± 0.18, p = 0.046; OD β2: 0.96 ± 0.16 vs controls β2: 1.10 ± 0.13, p = 0.019; OD α2: 0.92 ± 0.17 vs controls α2: 1.05 ± 0.15, p = 0.039); and Delta activity was higher in OD for clove inhalation (OD δ: 1.12 ± 0.21 vs controls δ: 0.97 ± 0.1, p = 0.019). The Activation Index significantly differed during clove inhalation, being lower in OD (OD AI: 0.97 ± 0.11 vs controls: 1.1 ± 0.12, p = 0.044).
Remarkably, no differences were found in any parameter related to lemon inhalation (p > 0.05). There was a positive correlation between baseline OPT and activation index for clove (p = 0.038), but not for any other scent (p = 0.187 for rose; p = 0.616 for lemon; p = 0.320 for eucalyptus).
Multivariate analysis
Additional ANOVA models were created in order to further validate the findings from the former analysis (Table 2).
Table 2 Main variables description and bivariate analysis: hominids versus modern humans
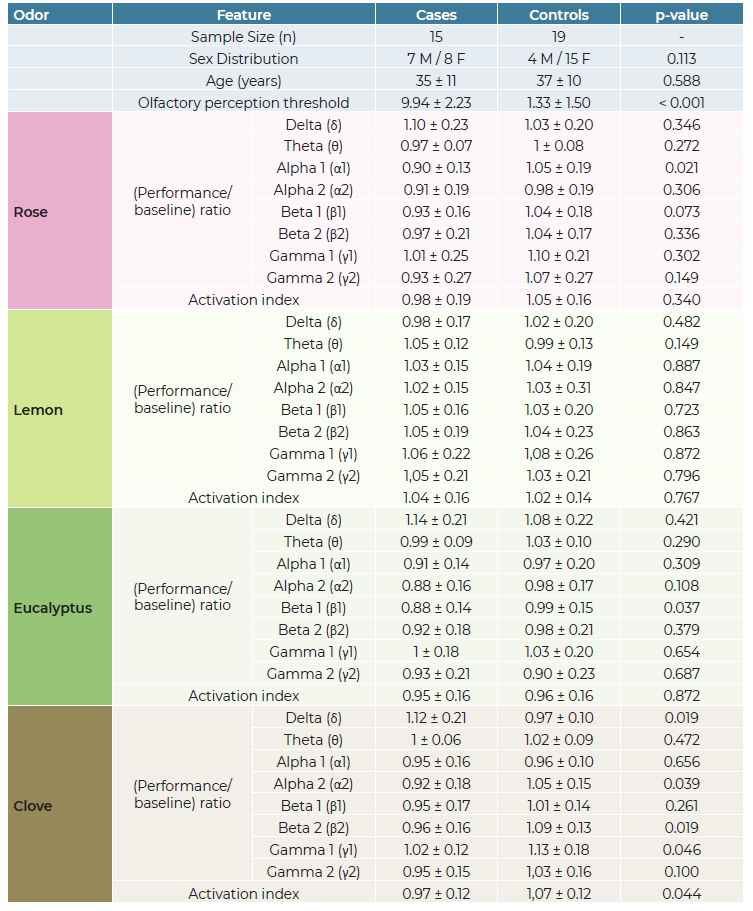
M = Male, F = Female; Values are presented as Mean ± Standard Deviation; p-value indicates statistical significance between cases and controls. A value of less than 0.05 (in bold) is considered statistically significant.
Brain wave responses to Rose: OD vs controls
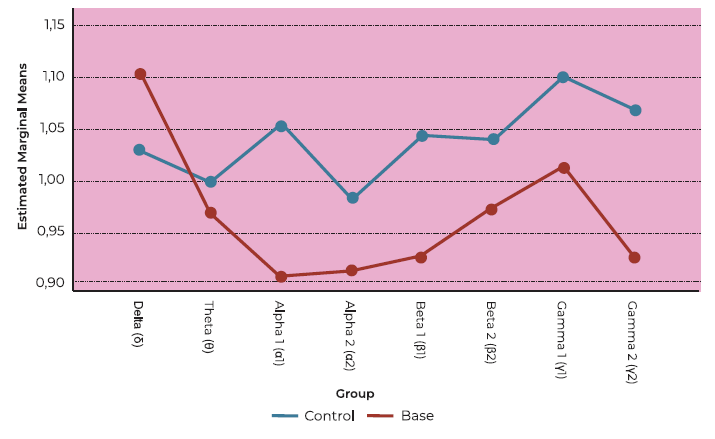
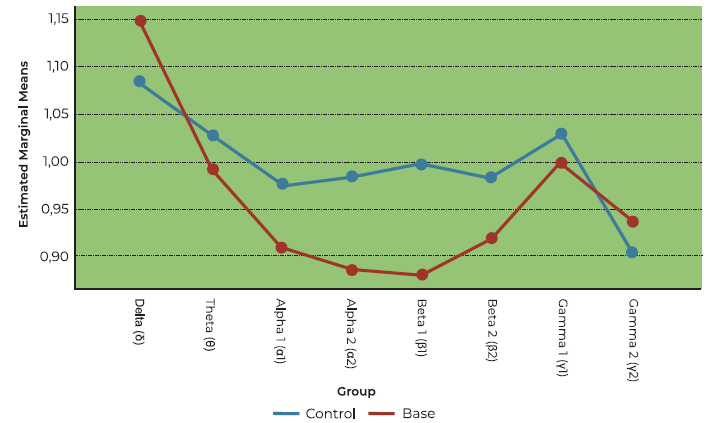
The main effect of olfactory dysfunction on brain activation to rose was not significant in this model (F (1,59) = 3.076, p = 0.090). Nevertheless, there was a tendency for significance (see Figure 2). Analysis of performance-to-baseline ratios across frequency bands revealed no statistically significant differences (F (7, 203) = 1.748, p = 0.182).
Brain wave responses to Lemon: OD vs controls
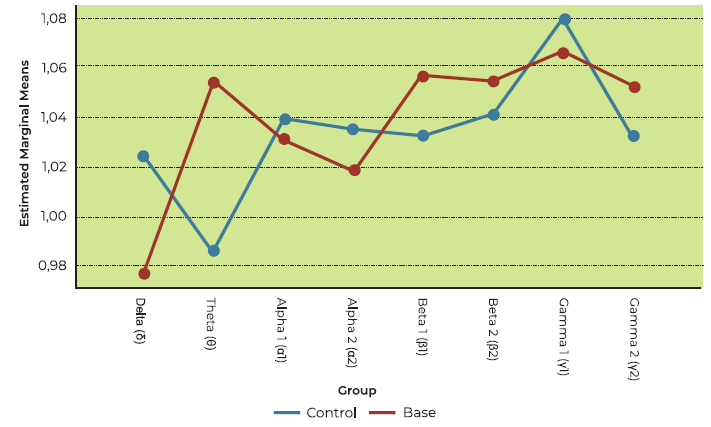
The main effect of olfactory dysfunction on brain activation to lemon was not significant in this model (F (1,29) = 0.010, p = 0.922; see Figure 3). Analysis of performance-to-baseline ratios across frequency bands revealed no statistically significant differences (F (7, 203) = 0.523, p = 0.620).
Brain wave responses to Eucalyptus: OD vs controls
The main effect of olfactory dysfunction on brain activation to eucalyptus was not significant in this model (F (1,28) = 1.346, p = 0.256; see Figure 4). Analysis of performance-to-baseline ratios across frequency bands revealed statistically significant differences (F (7, 196) = 4.727, p = 0.007), since delta wave signal clearly predominated in both OD patients and controls (see Figure 4).
Brain wave responses to Clove: OD vs controls
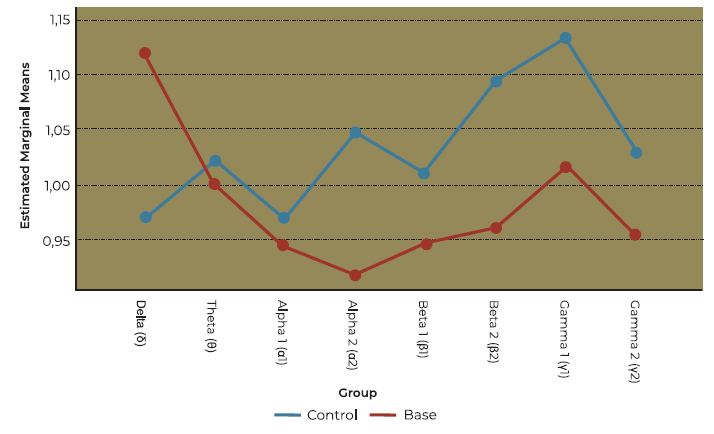
The main effect of olfactory dysfunction on brain activation to eucalyptus was not significant in this model (F (1,28) = 2.905, p = 0.099). Nevertheless, there was a tendency for significance (see Figure 5). Analysis of performance-to-baseline ratios across frequency bands revealed a statistical tendency towards significance (F (7, 196) = 2.777, p = 0.058) (see Figure 5).
Activation index: OD vs controls
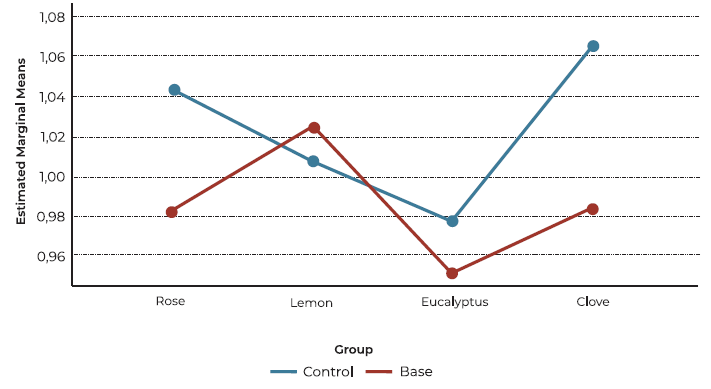
The overall main effect of olfactory dysfunction on activation index to eucalyptus was not significant in this model (F (1,27) = 2.465, p = 0.128). Nevertheless, there was a marked difference concerning clove as showed in the bivariate analysis (see Table 2 and Figure 6).
Discussion
This study successfully achieved its central aim: investigating the neurocognitive effects of OD on brain activity during odor exposure using EEG. While the primary focus compared responses between individuals with OD and healthy controls, the broader implications of these findings extend to the potential for personalized olfactory training (OT) regimens in the future. The one-minute odor inhalation period was deliberately chosen to mirror a typical olfactory training session. This approach aimed to simulate the repeated exposure to specific scents employed in established OT protocols, enhancing the generalizability of our findings to real-world OT applications.
The analysis of EEG data revealed intriguing insights into how participants processed odors. Notably, the rose inhalation task yielded a significant difference in Alpha 1 wave activation between the groups, with the control group exhibiting a stronger response (Table 2). This finding, potentially linked to a state of relaxed wakefulness during rose odor processing, suggests that OD may alter brain activity in this setting.
Similarly, patients with OD exhibited a lower Beta 1 signal during eucalyptus inhalation compared to the control group. Beta waves are associated with focused attention (7) (see Table 1), suggesting that individuals with OD may have reduced frontal cortex response when encountering the eucalyptus odor.
Clove exposure yielded the most striking results. OD patients showed lower activation in specific bands (Gamma 1, Beta 2, Alpha 2) compared to controls. This suggests potentially poorer neural processing for higher cognitive functions (attention, memory - related to Gamma and Beta activity) and possibly reduced relaxation (Alpha 2) in the OD group during clove inhalation. Additionally, higher Delta activity (deep sleep/inactive state) and a lower Activation Index (overall engagement) in the OD group further support this notion of diminished neural response to clove.
Analysis using ANOVA revealed high delta wave activity in both OD and control groups during eucalyptus inhalation (Figure 4). Delta waves are typically associated with states of deep relaxation or sleep 7. This finding aligns with research demonstrating the anxiolytic (anxiety-reducing) effects of 1,8-cineole, a key component of eucalyptus oil 13. ANOVA analyses of other odors (excluding lemon) revealed trends towards significance, suggesting potential odor-specific effects. However, statistical power may have been limited by sample size, so a larger population is warranted to confirm these trends and definitively identify meaningful changes in neural responses.
Interestingly, and unlike other odors in this study, lemon inhalation did not yield significant differences in brain activity patterns between OD and control groups. While initially surprising, this finding could be explained by the unique properties of lemon, as it possesses a powerful odor profile, with high concentration of volatile compounds 14. These compounds are well-established olfactory stimulants, and research suggests they can even trigger the release of the stress hormone epinephrine 15. This potent activation, bypassing potential olfactory deficits in the OD group, could explain the observed similarity in brain activity patterns between both groups.
The evocative power of scent, captured so vividly by Marcel Proust in his novel “À la recherche du temps perdu”, has long fascinated researchers 12,13. This phenomenon, now known as the Proust Phenomenon, reflects the unique ability of odors to trigger vivid and often emotional autobiographical memories 14. The interconnexion between olfaction and the limbic system (orbitofrontal cortex, insula, anterior cingulate cortex, amygdala and hippocampus) explains the inseparable relation between odors and memories/emotions 15-17. This "higher olfactory functions” play a broader role in shaping human behavior beyond just basic odor detection (2,3,18-20.
Considering OT, individual differences in both olfactory function and the emotional connections to specific scents could significantly impact how individuals respond to the training odors 15. These variations can ultimately influence the effectiveness of the training program 25. Therefore, personalizing OT by identifying the most effective scents for each individual holds immense promise for optimizing treatment outcomes. This study lays the groundwork for this crucial tailoring approach by demonstrating the potential for specific odor stimuli to elicit distinct neural responses. The process of chemosensory perception involves distinct neural networks: the olfactory network, responsible for odor detection and identification; the somatosensory network, mediating the perception of trigeminal sensations such as pungency or coolness; and the integrative network, responsible for combining and interpreting olfactory and trigeminal information to create a unified percept 26. Understanding the functional connectivity within and between these networks is crucial for comprehending how the brain processes and interprets chemosensory stimuli. Our study, while primarily focused on EEG correlates of odor perception, highlights the need for future research into the functional connectivity of these networks. Advanced neuroimaging techniques like functional magnetic resonance imaging (fMRI), combined with EEG, could elucidate how the olfactory, somatosensory, and integrative networks interact during odor exposure, potentially unveiling individual differences in odor perception and the potential for personalized OT interventions 27).
There are limitations to acknowledge. Primarily, the sample size was relatively small, potentially impacting the generalizability of the findings. Only OPT were measured in the psychophysical domain, so that identification and discrimination were not evaluated in this sample. This choice was made as OPT are considered a fundamental indicator of peripheral olfactory function, whereas identification and discrimination are believed to be influenced by more complex olfactory and cognitive processes 11,28,29. Additionally, employing multi-channel EEG systems would offer a more comprehensive picture of brain activity during odor exposure. Future studies incorporating multi-channel EEG could provide a more comprehensive understanding of the specific brain regions and networks involved in odor perception and potentially in response to olfactory training. The inclusion of diverse etiologies of olfactory dysfunction in this study may also have introduced variability in the results, potentially masking etiology-specific patterns of brain activation. We recognize that the design of this study limits our ability to draw definitive conclusions about the long-term effects of OT. Future studies with extended follow-up periods are therefore necessary. We also acknowledge the importance of considering the interplay between the olfactory, somatosensory, and integrative networks in olfactory processing. Incorporating functional connectivity analyses could shed light on how these networks interact to shape odor perception and how OT may modulate their connectivity.
Conclusion
This study investigated the impact of OD on brain activity during odor exposure using EEG, highlighting the multifaceted nature of olfaction. Findings revealed differences in central brain integration between individuals with OD and healthy controls. These observations, coupled with the known link between olfaction, memory, and emotion, suggest promising avenues for OT. Future research could explore individual variations in smell perception and corresponding brain responses, in view of personalizing OT protocols. Additionally, exploring the effects of different odor profiles and incorporating advanced neuroimaging could further optimize OT regimens and unravel OD neural mechanisms. Ultimately, this deeper understanding can lead to more effective interventions for OD patients.
Acknowledgments
We extend our sincere gratitude to all the clinical and non-clinical staff of the Otorhinolaryngology Department for endorsing this work.
Conflict of Interests
The authors declare that they have no conflict of interest regarding this article.
Data Confidentiality
The authors declare that they followed the protocols of their work in publishing patient data.
Human and animal protection
The authors declare that the procedures followed are in accordance with the regulations established by the directors of the Commission for Clinical Research and Ethics and in accordance with the Declaration of Helsinki of the World Medical Association.


