Introduction
Knowledge of the populations’ health is an essential step into making improvements that prompt healthy behaviours, identify and address adverse health events, and prevent and treat diseases [1]. Health surveys constitute one of several different information sources that allow this knowledge to be gathered. Health surveys represent important tools for public health planning and interventions, essential for the development and monitoring of national and regional health plans [2].
In the context of the health surveys, health examination surveys, where the information collected via a detailed questionnaire is complemented with objective information measured by physical examination and laboratory tests on biological samples, may provide more accurate and better-quality information [3]. However, the collection of objective information does not ensure data validity and reliability. The quality of a survey process, including its instruments and fieldwork adherence to study protocols, is crucial for accurate, reliable and valid results [4]. Considering that public health decisions are also based on health survey data, it is important to implement quality assurance procedures in order to prevent unacceptable practices and to minimize errors in data collection [4]. Survey errors can significantly influence estimates and invalidate study findings [5].
The total survey error approach [6] comprehensively conceptualizes the errors associated with the different survey production processes: the design, collection, processing and analysis of survey data [7]. Considering survey error as the deviation of a survey response from its underlying true value [7], total survey error identifies two major error components that influence data accuracy: representativeness and measurement errors [5].
Errors in surveys resulting from the misrepresentation of the target population, also denominated as “non-observation errors,” usually include coverage error (discrepancies in the survey statistics between the target population and the frame population), sampling error and unit non-response [6]. Measurement errors are generally also referred to as “observational errors” [8 ] and include errors deriving from the interviewer, the respondent, the data collection mode, the information system and the interview setting [9].
Close fieldwork monitoring and tracking of field progress can help identify key indicators of non-response and measurement error, which can be actively used to improve data collection and, consequently, data quality [10]. Standardization of survey procedures through the detailed fieldwork protocol, survey staff training and continuous monitoring of overall survey performance through tangible performance indicators (key performance indicators [KPI]), calculated from paradata collected during the implementation of the survey, constitute the main strategies for minimizing measurement errors in health surveys.
This article aims to describe the KPI for fieldwork monitoring used in the first Portuguese National Health Examination Survey (INSEF) to evaluate overall survey performance and detect deviations from the survey protocol. It also describes the corrective measures implemented during the fieldwork to achieve the established performance targets.
Subjects and methods
Survey settings
INSEF was a cross-sectional survey aimed at collecting objective and self-reported data on health status, health determinants and use of health care in a representative probabilistic sample (n = 4,911) of Portuguese residents aged between 25 and 74 years [2]. The INSEF sample was selected using two-stage probabilistic cluster sampling. In the first stage, 7 geographical areas (primary sampling units [PSU]) were randomly selected in each of the 7 Portuguese health regions, and, afterwards, individuals were selected in each of the selected PSU.
The fieldwork was performed between February and December 2015 by 24 teams, which included 117 professionals. Each team comprised 1 administrative staff, 2 nurses (1 appointed as a team coordinator) and 1 laboratory technician or nurse to perform the blood collection and processing [11, 12]. All fieldwork staff underwent a training program of 21-28 h including role-play of all data collection procedures, and received four operating manuals, with step-by-step descriptions of standard operational procedures for each survey component. In each of the 49 PSU, data collection took place in primary care health centres for approximately 2 consecutive weeks.
The survey included four components: recruitment (R), physical examination (PE), venous blood collection (BC) and a structured health questionnaire (HQ) [2].
Recruitment
About 2 weeks prior to data collection, an invitation was sent by regular mail to the selected individuals with a signed letter from their general practitioner and the INSEF coordinator. For each PSU, in the week prior to data collection, the administrative staff contacted the selected individuals by telephone to schedule the interview and health examination.
Records of the recruitment attempts (up to 6) were kept for each of the selected individuals, including the date, time, outcome of each recruitment attempt, verification of eligibility criteria and reasons for refusal for non-participants. A participation rate of 40% was established as a target [12].
Physical examination
PE comprised measurement of blood pressure (BP), height, weight, and waist and hip circumference. Measurements were performed according the European Health Examination Survey (EHES) guidelines [13].
The BP measurements were taken in the sitting position on the right arm. Three sequential readings were taken for each participant in an unhurried way [13], including 5 min of rest before the first measurement and a 1-min interval between measurements. Measurements taken over a period of less than 8 min (possibly without including rest) were considered non-compliant with the survey procedure.
For anthropometric measurements, the participants were asked to take off heavy clothes and empty their pockets. Weight was measured in kilograms to the nearest 0.1 kg, while weight and waist and hip circumference were measured to the nearest millimetre. Rounding of measured values was considered as a deviation from the measurement protocol.
Blood collection
Venous blood samples were collected for determination of the lipid profile from all participants except those with anaemia or other chronic illnesses, which restricts taking blood samples. Up to 2 attempts of blood withdrawal were made. The serum samples were centrifuged 30-60 min after collection and transported daily to the participating laboratories to be fully processed.
Health questionnaire
The HQ included 23 thematic sections, covering sociodemographic information, disease and chronic conditions, functional limitations, mental health, health determinants and healthcare use. It was applied by trained nurses by Computer-Assisted Personal Interviewing (CAPI) using the REDCap web application [14], while paper-based forms designed for optical recognition were used for the remaining three components (R, PE and BC) (see the INSEF fieldwork flowchart in online suppl. Fig. 1A; for all online suppl. material, see https://www.karger.com/doi/10.1159/000511576).
Fieldwork monitoring strategies
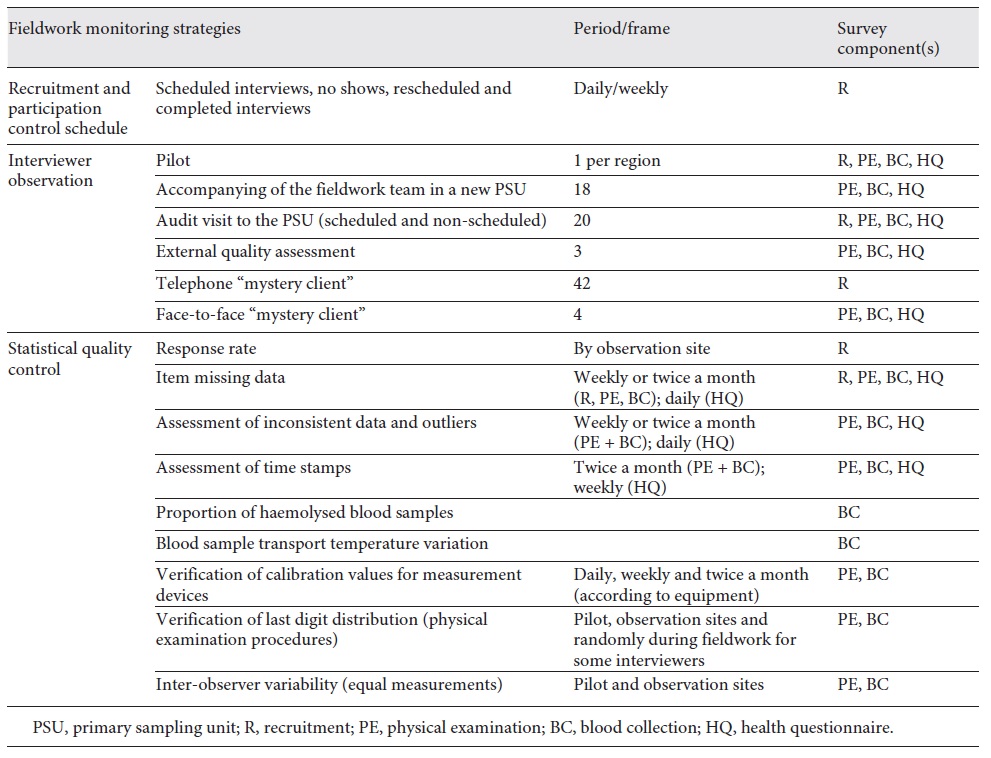
INSEF fieldwork monitoring strategies were organized in groups according to selected classes of the two types of survey error (Table 1). The strategies employed within the recruitment component aimed specifically at reducing non-response error, by focusing on gaining respondent cooperation and on a correct assessment of eligibility criteria. A separate set of monitoring strategies (interviewer observation and statistical quality control) focused on reduction of measurement error for R, PE, BC and HQ.
Interviewer observation
INSEF planning led to the implementation of different types of interviewer observations throughout the course of the fieldwork for all survey components. A standardized observation grid was used for fieldwork personnel evaluation, and results were shared with the fieldwork team in an end-of-day interactive meeting between the supervisor and the team members and through a small written report.
The first observation took place during the 1-day pilot study conducted prior to the start of actual fieldwork, which included between 3 and 8 participants out of 20 selected individuals per region. Whenever possible, the supervisors would also accompany the fieldwork team during their first day in a new PSU. This activity took place, particularly, if a new team began collecting data for the first time or if we anticipated that a specific PSU could be particularly challenging due to logistical constraints or less engaged populations. The supervisors made several scheduled and non-scheduled audit visits to monitor data collection for 2 or more participants. The face-to-face observations were made with the survey participants’ consent.
Finally, the “mystery client” observation procedure was used. In this procedure, one of the supervisors (unknown to the specific team and familiar with all survey procedures) pretended to be a survey participant in order to perform fieldwork personnel evaluation without revealing his/her true identity. A telephone mystery client was used for the recruitment stage, while a face-to-face mystery client was used for other survey components when the monitoring activities indicated a possible non-compliance with data collection procedures.
Statistical quality control and KPI
Statistical quality control was used to understand if a variation in any component of the survey process was natural and expected or a problematic process variation that needed to be addressed. It aimed to assure the proper application of interviewing and measuring protocols and hence to reduce measurement error.
KPI were chosen to be monitored daily, weekly or monthly to evaluate adherence to protocols based on EHES guidelines [13,15], World Health Organization MONICA Project recommendations [16] and previous practical experience gathered from participation in the EHES pilot in 2009-2010 [17]. The periodicity of assessment varied by survey component; while the HQ web application allowed real-time monitoring and validation, R, PE and BC were verified with a 2-week delay in paper forms.
The 6 KPI monitored during the fieldwork (Table 2) included participation rate, average time distribution for procedures, proportion of a last digit in a specific measure and missing values. To monitor BC and processing, we selected the proportion of haemolysed samples as the main quality indicator. Sample haemolysis, defined as the rupturing of red blood cells, is one of the most important causes of pre-analytical errors that may compromise laboratory test results. It can occur due to incorrect procedures related to BC, namely due to use of a tourniquet for more than 1 min, or improper handling or storage of the samples [18].
The results describe the KPI ordered along the timeline of the fieldwork period. Each of the 7 health regions conducted the fieldwork in 7 primary care health centres (PSU). The results of all regions were combined and presented by sets of 7 observations throughout the survey period to evaluate trends within the survey - each group is composed of 1 PSU from each of the 7 health regions, corresponding to the different health regions first, second, third, fourth, fifth, sixth and seventh PSU of each.
Results
Recruitment
The recruitment KPI throughout the data collection period are displayed in Figure 1 . After the pilot, we observed a 1.3- and 2.5-fold increase in contact and participation rates, respectively. The cooperation rate improved from 29.2% to 53.5% in the first group of PSU and remained above 64% afterwards. The average survey contact, cooperation and participation rates were 69.5%, 63.1% and 43.9%, respectively.
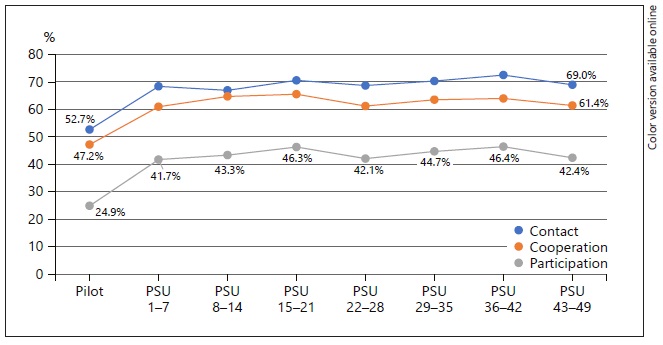
Fig.1. Contact, cooperation and participation rates throughout the data collection period. PSU, primary sampling unit.
In the first days of fieldwork, the daily contact with the survey staff responsible for recruitment highlighted that, of all scheduled appointments, about 84% resulted in participation - some individuals who agreed to participate simply forgot the appointment (no show) - and that taking time off from work to participate in the survey was one of the main reasons for refusal. The “mystery client” procedure allowed us to detect some deviations from the recruitment protocol in eligible criterion verification and survey presentation.
Physical examination
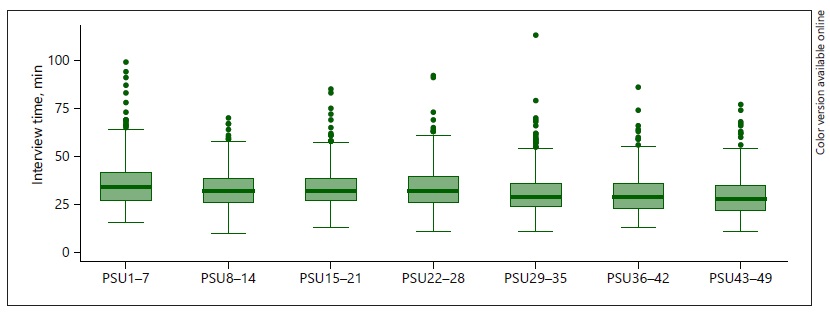
The distribution of time needed for three subsequent BP measurements is presented in Figure 2. The average time for BP measurement was 10 min. The proportion of measurements that lasted less than 8 min went down from 14.3% in the second PSU group to 3.3% in the seventh PSU group, indicating a 4.4-fold decrease in non-adherence to the standardized survey procedure.
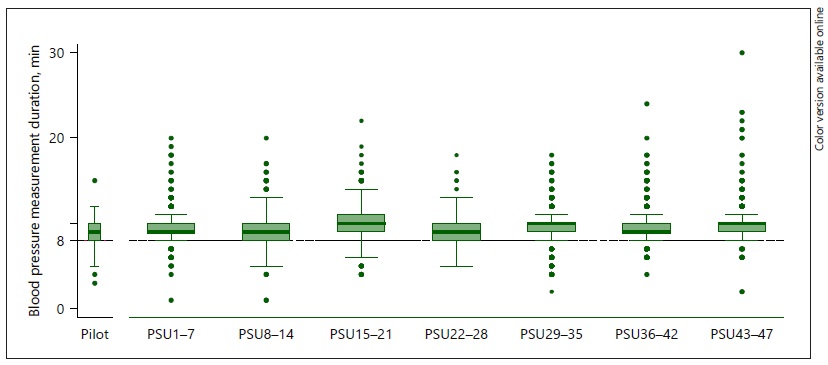
Fig.2. Distribution of blood pressure measurement duration (min) over fieldwork. PSU, primary sampling unit.
For the measurements of height and waist and hip circumference, the protocol stated that the interviewer should not round up or down the value of the measurement. Figure 3presents the distribution of last digits for height, which was expected to be relatively uniform. In the pilot, there was a clear preference for the digit 0 (29.2%) and the digit 5 (24.4%), indicating that the interviewers were rounding up or down their values. The proportion of measurements with the terminal digit of 0 or 5 decreased to 19.6% and 16.5%, respectively, after the pilot, and remained below 20% afterwards, although with some variation between PSU groups.
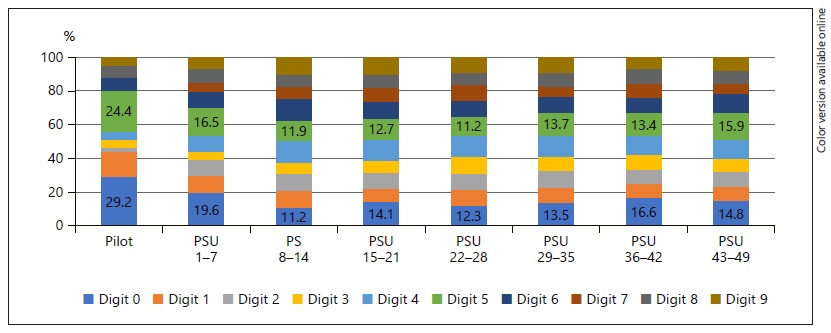
Fig.3. Last digit distribution for height measurement throughout the fieldwork. PSU, primary sampling unit.
Interviewer observation identified some deviations from the measurement protocol, such as incorrect participant posture during BP and anthropometric measurements.
Blood collection
Blood samples were successfully collected from 98.8% of the participants. The proportion of haemolysed samples was below 2.5% in all PSU, ranging from 0.4% to 2.2% by PSU group (Table 3). Direct observation of BC identified some deviations from the protocol, including prolonged use of the tourniquet and centrifugation of blood tubes not within the recommended time, between 30 and 60 min.
Health questionnaire
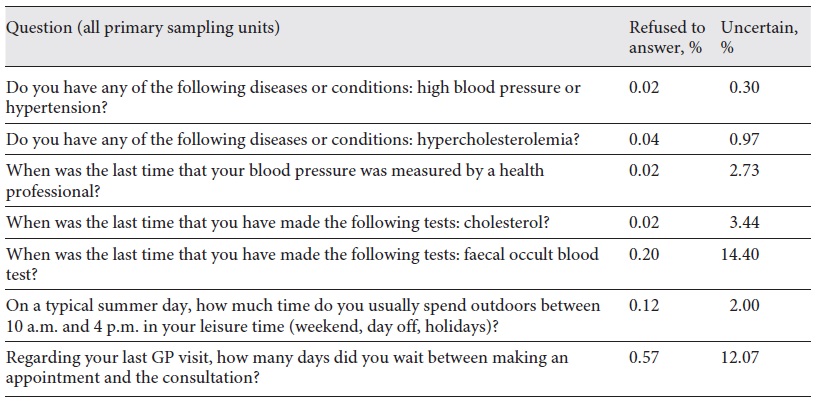
The HQ was administered by CAPI after PE and BC. The median interview time decreased over the fieldwork, from 34 to 28 min (Fig. 4). Considering as “missing” responses both “refused to answer” and “too uncertain to answer,” the missing values varied from 0% to 14.6% (Table 4). For the core survey questions, the proportion of missing values was below 5%. The questions regarding waiting time or duration presented higher proportions of missing values, up to 14.6%.
The observation of HQ administration also identified critical areas where interviewers made errors, for instance, by not presenting a response card or not reading the response options when required, or by adopting an inappropriate interviewing style.
Interventions to improve data quality
The supervisors developed several actions when deviations from expected values for a specific KPI were observed or when fieldwork personnel observation identified non-adherence to the protocol. To guarantee the required number of participants within the established fieldwork plan, staff was instructed to “overbook” participants based on detected no-show rates, reducing the interval between appointments from 45 to 30 min. Additionally, to reduce no shows, a reminder call to the scheduled participant on the day before the appointment was added to the recruitment procedure. The data collection schedule was adjusted to include non-working hours in order to increase participation. Deviations from the protocol detected by the “mystery clients” were corrected through additional training sessions; 33 participants who failed to fulfil the eligibility criteria were excluded from the survey database in the data cleaning stage. Information on the number of participants at regional and national levels was compiled weekly into a newsletter called “INSEF barometer,” which was shared with all the personnel involved in data collection and their supervisors.
When PE, BC or HQ indicators suggested systematic errors, an email was sent to all fieldwork personnel, highlighting the need to correctly address non-adherence to the protocol (e.g. rounding up/down weight values of tenths to 0 or 5), as well as to the supervisors, contacting the fieldwork personnel by telephone or scheduling a site visit to provide additional training in person.
Data-related issues such as missing data and inconsistent item responses in the HQ data were also fed back almost immediately (on the same or the next day) to the interviewer, who could, if necessary, contact participants to clarify the registered answer. To improve interviewers’ performance in the HQ component, written reminders and validation rules were added to some questions in the REDCap web application.
In addition, the results of statistical quality control were presented to all regional teams, and, if necessary, incorrect or inconsistent data were noted and the correct procedure was discussed.
Discussion and conclusion
INSEF was implemented with a high concern about data quality during all its phases, combining quantitative and qualitative approaches. In addition to interviewer training and piloting of all survey procedures, we adopted a set of KPI for the data collected during R, PE, BC and HC. Recruitment monitoring highlighted the need to implement alternatives to meet the minimum necessary number of participants. Timely adjustments to the recruitment protocol (“overbooking,” reminder calls and data collection schedule adjustments) resulted in considerable improvements after the pilot, although participation rates varied between the PSU groups. The changes in participation rate were not merely the result of varying experience among the personnel making the phone calls, but also that some PSU presented greater challenges. Overall, the achieved participation rate of 43.9% was lower than those reported for surveys based solely on interviewing (76-80%) [19], but higher than the rate previously obtained in the Portuguese EHES pilot in 2010 (36.8%) [17] and above the established target of 40% [12]. Compared to other health examination surveys in Europe, the INSEF participation rate was similar to that in a German survey (41-44%) and higher than that in a Scottish survey (36-41%), but lower than those in Finnish (56-61%) and Italian (54%) surveys [20].
INSEF was able to collect complete and valid information on the PE, BC and HQ components. The small losses in BC observed (1.2%) were below the 5% threshold defined by the MONICA project for the “completeness” data quality dimension [16]. The low proportion (<5%) of missing item response values for the core HQ areas may be a reflection of the validation routines at the time of data entry, which were included in the REDCap web application.
Standardization of the measurement procedures and quality assurance of the PE data were the most challenging. Regarding BP measurement, for more than 90% of the individuals observed, the suggested protocol was followed, with the total measurement time being longer than 8 min. Some deviance in the distribution of the last digit of the height measurement was observed in the pilot and the first PSU group, but afterwards the distribution became more uniform. However, the observed variation in terminal digit distribution suggests that even though the indicator stabilized over time, it was not completely corrected, and some interviewers kept rounding up and down values. Several retraining sessions were required to improve standardization of the height measurement procedure.
As expected, we observed considerable improvements for all KPI after the pilot study. Piloting was useful to verify the feasibility of the data collection procedures, adherence to the protocol and possible deviations, as well as to identify survey procedures that require closer monitoring throughout the fieldwork. For some KPI, the trend over the fieldwork period was not linear but rather represented some trendless fluctuation. These results illustrate a need for continuous monitoring of survey procedures and collection of paradata during the fieldwork.
In all interviewer-mediated surveys, interviewers play a crucial role during the entire data collection process [8,9,21]. Proper interviewer training and interviewer observation have been recognized in the literature as a key to successful survey implementation [9,16]. INSEF quality control programs have benefited from the communication and relationship established between supervisors and fieldwork staff, as well as from the daily or weekly contact between supervisors and fieldwork staff. From training onwards, the supervisors have conveyed the importance of the standardized procedures and monitoring activities, including collection of paradata. A survey organization culture that emphasizes the importance of data quality and can make fieldwork staff understand that they are an integral part of achieving high-quality data is likely to lead to improved quality [5]. On the other hand, close monitoring and the availability of supervisors to provide assistance encouraged the fieldwork staff to talk about any situations they encountered in the field that were not covered in the training, or any remaining doubts or questions. Overall, by checking the fieldwork staff’s work regularly and providing positive feedback, the supervisors could ensure that the quality of data collection remained high throughout the survey.
Among the limitations of our quality assurance approach it should be mentioned that in INSEF several corrective actions were taken simultaneously to improve data quality and measurement protocol adherence, which makes it difficult to identify the individual impact of any specific corrective action on either sample representativeness or adherence to the interview protocols.
The use of paradata and monitoring of the survey process offer the opportunity to make real-time decisions informed by observations of the ongoing data collection process. Because the production of survey data involves many actors, the importance of high data quality must be made a priority for all those involved, and the interviewers’ role in this process should be seen as that of collaborators.
Acknowledgements
The authors are grateful to all the professionals who were involved in the implementation of INSEF and to all INSEF participants.
Statement of ethics
Ethical approval by the National Health Institute Ethics Committee and National Data Protection Commission was obtained.
Funding sources
INSEF was developed as part of the predefined project of the Public Health Initiatives Program, “Improvement of Epidemiological Health Information to Support Public Health Decision and Management in Portugal. Towards Reduced Inequalities, Improved Health, and Bilateral Cooperation,” that benefited from a EUR 1,500,000 grant from Iceland, Liechtenstein and Norway through the EEA Grants and the Portuguese government.
Author contributions
I. Kislaya and A.J. Santos contributed substantially to the conception and design of the study; the acquisition, analysis and interpretation of the data; and drafting of the first version of the manuscript. H. Tolonen and B. Nunes contributed substantially to the conception and design of the study and to data interpretation and provided a critical revision of the article. H. Lyshol,
L. Antunes, M. Barreto, V. Gaio, A.P. Gil, S. Namorado and C.M. Dias contributed substantially to the acquisition of data and provided a critical revision of the article. All authors provided their final approval of the version to publish and agreed to be accountable for all aspects of the work in ensuring that questions related to the accuracy or integrity of any part of the work are appropriately investigated and resolved.


