


 Inglês (pdf)
 Artigo em XML
 Referências do artigo
 Enviar este artigo por email
 Citado por SciELO
  Similares em
SciELO
Similares em
SciELO 
 Permalink
Introduction
As a result of climate change, there have been large increases in the number and duration of heat waves (HWs) 1. Substantial temperature increases and the positioning of air masses causing HWs in a region for a long time result in economic, environmental, and human health problems 2. Recent studies have focused on the negative effects of HWs on deaths and hospital admissions 3-5. For example, it was found that 70,000 people died because of HW that occurred in Europe in 2003 6. In another study, approximately 15,000 people died due to HW in France 7. A study examining the effects of an HW on human health in California during 2006 showed that approximately 16,166 additional emergency room admissions and 1,600 additional hospitalizations were identified 8. As a result of an HW that occurred in Sydney, Australia in 2011, a 2% increase in emergency service admissions, a 14% increase in ambulance calls, and a 13% increase in death rates were detected 9. A study was conducted to examine the effects of an HW that occurred in the US city of Houston in 2011 on death rates and emergency service admissions. From the results, a 3.6% increase in emergency department admissions and a 0.6% increase in mortality rates were found during the HW 10.
In Turkey, studies based on health diseases mainly investigated the role of air quality and background atmospheric mechanisms on human health diseases 11,12. However, there have been few studies indicating the effects of HWs on health diseases in Turkey. For example, the death rate increased by 181% in an HW that occurred in İzmir in 2016, resulting in 29 extra deaths 13. In addition, there was a 19% increase in hospital admissions during HW. When age-specific death rates were examined, a 208% increase in the deaths was of the elderly during the HW periods. The main reasons for deaths were identified as hypertension (37%), dementia (10%), and heart disease (9%). In another study, 419 extra deaths were reported in HWs that occurred between 2013 and 2017 in Istanbul 14. When the effects of HWs were examined by sex, it was found that female groups were more affected by HWs. Investigating the age-specific effects of HWs determined that people aged 75 and over were more affected. After examining the causes of death in HW periods, it was found that those with heart disease were more affected by HWs. Although these studies were carried out in Istanbul and Izmir, which are the most crowded cities in Turkey, there have not been detailed studies for the other regions of Turkey. Southern areas of Turkey are known as the hot spot regions that are most affected by HWs 2. In addition to the population density, millions of tourists come to this region during the summer months of every year. Despite the overpopulation of this region in summer and latitudinal proximity to the desert areas and the frequent occurrence of HWs, the health effects associated with HWs have never been investigated. From this large territory, Fethiye is a city with a resident population of approximately 167,000 and an average of 1 million tourists visit in summer 15. From this perspective, the impacts of HWs on health risks need to be investigated in detail for Fethiye. For this purpose, the aim of this study is to reveal the effects of HWs on hospital admissions and in-hospital mortality in the Fethiye Province of Turkey. Determining the relationship between high temperatures, deaths, and hospital admissions will shed light on future studies to minimize the potential health risks.
Data and Methods
Study Area and Hospital Data
In this study, the Fethiye Province of Mugla, located in southwestern Turkey, was chosen as the study area. Fethiye is located at 36° 39' 5'' °N and 29° 7' 23'' °E coordinates. It has a surface area of 3,055 km2 and a population of 167,114. Fethiye has a Mediterranean climate with hot and dry summers and mild and rainy winters. Therefore, the hottest summer month is August with an average temperature of 32°C, and the coldest month is January with an average temperature of 10°C. Its annual average temperature is 21°C 16.
Hospital data were obtained from the Fethiye State Hospital between 1 May and 30 September in the 5 years between 2014 and 2019. Hospital data included daily hospital admissions and death records and were provided with permission from the Mugla Provincial Health Directorate. Using these data, increases in hospital admissions and deaths during HWs were examined. Hospital mortality data included age and sex parameters. The effects of HWs on age were examined by separating two groups: adult (15-64 years) and elderly (≥65 years). Additionally, the effects of HWs on sex were also investigated.
Meteorological Data and HW Definition
For analysis, 60 years of daily maximum temperature (Tmax) data of Fethiye Province were provided by the Turkish State Meteorological Service (TSMS) from 1960 to 2019. Daily Tmax values were used to determine the HWs that occurred in 2019. When the definitions of HWs were examined, it was evident that there is no single definition. Therefore, many definitions are used in the examined studies 17. In these definitions, daily maximum 18, minimum 19, average temperatures 20; relative temperatures such as 90% and 95% 21; constant threshold values such as 28°C and 35°C 22; and durations of consecutive temperatures such as 2 days, 3 days, or 4 days 23 were used. In our study, 90th percentile of Tmax and at least three consecutive days (≥3) were defined based on the long-term station-based daily Tmax for the period 1960-2019. With this definition, 3 HWs with lengths of 6, 7, and 5 days were identified in 2019. In previous studies, lag days after HW were considered 14,24. A study conducted in Brisbane, Australia found that the greatest effect of heat occurred on the first day of exposure, then decreased rapidly, and returned to baseline levels within 5 days 25. According to this study, the HW effect ended on the third day. In our study, 3-lag days were added to each HW, like the study published by Huang et al. 2012. Thus, because of the added 3 lag days, the length of HW 1 was 9 days, the length of HW 2 was 10 days, and the length of HW 3 was 8 days.
Statistical Analysis
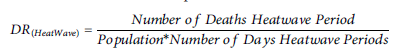
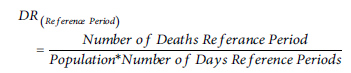
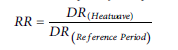
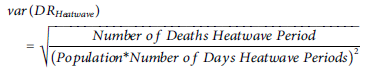
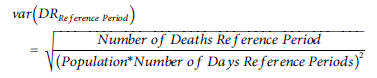
SPSS V21.0 (SPSS Inc., Chicago, IL, USA) was used for analysis. Increases in hospital admissions, death rates, and sex- and age-specific mortality rates during 3-lag day HW periods were calculated using Equations 1 and 2 below. Risk ratios (RRs) and 95% confidence intervals were calculated using Equation 3 below (p < 0.05).
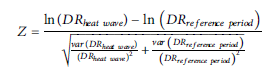
Natural logarithmic Z tests were used to compare the 3-lag day HW period, mortality with the reference period, and mortality rates 14. Z tests were conducted with Equation 6 below and p value were conducted with Equation 7 below.
 ***
***
 ***
***
 ***
***
 ***
***
 ***
***
 ***
***
 ***
***
Here, DRheatwave shows the mortality rate in the HW periods during summer months in 2019, and DRreferenceperiod shows the mortality rates in the reference periods (2014-2018). In the analyses, the hospital data recorded in the 3 HW periods between 1 May and September 30, 2019 were compared with the hospital data recorded in the reference periods. For the analysis, 1 May to 30 September between 2014 and 2018 were chosen as the reference period. The start and end dates of the reference days used for comparison are the same as the start and end dates of the HWs in days and months. Thus, the number of days of the reference period was equal to the number of days of the HW periods.
Results
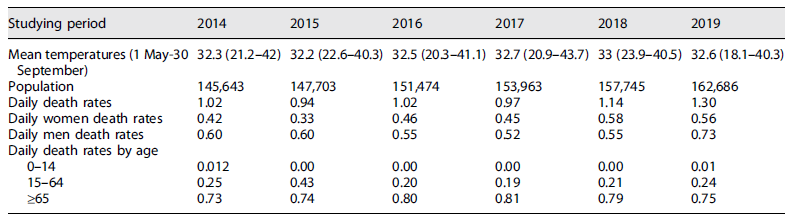
The average temperatures, population, and daily death rates by sex and age between 2014 and 2019 are shown in Table 1. Between 2014 and 2019, the daily death rate ranged from 0.94 to 1.3. With a daily death rate of 1.3, 2019 had the highest number of deaths compared to the reference years. The daily average temperatures were the highest at 33°C in 2018, daily Tmax was 43.7°C in 2017, and the lowest daily minimum temperature was 18.1°C in 2019. When the daily death rates were examined by age, it was determined that the death rates were higher in elderly people than the adults. Since the death rates in children (0-14) were very low, they were not considered in the analysis. Considering the death rates by sex, the male death rate was higher than the female death rate, except in 2018. While the male death rate was the highest in 2019 compared to the other years, the female mortality rate was found to be the highest during the extended summer of 2018.
HWs and Hospital Admissions
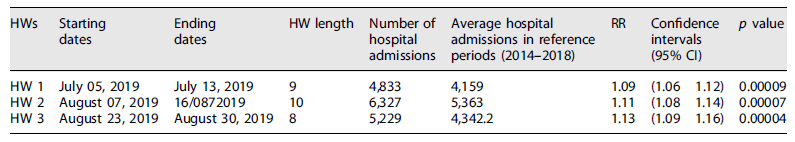
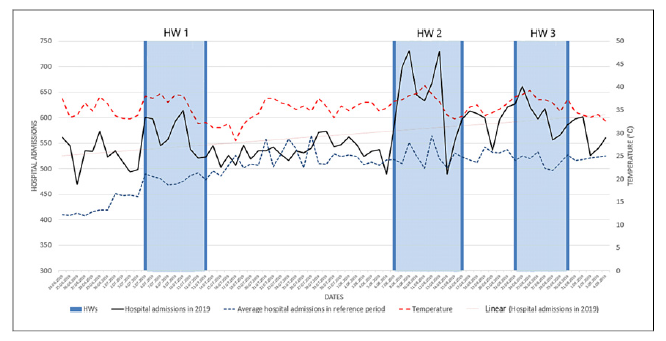
Increases in hospital admissions during HW periods were examined. The RR and confidence intervals showing the relationship between HWs and hospital admissions are shown in Table 2. Accordingly, the RRs showing the relationship between hospital admissions and HW 1, HW 2, and HW 3 were 1.09 (95% CI: 1.06-1.12, p < 0.05), 1.11 (95% CI: 1.08-1.14, p < 0.05), and 1.13 (95% CI: 1.09-1.16, p < 0.05), respectively. Figure 1 shows the relationship between HWs and hospital admissions in 2019.
HWs and Deaths
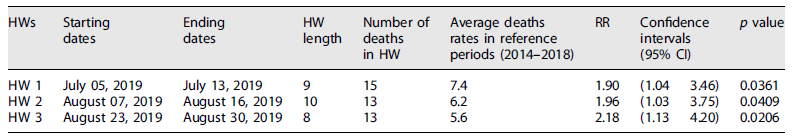
Table 3 shows the temperature-death relationship during the HW periods that occurred in 2019. In 2019, the RRs showing the effect of HW 1, HW 2, and HW 3 on death were 1.90 (95% CI: 1.04-3.46, p < 0.05), 1.96 (95% CI: 1.03-3.75, p < 0.05), and 2.18 (95% CI: 1.13-4.20, p < 0.05), respectively.
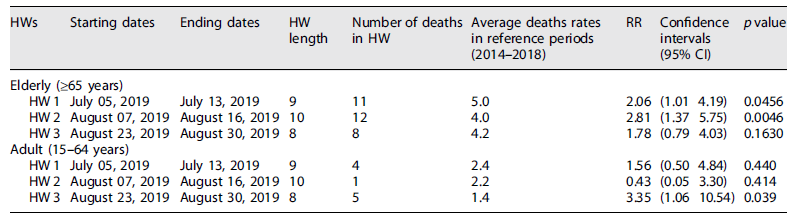
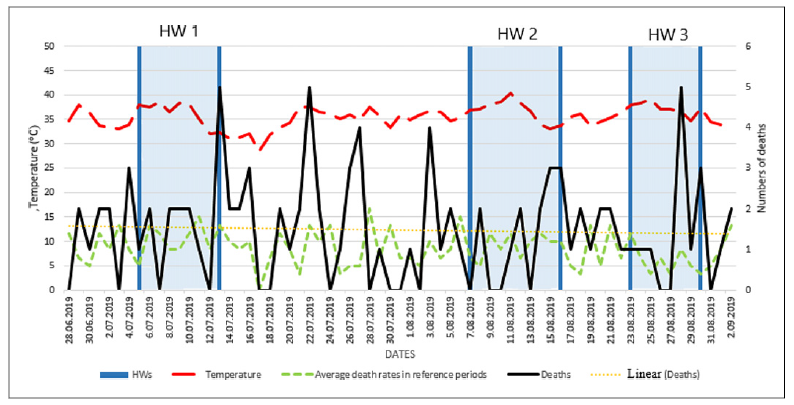
To determine the effects of HWs by age, deaths occurring between May 1 and September 30, 2019 were classified according to age. As shown in Table 4, the death rate of elderly people was higher than that of people aged 15-64 during the HW period. The RRs showing the effect of HW 1, HW 2, and HW 3 on mortality at the age of 65 and over were 2.06 (95% CI: 1.01-4.19, p < 0.05), 2.81 (95% CI: 1.37-5.75, p < 0.05), and 1.78 (95% CI: 0.79-4.03, p > 0.05), respectively. The RRs showing the effect of HW 1, HW 2, and HW 3 on mortality in the 15-64 age group were 1.56 (95% CI: 0.50-4.19, p > 0.05), 0.43 (95% CI: 0.05-3.30, p > 0.05), and 3.35 (95% CI: 1.06-10.54, p < 0.05), respectively. High temperatures continued for a total of 27 days in 3 HWs that occurred in 2019. A total of 22 extra deaths occurred during these days. Extra deaths were calculated by taking the difference between the mean death rates of the reference periods and the deaths occurring during the HW periods. Figure 2 shows the increase in deaths during the HWs that occurred in 2019. Of the extra deaths that were estimated in 2019, 18 were aged 65 and over, and 4 were aged 15-64. According to these results, 82% of the extra deaths that were estimated during HW periods occurred in those 65 and over.
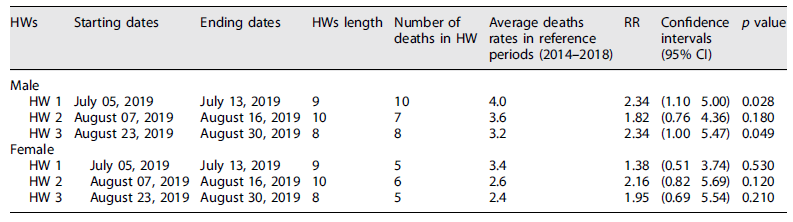
The study conducted to examine the effects of HWs on sex is shown in Table 5. The RRs showing the effect of HW 1, HW 2, and HW 3 on male mortality were 2.34 (95% CI: 1.10-5.00, p < 0.05), 1.82 (95% CI: 0.76-4.36, p > 0.05), and 2.34 (95% CI: 1.00-5.47, p < 0.05), respectively. The RRs showing the effect of HW 1, HW 2, and HW 3 on female mortality were 1.38 (95% CI: 0.51-3.74, p > 0.05), 2.16 (95% CI: 0.82-5.69, p > 0.05), and 1.95 (95% CI: 0.69-5.54, p > 0.05), respectively. It was determined that 14 of the extra deaths that were estimated in 2019 were males (64%) and 8 were females (36%).
Discussion
In this study, a total of 3 HWs were detected between May 1 and September 30, 2019. Increases in hospital admissions during HWs were assessed. There was a 9% increase in hospital admissions in HW 1, 11% in HW 2, and 13% in HW 3. A total of 2,524 extra admissions were reported during these three HW periods. These results are consistent with previous studies. In a study conducted in Izmir, Turkey, a 19% increase in emergency service admission was reported during HW periods 13. In a study conducted in Brisbane, Australia, a 14% increase in emergency service admissions was reported during HW periods 17. In a study conducted in Sydney, Australia, a 2% increase in emergency service admissions was reported during HW periods 9.
As shown in Table 3, RRs of 1.90, 1.96, and 2.18 were observed, demonstrating increases in deaths during HWs that occurred in 2019. A total of 22 extra deaths were estimated in the 3 HWs in 2019. These results are consistent with previous studies. In a study investigating deaths due to HWs in 9 French cities, RRs were found to be 2.37 in Bordeaux, 3.22 in Lyon, 5.0 in Paris, and 2.0 in Strasbourg 3. A study examining deaths due to HWs in 15 European cities investigated how a 1°C increase in daily Tmax affected deaths 26. This study determined that a 1°C increase in the daily Tmax above the threshold value caused an average of a 3.12% increase in death rates in the Mediterranean region and 1.84% increase in the northern regions. A study conducted in Belgrade, the capital of Serbia, examined the effects of HWs on public health (Bogdanovic et al., 2013). This study found that 167 extra deaths were estimated due to HWs. A study conducted in France in 2006 found that 2,065 extra deaths occurred during HWs 7.
The effects of HWs on mortality were examined by sex. A total of 22 extra deaths occurred during HW periods. Eight of the deaths were females, and 14 were males. This shows that males were the more affected group than females during HWs. Previous studies found that women were more affected than men during HWs 14,27. However, it was found in some studies that men are the most affected group than women during HWs. For example, in a study conducted at Izmir Dokuz Eylul University, men were more affected than women in HWs 13. The results of this study seem to be consistent with the results of our study.
The ages at which HWs most affect people were also examined in previous studies. Twelve percent of the Fethiye population was over 65 years old in 2019 15. Previous studies have shown that HWs affect older people more. To determine HW and age-specific deaths, mortality data were divided into two groups: adult (15-64 years) and elderly (≥65). When the deaths occurring in HW periods were examined, it was found that elderly people were more affected than those in other age groups. For the 3 HWs that occurred in 2019, there were 22 extra deaths. Of these extra deaths, 18 were elderly, and the remaining 4 were in the ages between 15 and 64. The results of our study are in good agreement with the previous studies. For example, a study conducted in the Netherlands in 2001 determined that HWs mostly negatively affect elderly people, and deaths are mostly seen in people of this age group 23. A study conducted in California showed that elderly people were found to be most affected group by HWs 8.
Conclusion
In this study, the effects of HWs on hospital admissions and in-hospital mortality were investigated in the Fethiye Province. A total of 3 HWs were detected in 2019, and it was found that there were 9%, 11%, and 13% increases in hospital admissions. In addition, the effects of the 3 HWs on mortality were examined. Deaths during HWs increased by 90%, 96%, and 118%, respectively, resulting in 22 extra deaths. It was found that 82% of the deaths occurred in those aged 65 and over, and 18% of them were between the ages of 15 and 64. In addition, 64% of deaths were males and 36% females. Since very few studies have examined the effects of HWs on human health in Turkey and there is no HW emergency action plan in Turkey, precautions should be taken against HWs that may occur in the future. More research needs to be done in this area to determine the effects of HWs on human health, the environment, the economy, and migrations.
Acknowledgment
We would like to thank Marmara University Scientific Research Projects Unit for the “FDK-2021-10257” project support.
Statement of Ethics
Ethics Committee of Marmara University Institute of Science and Technology decided that ethical approval was not required for this study (44174047-302.08.01-E.2000025213).
Funding Sources
The project support fund “FDK-2021-10,257” was used to finance the study. This fund was used for the transportation, accommodation, and meal expenses of the people who carried out the study between Istanbul and Muğla.
Author Contributions
Yunus OZTURK: Substantial contributions to the conception or design of the work; or the acquisition, analysis, or interpretation of data for the work. Hakki BALTACİ: Drafting the work or revising it critically for important intellectual content and final approval of the version to be published. Bulent Oktay AKKOYUNLU: Agreement to be accountable for all aspects of the work in ensuring that questions related to the accuracy or integrity of any part of the work are appropriately investigated and resolved.
Data Availability Statement
Hospital data: Hospital data were obtained from the Fethiye State Hospital between 1 May and 30 September in the 5 years between 2014 and 2019. Hospital data included daily hospital admissions and death records and were provided with the permission of the Mugla Provincial.
Health Directorate: Meteorological Data: For analysis, 60 years of daily Tmax data of Fethiye Province were provided by Turkish State Meteorological Service (TSMS) for the period 1960-2019.

