




 Inglês (pdf)
 Artigo em XML
 Referências do artigo
 Tradução automática
 Enviar este artigo por email
 Citado por SciELO
  Similares em
SciELO
Similares em
SciELO 
 Permalink

Introduction
This study investigates whether recent empirical findings support the theory of political business cycles in Latin America and examines whether income inequality varies according to the ruling party’s ideology. The political business cycle theory, particularly its partisan dimension, suggests that left wing and right wing parties adopt distinct policy approaches. Left-wing governments generally prioritize redistributive policies to reduce income inequality, while right-wing governments emphasize economic stability, often through inflation control (Hibbs, 1977; Alesina, 1987; Huber and Stephens, 2012).
The research tests this theory using a panel dataset of 13 Latin American countries from 1994 to 2013, encompassing 260 observations. Employing robust causal inference techniques and statistical models, the study explores the relationship between political cycles and income inequality, contributing empirical evidence to the Political Science literature and assessing the relevance of classic theories in the Latin American context.
The paper is structured into five sections: a review of traditional political business cycle models with a focus on income inequality, hypotheses and variable definitions, empirical strategy and statistical modeling, presentation of results, and a conclusion summarizing the key findings.
Party Political Cycles and the Place of Income Inequality
The allocation of public resources is key in political science, influencing institutions and serving as political power (Dahl, 1996; Lijphart, 2012). Research examines how preferences shape distribution, linking it to economic policy cycles (Downs, 1999; Nordhaus, 1975; Alesina, 1987). Hibbs (1977) introduced ideology, leading to ‘partisan models’ exploring its effect on policies, though debates persist on its impact on macroeconomic and social variables.
Income inequality undermines political equality, weakening democracy (Lijphart, 2012; O’Donnell, 1999; Huntington, 1993). Often viewed through an economic lens, its role in politics is underexplored. Kerstenetzky (2002) refuted ‘trickle-down’ growth, showing structural inequalities perpetuate poverty, erode social cohesion, and harm democracy. Redistributive policies are vital to address these issues.
This study adopts the CPO perspective, asserting that party ideology shapes resource allocation. Left-wing parties emphasize redistribution, while right-wing parties prioritize inflation control. Fiscal policy is central to implementing these ideologies. Figure 1 outlines a framework linking party cycles to income inequality, guiding the analysis.
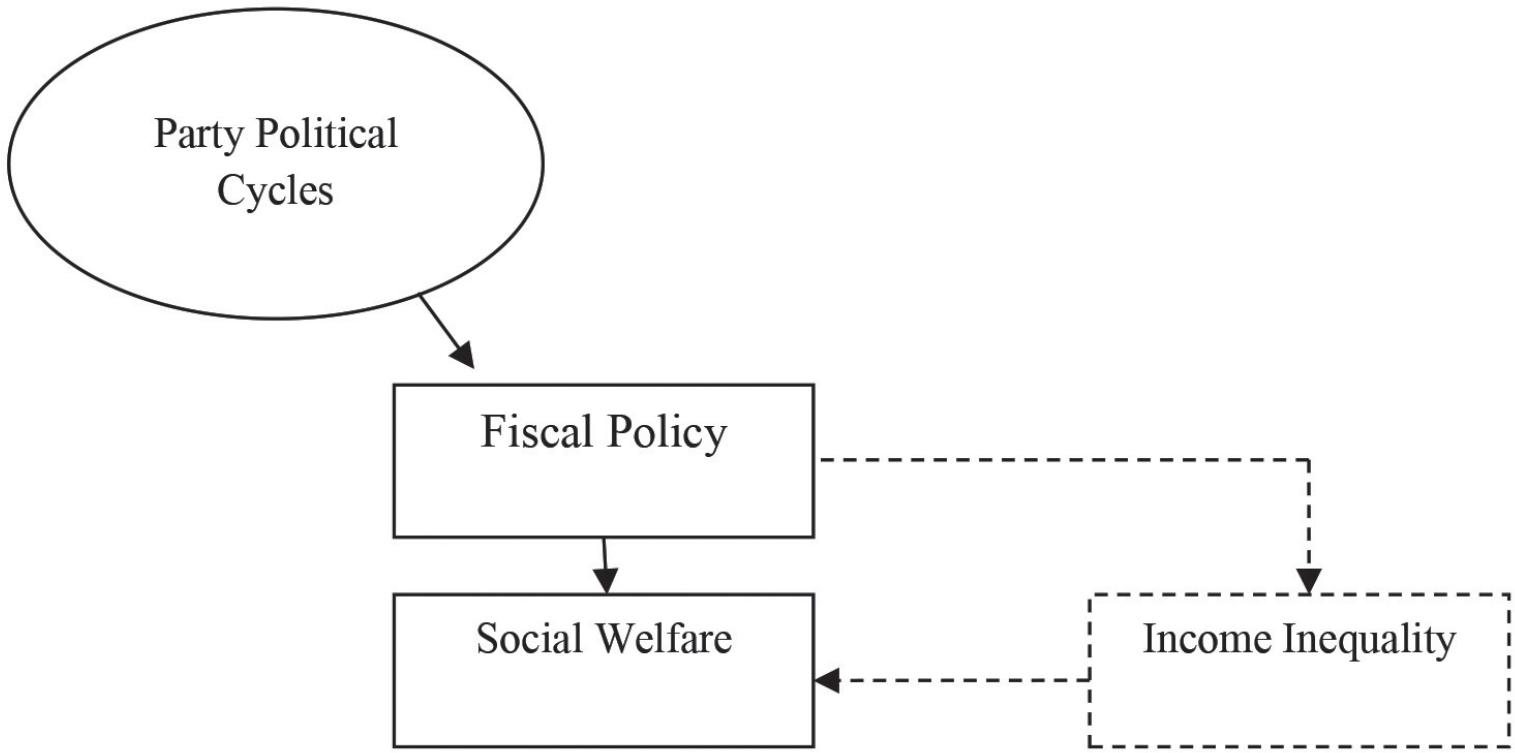
Research increasingly views income inequality as politically driven, shaped by electoral power dynamics. Studies highlight government policies, particularly through party political cycles, as key influences on inequality.
Bradley et al. (2003) found left-wing parties in post-industrial democracies reduced inequality via progressive taxes, transfers, and union support. Morley (2001) attributed Latin America’s inequality to colonial legacies of concentrated power and limited access to education and infrastructure. Huber et al. (2006) showed left-wing governments in Latin America and the Caribbean (1970-2000) significantly reduced wage disparities through redistributive policies.
Huber and Stephens (2012) emphasized that structural barriers weakened leftist parties, limiting redistribution. Effective policies, such as conditional cash transfers and universal programs funded by taxes, reduced inequality but require middle-class support for sustainability.
These studies, while valuable, overlook critical political processes, recent shifts in power dynamics, and economic growth over the past two decades, limiting their ability to address contemporary income inequality in Latin America.
We acknowledge that the temporal scope of this study (1994-2013) did not explicitly account for the impact of the economic boom driven by raw material exports to China-a factor that may have influenced leftist governments’ resource distribution policies across the region. As noted by Lustig (2018) in her research on inequality, periods of economic growth can enhance state capacity to reduce social disparities. However, this dynamic is far from uniform, as illustrated by the case of Venezuela, where the long-standing presence of a leftwing government did not prevent persistently high levels of inequality. Given that social inequality is a multidimensional and highly complex phenomenon, we recognize this limitation and suggest that future research further explore the interplay between economic cycles and redistributive policies, in order to gain a more comprehensive understanding of how these variables affect the context under study.
Table 1 identifies five key categories influencing income inequality: ideological, economic, social, demographic, and institutional factors, summarized in Figure 2.
Table 1 Literature Referenced
| Author (year) | Dependent Variables | Explanatory variables | Period | Unit of Analysis | Estimation Method |
|---|---|---|---|---|---|
| Morley (2001) | Change in inequality | Income; inflation; higher education; basic education; previous level of inequality; land distribution; urbanization; reforms such as privatization, financial, tax, trade liberalization, and education. |
1970 - 1995 |
122 observations, 20 countries: Argentina, Bahamas, Bolivia, Brazil, Chile, Colombia, Costa Rica, Dominican Republic, Ecuador, El Salvador, Guatemala, Honduras, Jamaica, Mexico, Nicaragua, Panama, Paraguay, Peru, Uruguay, and Venezuela. |
Least square |
| Bradley et. al. (2003) |
Change in inequality; Inequality rate before transfer programs. | Government ideology; income transfer programs; constitutional structure; wage coordination; wage dispersion; GDP per capita; education; vocational education; unemployment; industrial employment; trade openness; imports; young population; female labor force; female-headed households. |
1967 - 1997 |
61 observations, 14 countries: Netherlands, Belgium, United States, Canada, Finland, Norway, Australia, Denmark, United Kingdom, Italy, France, Germany, Switzerland, and Sweden. |
OLS (Robust Cluster Standard Errors) |
| Huber et. al. (2006) | GINI Coefficient |
Political parties; social spending; economic development; inflation; demographics; ethnic composition; education; informal sector; land distribution; foreign investment. |
1970 - 2000 |
135 observations, 18 countries: Argentina, Bahamas, Barbados, Bolivia, Brazil, Chile, Colombia, Costa Rica, Dominican Republic, El Salvador, Guatemala, Jamaica, Mexico, Nicaragua, Panama, Peru, Trinidad & Tobago, and Venezuela. |
OLS (Robust Cluster Standard Errors) |
| Huber e Stephens (2012) |
Income distribution; poverty; inequality. |
Party ideology; social policies; institutional, historical ad social aspects. | 1970 - 2000 |
130 observations, 18 countries in quantitative analysis, and five countries in in-depth analysis: Argentina, Brazil, Chile, Costa Rica, and Uruguay. |
OLS (Robust Cluster Standard Errors); qualitative analysis. |
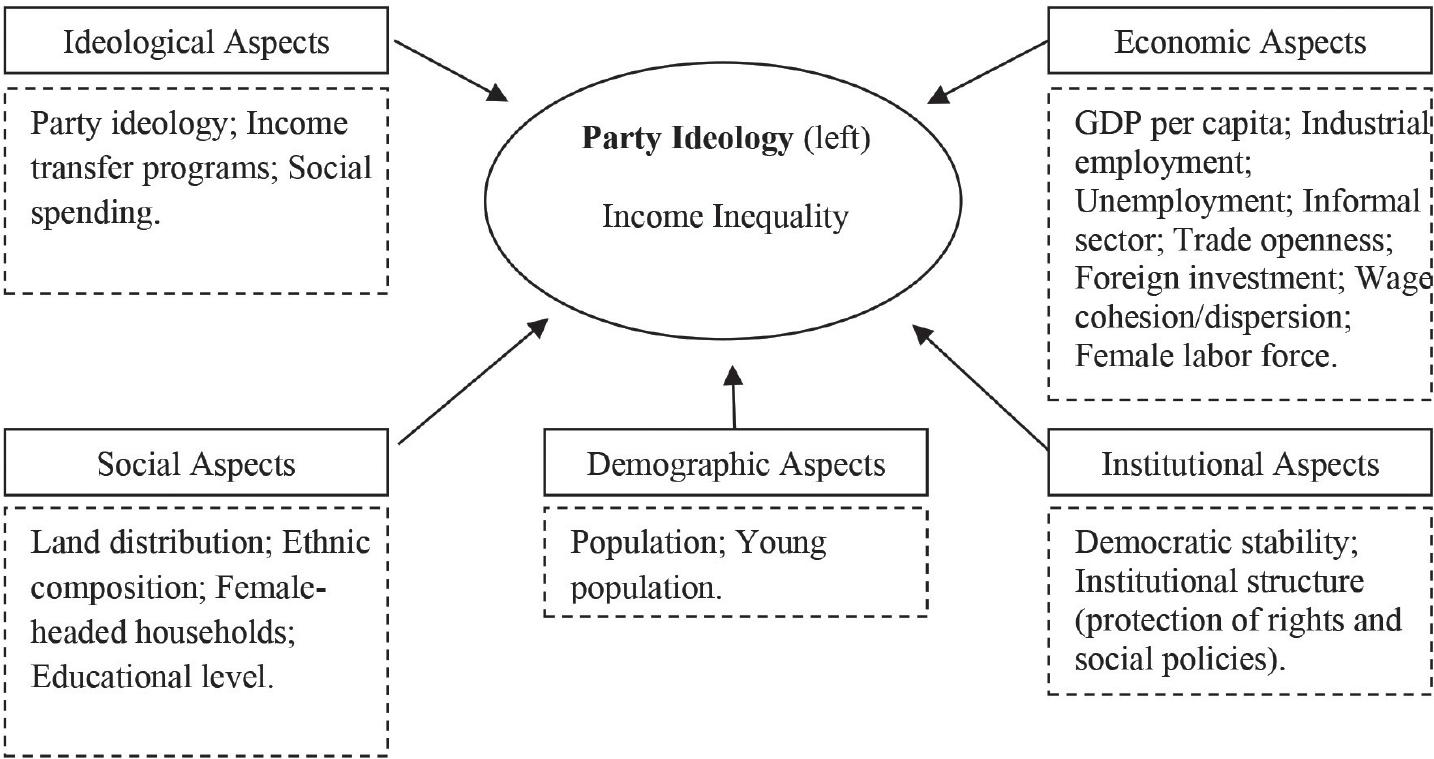
Source: Authors’ elaboration based on Morley (2001), Bradley et. al. (2003), Huber et. al. (2006), and Huber and Stephens (2012).
Figure 2 Causal relations of income inequality
Causal connections
This paper outlines the hypotheses developed within the traditional analytical framework of party political cycles. It incorporates the well-established dependent variables frequently analyzed in the literature on political party cycles-economic growth, inflation, and unemployment. Furthermore, it introduces a less-explored variable as a dependent variable: income inequality (see Table 2).
Table 2 Working Hypothesis
| Hypothesis | Literature | |
|---|---|---|
| H1 | Leftist governments positively affect economic growth. | Hibbs (1977), Alesina (1987) and Borsani (2003). |
| H2 | Right-wing governments generate lower inflation rates. | Hibbs (1977), Alesina (1987) and Borsani (2003). |
| H3 | Left-wing governments reduce unemployment. | Hibbs (1977), Alesina (1987), Ames (1987), Garrett (1998) and Borsani (2003). |
| H4 | Left-wing governments reduce income inequality. | Huber et. al. (2006), Huber e Stephens (2012), Morley (2001), and Bradley et. al. (2003) |
Source: Elaborated by the authors.
We have selected four dependent variables (DVs) for this analysis: DV1) Economic Growth, DV2) Inflation, DV3) Unemployment and DV4) Income Inequality. The first three variables are traditionally analyzed in studies testing the theory of political-economic cycles from a partisan perspective. In contrast, DV4 enables us to examine income inequality not merely as a ‘statistical control,’ as it is often treated in the literature, but as an outcome shaped by a political variable- namely, party ideology. The specific metrics used to measure these dependent variables are detailed below:
DV1: Economic Growth was measured using the annual percentage variation in the Gross Domestic Product (GDP) of the selected countries. Data for this variable were sourced from the Economic Commission for Latin America and the Caribbean (ECLAC) and the International Monetary Fund (IMF).
Dv2 = Inflation was measured based on the annual percentage change in the consumer price index (CPI) of the selected countries. Data for this variable were also obtained from ECLAC and the IMF.
Dv3 = Unemployment was assessed as the percentage of the labor force unemployed in the selected countries. The data for this variable were sourced from ECLAC and the IMF.
Dv4 = Income Inequality was measured using the Gini Index, a widely recognized indicator in the literature. The Gini Index ranges from 0 to 100, providing a detailed assessment of income inequality. It is important to note that, in this analysis, the Gini coefficient is presented on a 0 to 100 scale rather than the 0 to 1 scale commonly used. Data for this variable were obtained from ECLAC and the World Bank.
For the independent variables, party ideology was identified as the primary variable of interest, supplemented by a set of control variables. Additionally, some dependent variables were treated as potential independent variables in accordance with the theoretical expectations of the models. The operationalization of these variables is detailed as follows:
a) Party Ideology: The classification of the governing party’s ideology was determined using the frameworks established by Coppedge (1997) and Colomer (2005). In cases of discrepancies between these classifications, a documentary analysis of government platforms and implemented policies was conducted, following the methodological approach of Borsani (2003) and Amorim Neto and Borsani (2004). This variable was coded as binary: 1 for years governed by left-wing parties and 0 for years governed by center or right-wing parties.
-
b) Control Variables: The control variables included economic growth, inflation, unemployment rate, human capital, and trade openness.
Economic Growth: Measured by the annual percentage change in the GDP of the selected countries.
Inflation: Determined using the annual percentage change in the consumer price index (CPI) of the sampled countries.
Human Capital: Measured using the human capital index, which ranges from 0 to 4, following the methodology proposed by Barro and Lee (2012). This index incorporates years of schooling as a proxy for human capital, as advocated by Psacharopoulos (1994), Acemoglu et al. (2015), and Acs et al. (2014).
Trade Openness: Calculated as the ratio of the combined value of exports and imports to the GDP of a given country, a measure also utilized by Segura-Ubiergo (2007).
Not all estimation models employed the full set of variables. Following the referenced literature, the model with economic growth as the dependent variable included control variables such as inflation, human capital, and trade openness. For the model using inflation as the dependent variable, the control variables considered were economic growth and trade openness. Similarly, in the model where unemployment served as the dependent variable, the control variables included economic growth, human capital, and trade openness. Finally, in the analysis of income inequality as the dependent variable, the estimation model incorporated economic growth, inflation, unemployment, and human capital as control variables (Hibbs, 1977; Ames, 1987; Alesina, 1987; Garrett, 1998; Borsani, 2003; Morley, 2001; Bradley et al., 2003; Huber et al., 2006; Huber and Stephens, 2012).
A lagged dependent variable was included as an independent variable in all statistical models, with further details provided in later sections. The variable selection follows established approaches in similar empirical studies. Table 3 lists the variables, their parameterization, and data sources, while Table 4 summarizes the dependent and independent variables and the expected causal relationships.
Table 3 Parameterization of the selected variables
| Variables | Parametrization | Type | Source |
|---|---|---|---|
| Party ideology | Dummy: 1 for the years governed by a leftwing party, 0 for the remaining years. | Binary |
Coppedge (1997)
& Colomer (2005) |
| Economic Growth | Annual percentage change rate of GDP | Continuous | ECLAC/IMF |
| Inflation | Annual percentage variation of the consumer price index | Continuous | ECLAC/IMF |
| Unemployment | Percentage of the country’s unemployed labor force | Continuous | ECLAC/IMF |
| Income inequality | Índice de Gini, Gini index, within a scale ranging from 0 to 100 | Continuous | ECLAC/World Bank |
| Human Capital | The index proposed by Barro and Lee (2012) and Psacharopoulos (1994), addresses years of schooling and the macroeconomic rate of return on education investment, ranging from 0 to 4 |
Continuous | Penn World Table |
| Trade openness | The ratio of the sum of exports and imports to GDP | Continuous | ECLAC |
Source: Elaborated by the authors.
Table 4 Expected Causal Relationships
| Independent Variables | Dependent Variables | |||
|---|---|---|---|---|
| Economic Growth | Inflation | Unemployment | Income Inequality | |
| Party Ideology | + | + | - | - |
| Economic Growth | + | - | - | |
| Inflation | - | • | + | |
| Unemployment | • | • | + | |
| Human Capital | + | • | - | - |
| Trade Openness | + | +/- | +/- | • |
Source: Elaborated by the authors.
Note: •= variable not incorporated in the selected reference models in this study.
Defining the unit of analysis and the historical series
Latin America was chosen as the focus due to its persistent income inequality, rooted in colonial history (Morley, 2001; Huber et al., 2006). The selected timeframe (1994-2013) reflects a period of relative economic and political stability, characterized by shifts in power across ideological groups. The analysis includes 13 countries: Argentina, Bolivia, Brazil, Chile, Colombia, Costa Rica, Ecuador, Mexico, Panama, Paraguay, Peru, Uruguay, and Venezuela.
To maximize the number of observations and improve inferential accuracy, the database was constructed in a panel format, resulting in 260 observations. This methodological approach offers several advantages: it effectively manages individual heterogeneity, reduces collinearity among explanatory variables, and increases degrees of freedom (Gujarati, 2008). Furthermore, it enables the identification and measurement of effects that are difficult to detect using separate time-series or cross-sectional data (Baltagi, 2005). The construction of the database adhered to procedures outlined by Borsani (2003).
The empirical strategy
Using panel data in this study enhanced inference by increasing the number of observations (Hsiao, 2007). However, this approach required applying specific statistical procedures to address seasonal patterns or trends, ensuring accurate analysis of causal relationships between variables.
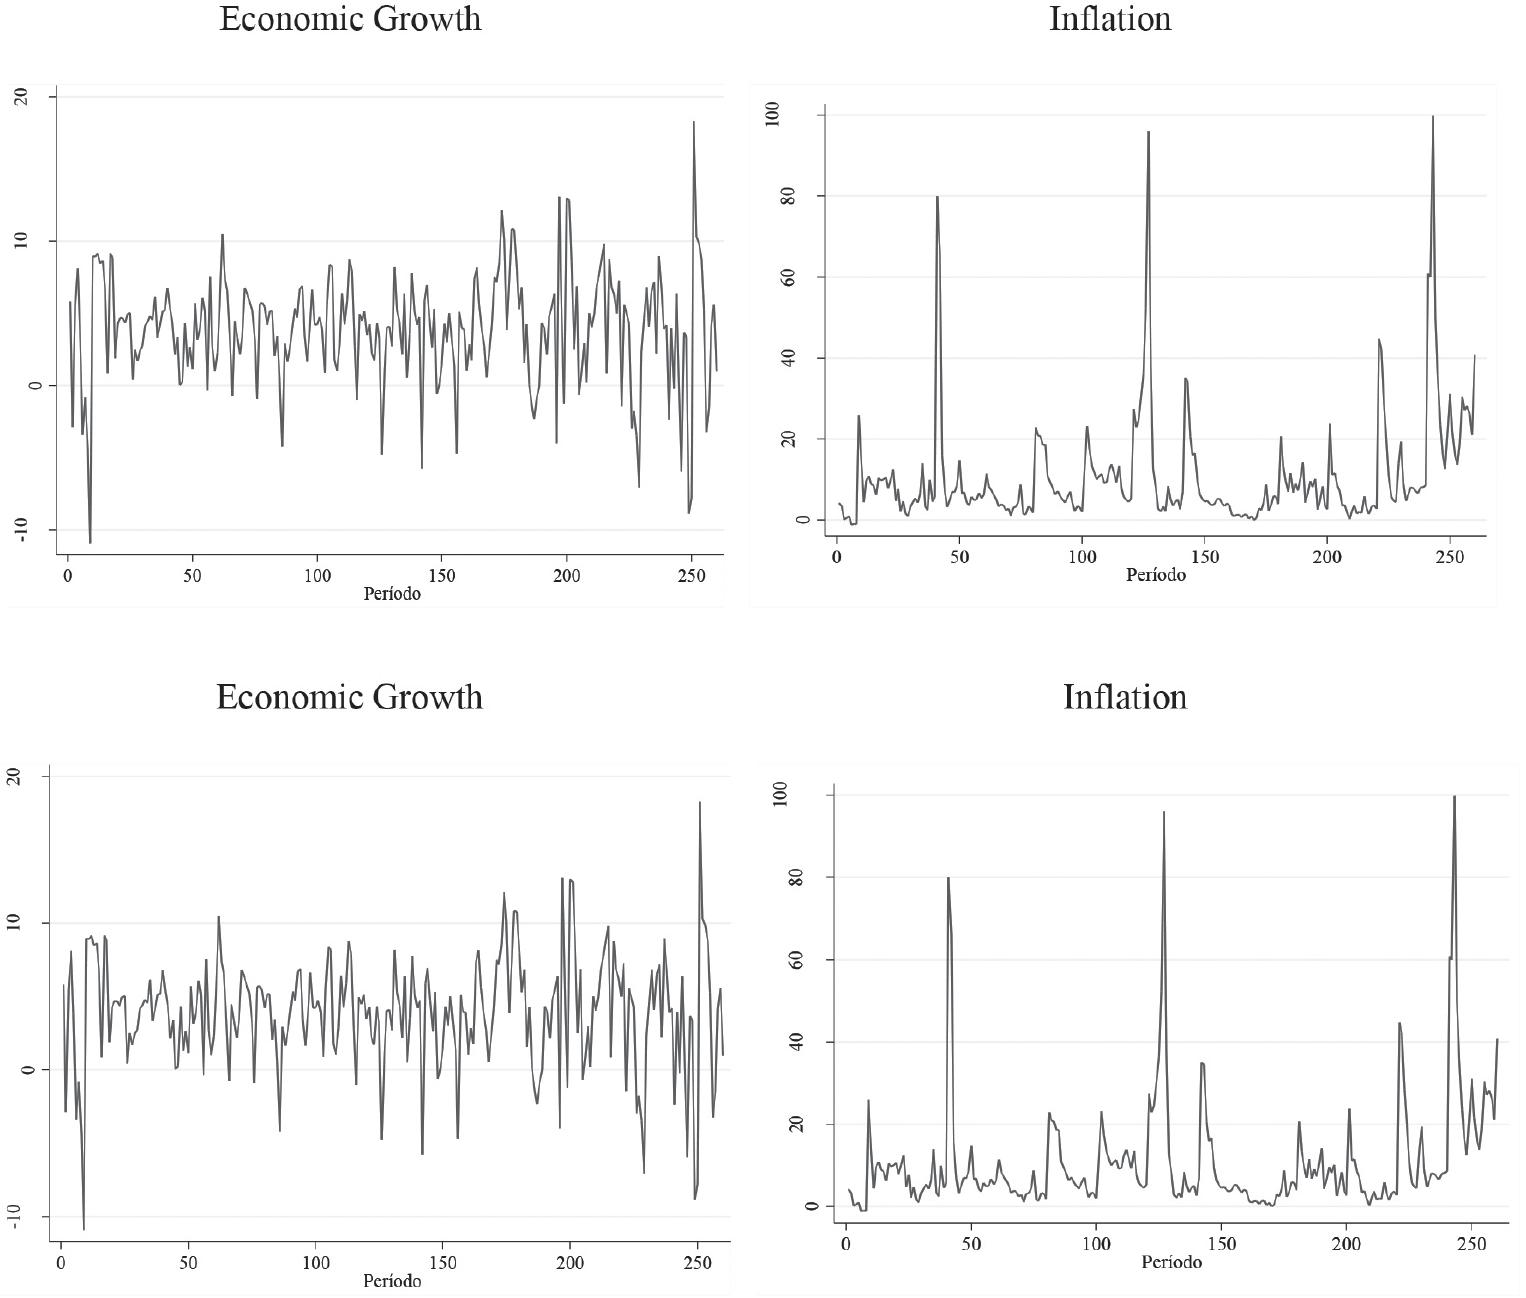
Chart 1 highlights the temporal trends of four dependent variables: Economic Growth (DV1), Inflation (DV2), Unemployment (DV3), and Income Inequality (DV4). Over the observed period, Unemployment and Income Inequality demonstrated a declining trend, whereas Economic Growth and Inflation exhibited relatively stable upward trajectories.
Statistical tests were conducted to assess the stationarity of the historical series for the dependent variables. The approach recommended in the literature to achieve stationarity involves applying successive differencing to the original series (i.e., the series in levels). Following the methodology proposed by Morettin and Toloi (2006), the first difference of Z(t) is defined as:
With the second difference defined as:
Therefore, for the n-th difference of the series Z(t), the equation is defined as:
To determine the optimal number of lags, we employed the Akaike Information Criterion (AIC), Hannan-Quinn Information Criterion (HQIC), and Schwarz’s Bayesian Information Criterion (SBIC). The test results revealed that the historical series achieved stationarity with one lag, as shown in Annex 1A
Unit root tests were conducted on the historical series using a single lag. The
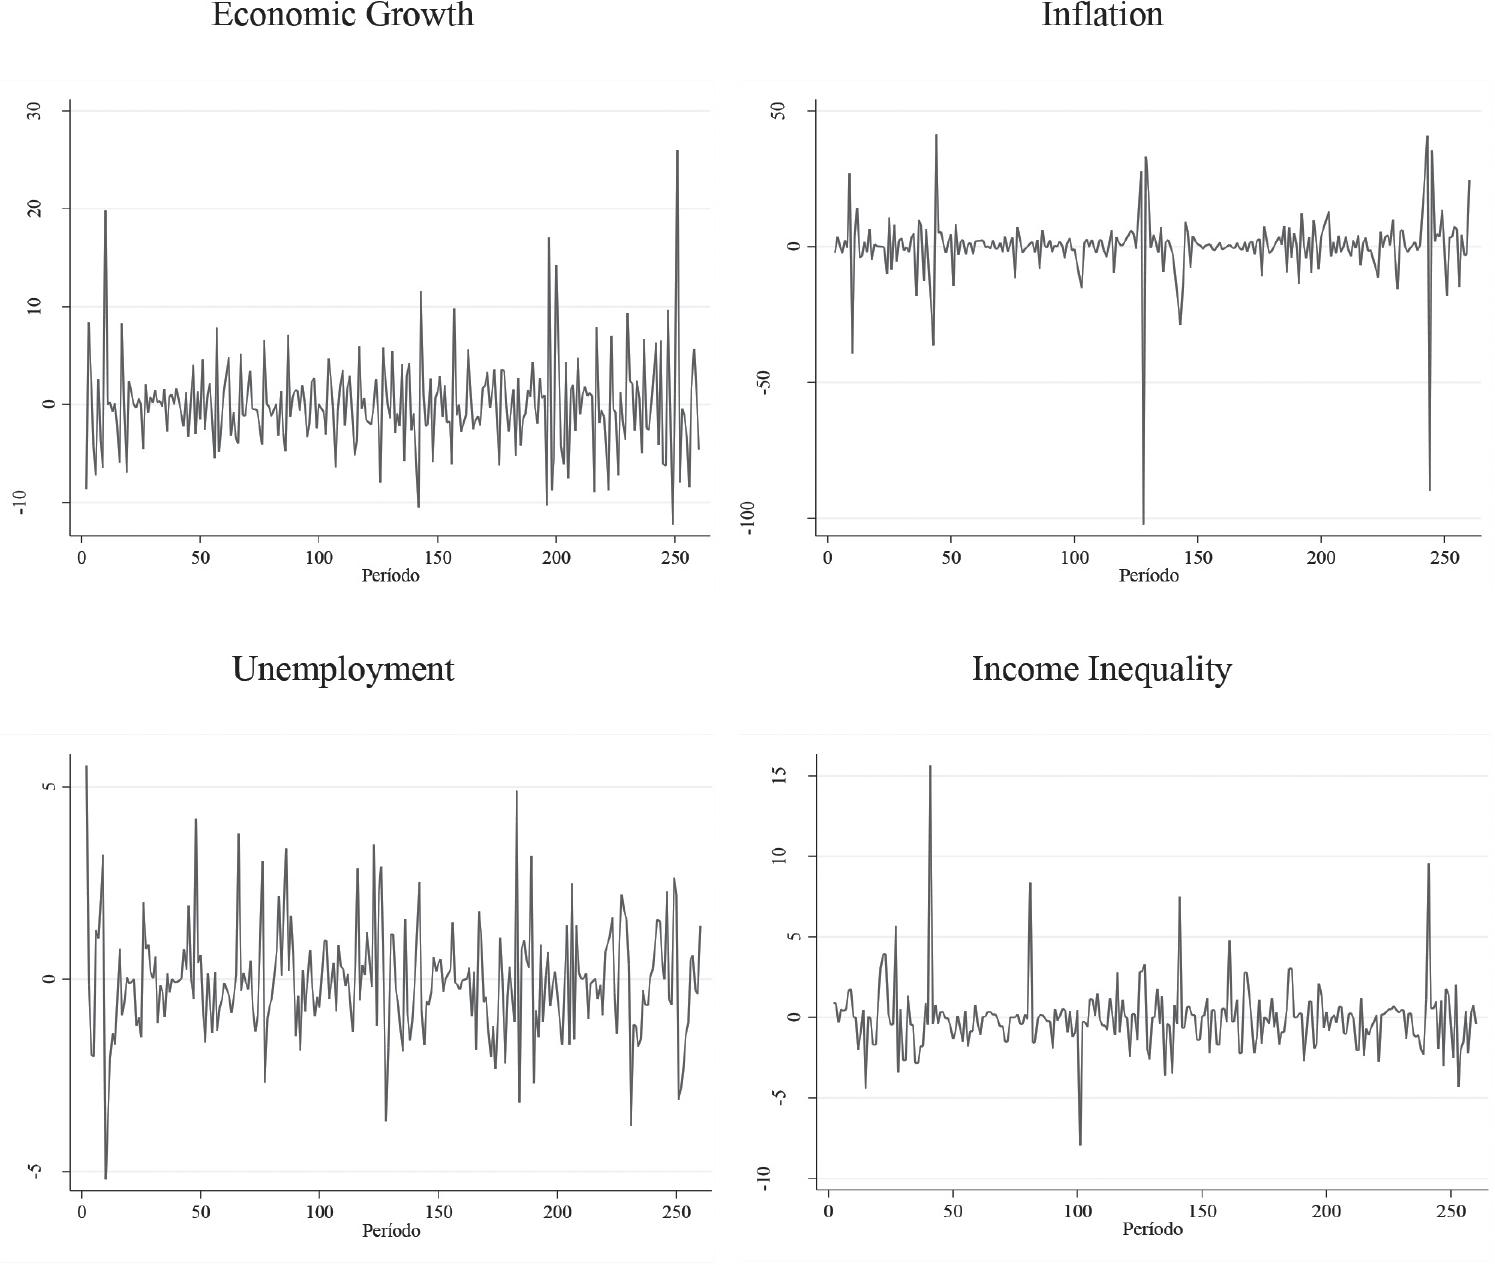
Augmented Dickey-Fuller (ADF) test and the Kwiatkowski-Phillips-SchmidtShin (KPSS) test were employed, with the latter serving as a complementary validation to the former. The results revealed that economic growth, unemployment, and income inequality exhibit stationarity at the first difference, whereas inflation achieves stationarity at the second difference (see Annexes 1B and 1C).
The KPSS test statistics, being lower than the critical values, corroborated the findings of the ADF test, providing no statistical evidence to reject the null hypothesis of stationarity for the series with the specified lags. Chart 2 displays the stationary dependent variables, expressed in their differenced forms.
Model specification
Table 5 presents a descriptive analysis of the selected variables, accounting for the presence of missing data during specific periods within the historical series of each variable.
Table 5 Descriptive Statistics of the Selected Variables
| Variables | Observations | Mean | Standard Deviation | Minimum | Maximum | Missing |
|---|---|---|---|---|---|---|
| Party Ideology | 260 | 0,40 | 0,49 | 0 | 1 | 0 |
| Income Inequality | 260 | 52,03 | 5,21 | 37,90 | 64,30 | 0 |
| Percentage variation of GDP | 260 | 3,90 | 3,85 | -10,89 | 18,28 | 0 |
| Annual percentage variation of inflation | 260 | 18,61 | 128,76 | -1,16 | 2075,82 | 0 |
| Percentage of unemployed individuals | 260 | 8,83 | 3,57 | 2,2 | 22,45 | 0 |
| Human Capital | 234 | 2,52 | 0,23 | 1,95 | 2,97 | 26 |
| Trade openness | 260 | 60,84 | 32,91 | 14,90 | 167,70 | 0 |
Source: Elaborated by the authors
Since the number of cross-sectional units (countries) is smaller than the time series length, and to address potential heteroscedasticity and residual correlation among countries, we adopted Beck and Katz’s (1995) econometric approach. This method uses a linear panel data model with panel-corrected standard errors (PCSE). The Generalized Method of Moments (GMM), often used in panel structures where N<TN<T, can produce inconsistent parameter estimates (Mátyás, 1999), reinforcing the choice of the PCSE methodology.
To address the inherent autocorrelation in panel data, the PSAR1 (Panel Specific Autoregressive Process of Order 1) was applied. Additionally, we included the lagged dependent variable in the models to control for serial autocorrelation. The Hausman test (1978)[1] was conducted to determine the appropriate estimation strategy for unobserved individual effects. The results indicated that random effects were appropriate for the first three models-where the dependent variables were economic growth, inflation, and unemployment-as the null hypothesis of no systematic difference between the coefficients could not be rejected (see Table 6). However, for the model with income inequality as the dependent variable, the null hypothesis was rejected, necessitating the use of fixed effects for this specific model.
Table 6 Hausman Test
| Dependent Variable | x2 | Prob > x2 | Indication |
|---|---|---|---|
| Economic Growth | 0.04 | 1.000 | Random effect |
| Inflation | 1.02 | 0.906 | Random effect |
| Unemployment | 1.18 | 0.946 | Random effect |
| Income Inequality | 15.17 | 0.009*** | Fixed effect |
Source: Elaborated by the authors.
Note: H0 = There is no systematic difference between the coefficients
*p<10%,
** p < 5%,
***p < 1%.
Therefore, the causal model can be expressed in general terms through the following equation:
Where, with Yit as the dependent variable at level, therefore:
With the equation being rewritten as:
Where ΔYit_ corresponds to the dependent variable in each regression (economic growth, inflation, unemployment, and income inequality). α represents the intercept. Dpit denotes the variable of interest, political ideology (years governed by left-wing parties). yi(t-1) refers to the lagged dependent variable. Cit includes the control variables relevant to each model: annual percentage change in inflation and GDP, the percentage of unemployed individuals, the human capital index, and the degree of economic openness. εit represents the error term; i ranges from 1 to 13, representing the countries included in the panel, and t ranges from 1994 to 2013, representing the years covered in the study. All Greek letters in the equation represent the parameters to be estimated.
Results and Discussion
This study’s theoretical framework argues that party ideology influences macroeconomic variables such as economic growth, inflation, and unemployment. Left-wing governments prioritize economic growth to reduce unemployment, even at the cost of higher inflation, while centerand right-wing governments focus on controlling inflation to enhance social well-being (Hibbs, 1977; Alesina, 1987).
The analysis tests these claims through hypotheses H1, H2, and H3, examining the impact of party ideology on traditional partisan political cycle variables. Additionally, it explores the effect of party ideology on income inequality (H4). Regression models emphasize the role of left-wing governments, with centerand right-wing governments serving as the reference category.
Table 7 presents the estimation models, highlighting coefficients and statistical significance, offering robust evidence for the hypotheses.
Table 7 Statistical Modeling
| Dependent Variables | Models | |||
|---|---|---|---|---|
| ‘Traditional’ Dependent Variables | Suggested Dependent Variable |
|||
| [1] Economic Growth | [2] Inflation |
[3] Unemployment | [4] Income Inequality | |
| Party Ideology (left) |
1.076* (1-76) |
1.112 (0.83) | -0.155 (-1.12) |
-0.685** (-2.79) |
| Lagged dependent variable | -0.789*** (-633) | -0.451*** (-4.39) | -0.033 (-0.50) |
-0.104*** (-1.73) |
| Economic Growth |
-0.474** (-2.05) |
-0.245*** (-11.02) |
-0.060** (-2.55) |
|
| Inflation | -0.017 (-0.70) |
- |
0.007*** (19.86) |
|
| Unemployment | - | - | 0.039 (1.28) | |
| Human Capital | 2.039* (1.69) | - | 0.334 (0.84) | -3.736** (-3.26) |
| Trade openness |
0.013** (2.59) |
0.008 (0.86) | -0.001 (-0.06) |
|
| Fix Efect | - | - | - | Omited |
| Constant | -3.209 (-1.06) | 0.862 (0.69) | 0.120 (0.12) |
10.146** (3.18) |
| Number of Observation | 221 | 221 | 208 | 232 |
| R2 | 0.412 | 0.257 | 0.441 | 0.368 |
| WaldX2 | 48.44 | 22.73 | 142.12 | 642.12 |
| Prob > X2 | 0.000 | 0.000 | 0.000 | 0.000 |
Source: Elaborated by the authors.
Note: Linear estimator of panel data with corrected standard errors (PCSE) with PSAR1.
*p < 10%,
**p < 5%,
***p < 1%, and Z-statistic in parentheses.
Model [1] in Table 7 tests hypothesis H1, showing that party ideology is statistically significant and supports theoretical expectations. During left-wing governments, economic growth increased by 1.07 units compared to centeror right-wing administrations. Among control variables, the lagged dependent variable, human capital, and trade openness were also significant. Past economic performance negatively affected current growth, while higher human capital added 2.03 units to growth. Greater trade openness contributed a modest 0.013 units, aligning with findings by Acemoglu et al. (2015) and Acs et al. (2014). Inflation, however, was not statistically significant, indicating no measurable impact on growth in this dataset.
Model [2], testing H2, shows that while party ideology aligns with expectations (inflation tends to rise under left-wing governments), it is not statistically significant, suggesting no clear link between ideology and inflation. Among control variables, the lagged dependent variable and economic growth were significant but unexpectedly negatively correlated with inflation. Trade openness was not significant, indicating no measurable effect on inflation in this dataset.
Model [3], testing H3, showed the expected sign for partisan ideology but no statistically significant association with unemployment. The only significant variable was GDP growth, confirming that higher economic growth correlates with lower unemployment. Human capital, trade openness, and the lagged dependent variable were not significant, leaving their effects inconclusive.
Model [4] extends party political cycle theories by incorporating income inequality as a dependent variable tied to party ideology, testing H4. Fixed-effects model results indicate that left-wing governments reduce wage inequality compared to centerand right-wing governments. The variables in this model demonstrated causal directions consistent with predictions in the literature, although unemployment was not statistically significant. Other control variables, however, showed significance at varying levels: inflation at p < 1%, economic growth and human capital at p < 5%, and the lagged dependent variable (past income inequality) at p < 10%.
Ideology matters
The analysis shows that, in Latin America during the study period, left-wing governments increased economic growth rates by an average of 1% compared to centeror right-wing governments, holding other factors constant. This effect persists when controlling for human capital, trade openness, and prior economic growth, consistent with findings by Hibbs (1977), Alesina (1987), and Alesina and Rosenthal (1995). This outcome likely reflects the adoption of credit expansion policies and income transfer programs, which boosted household consumption and stimulated economic growth.
Left-wing governments were associated with a 1.1% average increase in inflation compared to other ideological orientations, though the coefficient was not statistically significant, aligning with Borsani’s (2003) findings. This may reflect a regional consensus on inflation control, shaped by historical inflation crises, the electoral appeal of anti-inflation policies, and commitments to international organizations, explaining the lack of statistical significance.
Regarding unemployment levels, the data suggest that while the coefficient for left-wing party governance indicated the expected effect of reducing unemployment, it was not statistically significant. A possible explanation for this pattern lies in the role of automatic stabilizers within the economy, such as unemployment insurance, which has become institutionalized as a state policy rather than a government-specific initiative. These mechanisms may reduce the urgency of job seeking among unemployed individuals, thereby dampening the direct impact of political ideology on unemployment rates. In Model [3], a decisive variable for reducing unemployment was economic growth, consistent with theoretical expectations. However, other variables, such as the stock of human capital-, which did not exhibit the expected causal sign-and international market integration, were not statistically significant. This highlights the dominant role of macroeconomic performance over structural factors in influencing unemployment rates.
Model [4] innovatively incorporated income inequality as a dependent variable within party political cycle analysis. The results confirmed that left-wing governments reduce income inequality more effectively than centeror right-wing governments. This supports the applicability of party political cycle theories in linking ideology to income inequality patterns during the study period, aligning with findings by Huber et al. (2006), Huber and Stephens (2012), Morley (2001), and Bradley et al. (2003).
Table 3 shows that party ideology is statistically significant at the 5% level, indicating an average reduction of 0.68 points in the Gini index (0-100 scale) for each year under a left-wing government. For example, a country starting with a Gini index of 60.0 would see it decrease to 57.3 over a four-year term-a 4.5% reduction in income inequality. This effect was observed while controlling for economic growth, inflation, and human capital. However, income inequality in Latin America had been declining since the 1990s, so left-wing governments cannot be credited as the sole drivers of this trend. Instead, they seem to amplify and accelerate the existing reduction compared to centerand right-wing governments.
The lagged dependent variable was statistically significant; showing that higher past inequality is associated with greater reductions in the current period, consistent with the continent’s downward inequality trend. Economic growth was also significant, supporting the commonly observed link between higher GDP growth and reduced income inequality. However, as noted by Ahluwalia (1976), Kuznets (1970), Adelman and Robinson (1988), and Anand and Kanbur (1993), there is no consensus on the growth-inequality relationship.
The findings reveal that inflation significantly impacts income inequality, with a 1% significance level, supporting Huber and Stephens (2012). Controlling inflation benefits the poor disproportionately by increasing their purchasing power, as exemplified by Brazil’s 1994 Real Plan, which curbed inflation and served as a major redistributive measure. In contrast, the unemployment rate was not statistically significant, leaving its effect on income inequality inconclusive, potentially due to the role of automatic stabilizers like unemployment insurance acting as anti-cyclical mechanisms.
Human capital proved to be the most influential factor in reducing income inequality. In Model [4], a one-point increase in the human capital index led to a 3.7-point reduction in the Gini index, significant at the 5% level.
While this study does not explore the specific mechanisms through which left wing governments in Latin America reduced income inequality, certain trends are notable. Cash transfer programs expanded significantly under leftist leadership, scaling up, reaching broader populations, and spreading regionally. Although the volume of resources allocated to these programs could serve as a proxy for their impact, this study focused on whether party ideology influenced wage disparities rather than evaluating direct policy effects.
The findings indicate that party ideology significantly affects income inequality, with the public budget serving as a critical tool for left-wing governments to drive redistribution. These results underscore the importance of political ideology in shaping income inequality patterns in Latin America.
Conclusions
This study analyzed the influence of party ideology on four key variables: economic growth, inflation, unemployment, and particularly income inequality, aiming to test the partisan theory of political economy cycles in Latin America from 1994 to 2013. Specifically, it sought to determine whether party political cycles explain the observed trend of declining income inequality in the region. By treating income inequality as a dependent variable shaped by political decisions, the paper shifts focus from the traditional view of inequality influencing politics to exploring how ideology impacts inequality, contributing to Brazilian political science.
The study built hypotheses based on the theory of party political cycles, proposing causal links between party ideology and macroeconomic variables, and notably, between ideology and income inequality. The findings suggest that income inequality is not merely an economic by-product but also a result of political decisions. This approach highlights the role of social choices and conflicts of interest in shaping public policies, offering the possibility of altering inequality patterns over time.
The results provide initial evidence that party ideology influences income inequality trajectories. However, the study did not examine specific mechanisms used by left-wing governments to reduce inequality, such as redistributive programs or poverty reduction measures. These questions present a promising research agenda for future studies, emphasizing the potential of political action to transform this persistent social issue.

