Inglês (pdf)
 Artigo em XML
 Referências do artigo
 Enviar este artigo por email
 Citado por SciELO
  Similares em
SciELO
Similares em
SciELO 
 Permalink
INTRODUCTION
IgA Nephropathy (IgAN) is one of the most common primary glomerulonephritis worldwide, and represents a major contributor to the global burden of chronic kidney disease (CKD). It has a heterogeneous course, with the initial presentation ranging from asymptomatic hematuria and/or proteinuria to nephrotic syndrome or even rapidly progressive glomerulonephritis. The prognosis of IgAN is highly variable, with the 10‑year risk of end‑stage kidney disease (ESKD) varying between 5% and 60%. Although some risk factors for disease progression have been identified, predicting which patients are at higher risk of CKD progression is still challenging.1
The KDIGO 2021 guidelines highlight the International IgAN Prediction Tool (IgAN‑PT) as an essential resource for quantifying the risk of disease progression. This tool uses clinical and histological data available at the time of kidney biopsy to estimate the risk of a 50% decline in estimated glomerular filtration rate (eGFR) or end‑stage kidney disease (ESKD) at selected time intervals.2
However, in the IgAN‑PT European validation cohort, only 19 patients from a single Portuguese center were included,3 which may limit the tool’s applicability to our popu-lation. In this context, we studied the performance of the IgAN-PT in a Portuguese cohort.
METHODS
We conducted a retrospective cohort study including all adult patients with biopsy‑proven IgAN diagnosed at the Unidade Local de Saúde de Coimbra from January 1st, 1998 to December 31st, 2018.
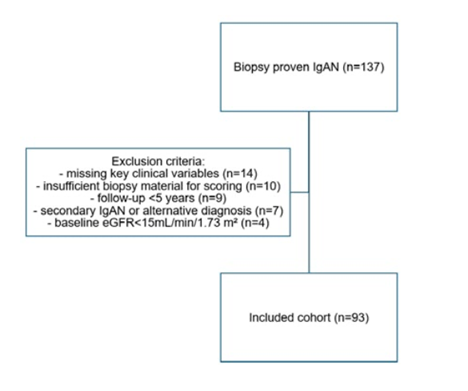
Exclusion criteria comprised (i) a follow‑up under 5 years, (ii) an eGFR below 15 mL/min/1.73 m² at the time of kid-ney biopsy, (iii) insufficient biopsy representativity for Oxford scoring, (iv) incomplete demographic or clinical data,(v) secondary IgAN or alternative diagnoses.
The primary outcome was defined as progression to ESKD or a ≥ 50% decline in eGFR ‑ corresponding to the composite outcome used in the IgAN-PT - assessed at the 5 years after the biopsy.
Patient variables were collected from individual clinical records. The following variables were collected at the time of kidney biopsy: the patient’s age, gender, race, prior medical and family history, current medication, smoking habits, drug or alcohol abuse, weight and height, blood pressure, serum creatinine, 24‑hour proteinuria (obtained from a 24‑hour urine collection or estimated from a urinary protein‑to‑creatinine ratio), and presence of hematuria. Estimated GFR was calculated using the CKD‑EPI equation from 2021. Histopathological samples were classified according to the MEST‑C score. Serum creatinine, proteinuria, hematuria, and medication changes were recorded every 6‑months after biopsy. Continuous variables are expressed as median (interquartile range) or mean (standard deviation), according to the normality of their distribution. Categorical variables are presented as absolute or relative frequencies.
We performed univariate and multivariate binomial logis-tic regression analyses to assess the association between the IgAN-PT and the primary outcome. The discriminatory ability of the IgAN‑PT was evaluated using the area under the receiver operating characteristic curve (AUC). We calculated the Youden index to determine a cut‑off value with the highest validity. Calibration was assessed with the Hosmer‑Lemeshow test.
We also obtained survival estimates using Kaplan‑Meier curves and performed univariate survival analysis using log‑rank tests for specific histopathological parameters. Data are expressed as odds ratios (ORs) with 95% Confidence Intervals (CIs). Statistical significance was defined as a p‑value<0.05. All analyses were performed using software SPSS for Windows, version 28.0 (IBM Corporation, Armonk, NY, USA).
RESULTS
Of the 137 patients with biopsy‑proven IgAN, 93 met the inclusion criteria and were analysed. The excluded patients and corresponding reasons for exclusion are detailed in Fig. 1.
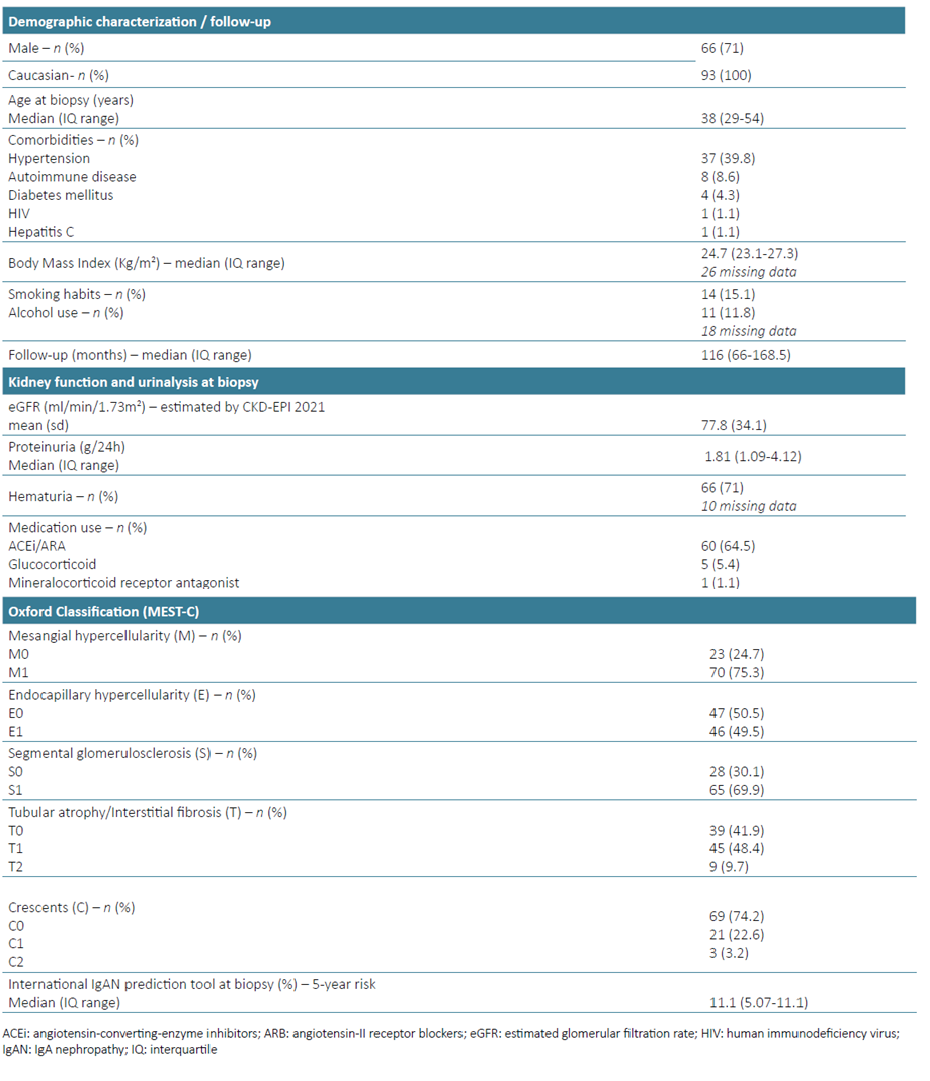
Our sample was predominantly male (71%), with a median age of 38 years (interquartile range 29‑54) and a mean eGFR of 77.8 mL/min/1.73 m² (standard deviation 34.1). Median proteinuria was 1.81 g/24h, and 71% presented with hematuria at the time of kidney biopsy. A detailed demographic and clinical characterization of our cohort at diagnosis, along with the distribution of histopathological features according to the Oxford classification, are summarized in Table 1.
Over the five years following the kidney biopsy, 25 patients reached the primary outcome: 15 progressed to ESKD and 10 experienced a ≥ 50% decrease in eGFR.
In the univariate logistic regression analysis, baseline features such as proteinuria (OR 2.0; 95%CI [1.25‑3.09]), eGFR (OR 0.96; 95%CI [0.95‑0.98]), systolic (OR 1.06; 95%CI [1.02‑1.1]) and diastolic (OR 1.09 95%CI [1.03‑1.15]) blood pressure were significantly associated with the primary outcome (Table 2).
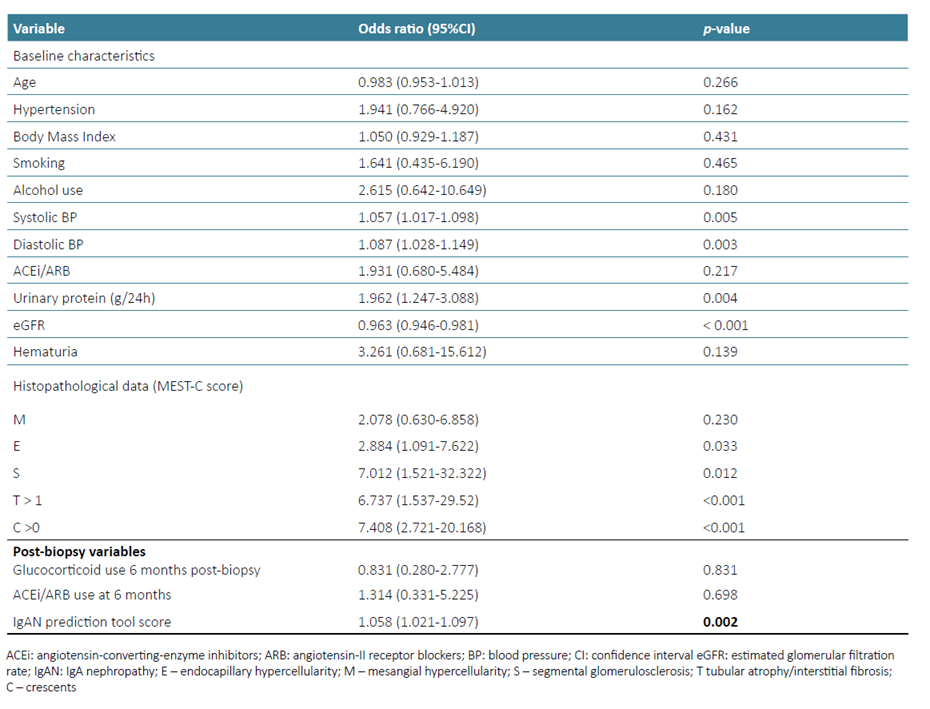
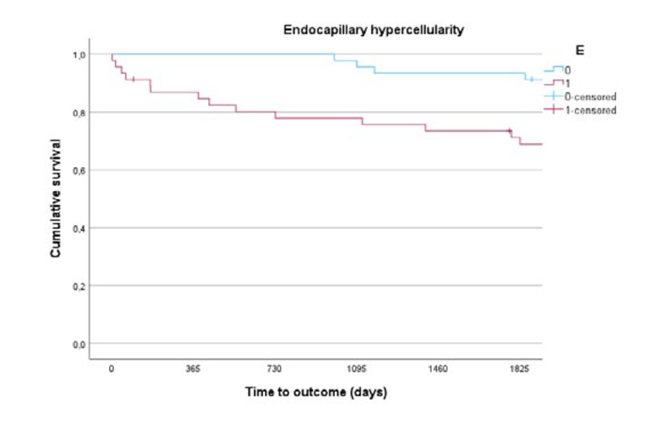
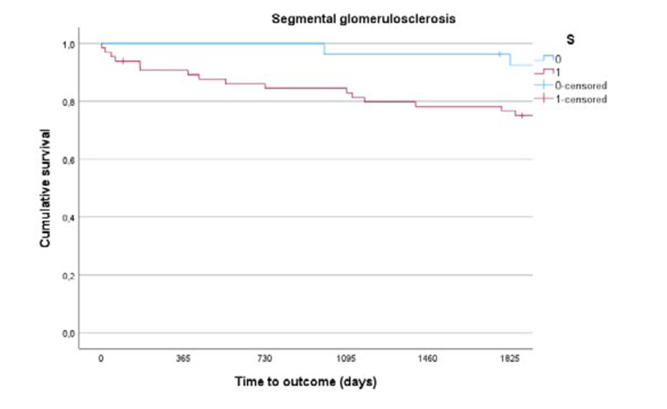
Curiously, smoking (OR 1.64; 95%CI [0.44‑6.19]), alcohol use (OR 2.62; 95%CI [0.64‑10.65]), and body mass index (OR 1.05; 95% CI [0.93‑1.19]) were not associated with poorer renal outcomes in this cohort. Likewise, glucocorticoid therapy (OR 0.83; 95% CI [0.28‑2.78]) or the use of angiotensin‑converting‑enzyme inhibitors/angiotensin‑II receptor blockers (OR 1.32; 95% CI [0.33‑5.23]) at six months post-biopsy did not protect against the primary outcome. Considering histopathological features graded according to the MEST-C score, endocapillary hypercellularity (OR 2.9; 95%CI [1.09‑7.62]), segmental glomerulosclerosis (OR 7.01; 95%CI [1.52‑32.32]), interstitial fibrosis or tubular atrophy (IFTA) > 50% (OR 6.74; 95% CI [1.54‑29.52]) and the presence of crescents (OR 7.41; 95%CI [2.72‑20.17]) were all significantly associated with the primary outcome (Table 2).
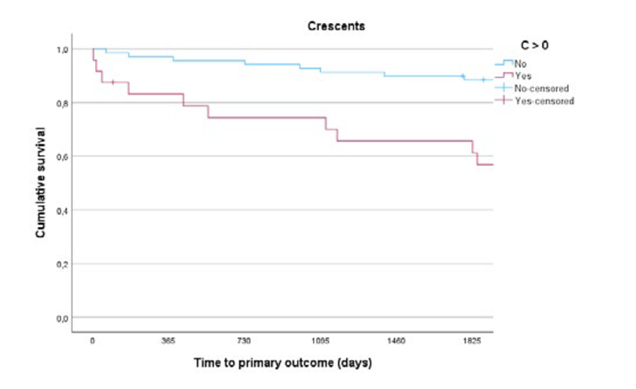
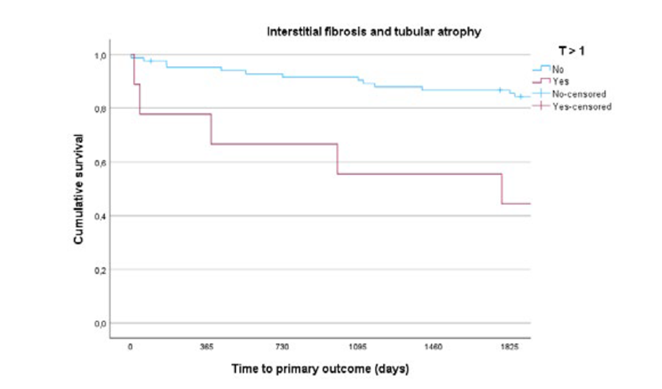
To evaluate the temporal influence of these histopathological features on renal outcomes, we obtained survival estimates using Kaplan-Meier curves (Figs. 2 and 3; Supplementary Figs. 1 and 2). Notably, the impact of inflammatory lesions, such as endocapillary hypercellularity or crescents, on the composite outcome appears to be more pronounced early in the follow‑up period. In contrast, IFTA > 50% contributes to a more stepper decline in the survival curve over time.
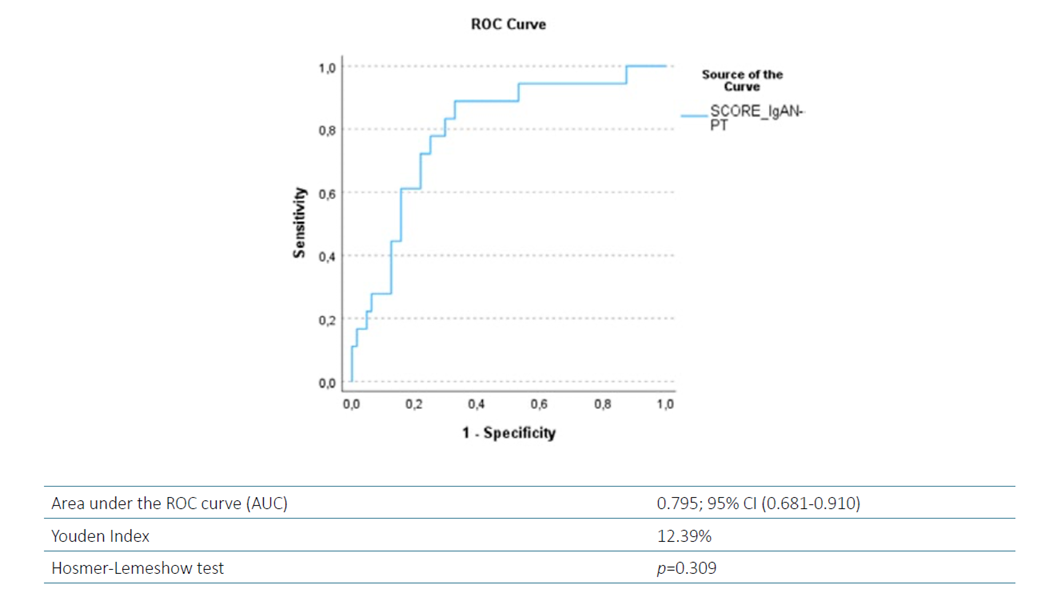
In univariate logistic regression, the IgAN‑PT was significantly associated with 5‑year progression to ESKD or ≥ 50% reduction in eGFR (OR 1.06; 95%CI [1.02‑1.1]) (Table 2), demonstrating good discrimination (AUC 0.75; 95%CI [0.681‑0.910]). The Hosmer‑Lemeshow test indicated good fitness for this model (p=0.309) (Fig. 4). Using the Youden Index, we identified 12.4% as the optimal IgAN‑PT cut‑off value, providing the highest discriminative accuracy for predicting the primary outcome in our cohort.
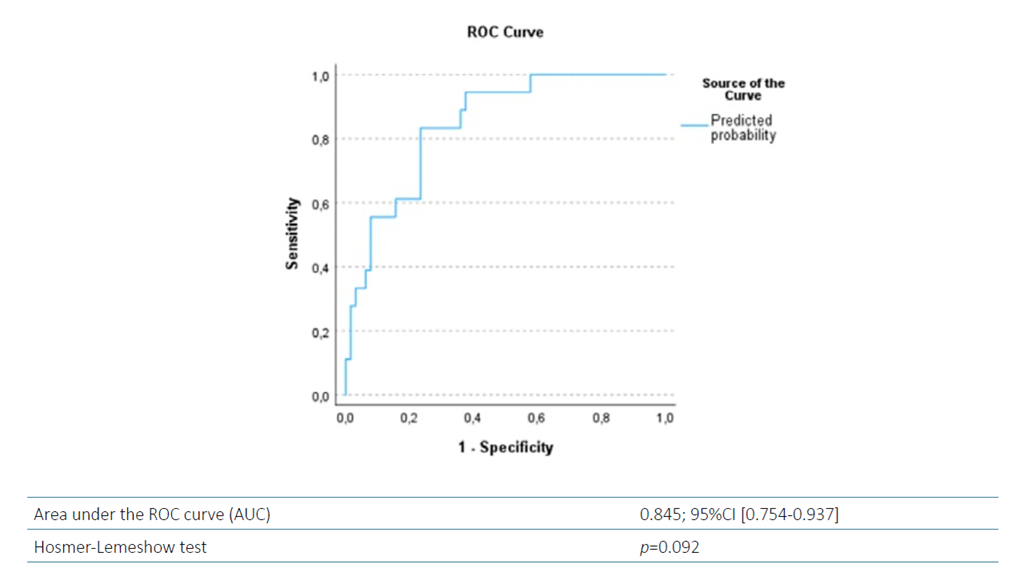
In multivariate logistic regression, both the IgAN‑PT and the presence of crescents (a histopathological feature not included in the IgAN-PT) remained independently associated with the primary outcome (Table 3). A model combining these two variables (Fig. 5) showed improved discrimination (AUC 0.845; 95%CI [0.754‑0.937]), and acceptable goodness‑of‑fit (Hosmer‑Lemeshow, p=0.092). Considering clinically relevant variables that were significantly associated with the primary outcome in univariate analyses, we calculated the Youden Index to identify optimal thresholds for predicting progression to ESKD or a ≥50% reduction in eGFR. Proteinuria above 1.4 g/24h and an eGFR under 79 mL/min/1.73 m2 at baseline offered the best sensitivity‑specificity compromise for identifying patients at higher risk of adverse renal outcomes.
Table 3 Multivariate model incorporating IgAN‑PT and the presence of crescent.
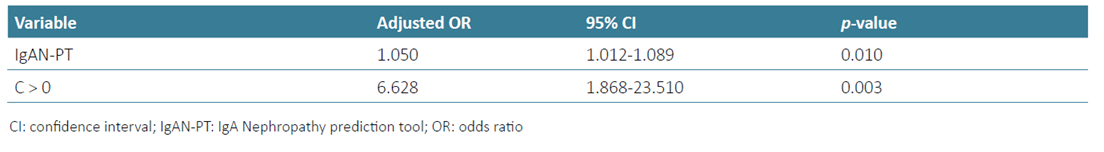
CI: confidence interval; IgAN‑PT: IgA Nephropathy prediction tool; OR: odds ratio
DISCUSSION
Our study validates the IgAN-PT in a large Portuguese cohort and demonstrates that a model combining this tool with the presence of crescents has increased predictive capacity for progression to ESKD or ≥ 50% decline in eGFR. Regardless of the therapeutic strategies pursued after kidney biopsy, baseline proteinuria > 1.4 g/24h, eGFR < 79 mL/min/1.73m2, and an IgAN‑PT >12.4% had the best sensitivity‑specificity compromise for predicting poorer renal outcomes at 5 years.
The 12.4% IgAN‑PT value in our cohort reflects the cut‑off point with the highest discriminative accuracy for predicting the primary outcome and should be interpreted as an exploratory, cohort‑specific threshold. The original Ig-AN‑PT was designed as a continuous prediction tool, and neither its derivation studies nor current guidelines have defined categorical risk thresholds.4,5The intention is not to establish a universal cut‑off point, but rather to illustrate how the IgAN‑PT can be applied in our current clinical practice. Clinically, a predicted 5‑year risk over 12.4% may help stratify patients who need closer monitoring and earlier optimisation of renoprotective therapy, given the higher event rate in our cohort. Nonetheless, this value is likely to vary by population and thus should be viewed as a hypothesis‑generating reference requiring validation in other Portuguese or Southern European cohorts.
In this cohort, the presence of crescents was a significant predictor of progression to ESKD or a ≥50% reduction in eGFR. In a post‑hoc analysis, a multivariate model combin-ing both IgAN‑PT and the presence of crescents showed improved predictive capacity compared with IgAN‑PT alone.
Crescents were incorporated in the Oxford Classification of IgAN in 2016, after the working group concluded that the percentage of glomeruli with crescents was an independent risk factor for poorer renal outcomes, regardless of immunosuppression.6 Their absence from the IgAN-PT stems from incomplete data being available at the derivation and validation cohorts. When initially incorporated as a binary category (presence or absence), rather than the three levels assigned in the MEST‑C score (which were unavailable for all cohorts), crescents did not meet criteria for inclusion in the prediction model, particularly after adjusting for race.1
Although some studies have questioned the prognostic relevance of crescents,4,7,8factors such as the proportion of affected glomeruli, exclusion of patients with lower eGFR or adjustment for immunosuppression use should be considered when interpreting its results. In our homogenous Caucasian cohort, which excluded patients with rapidly progressive disease (i.e. eGFR < 15 mL/min/1.73 m2 at biopsy), the presence of crescents remained an independent risk factor for worse renal outcomes. These results align with a growing body of evidence highlighting crescents as an important marker of disease severity.5,9,10
In our study, therapeutic strategies varied throughout the years. The absence of an observed association between immunosuppressive therapy or reninangiotensin system (RAS) blockade at 6 months post‑biopsy and slower disease progression should be interpreted with caution. As this is a retrospective study spanning a long timeframe (beginning in 1998), substantial evolution has occurred in therapeutic strategies, available medications, and clinical knowledge, contributing to marked treatment heterogeneity. From the 33 patients not on RAS inhibitors at the time of the biopsy, only 10 additional patients initiated therapy within the first 6 months, while the remaining patients either did not tolerate RAS blockade, had insufficient renal function to allow initiation, or had already started haemodialysis - factors that inherently limit treatment comparability across individuals.
Likewise, decisions regarding initiation of corticosteroids were largely physician‑dependent rather than protocolised. Ultimately, steroids were started on patients with more severe disease or poorer prognostic features, potentially biasing results towards an apparent lack of benefit. Collectively, and adding the small sample size, these limitations underscore that our findings should not be interpreted as evidence against the efficacy of immunosuppressive or supportive therapy, but rather as a reflection of the inherent constraints of observational data and the heterogeneity of real‑world clinical practice during the study period. Additionally, only one patient was treated with cyclophosphamide throughout the 5‑year follow‑up period, and another was treated with mycophenolate, making it difficult to draw any conclusions.
This study has important limitations. The retrospective, single‑center design inherently may introduce selection bias. In particular, the decision to exclude patients with shorter follow‑up, although necessary to ensure consis-tent outcome assessment, may have skewed the cohort toward individuals with more stable disease trajectories. Additionally, because all data were obtained from existing clinical records and pathology reports, some variables may have been inconsistently documented, which could affect the precision of our analyses.
A strong point is that, in addition to validating the equation in a Portuguese population that was underrepresented in its validation cohort, we determined cut‑off values for clinically relevant variables that, regardless of the therapeutic approach, are associated with a worse renal prognosis. To the best of our knowledge, this is the first study to establish an IgAN-PT reference value in general, and a baseline eGFR and proteinuria threshold in a Portuguese cohort. This could be relevant for both physicians and patients in establishing long‑term care plans. Finally, it will be interesting to see how the predictive power of these variables performs with new therapeutic approaches in IgAN.
CONCLUSION
This study validates the IgAN-PT score in a Portuguese cohort and underscores its added prognostic value when combined with histological data from the MEST‑C score. Early identification of high‑risk patients, particularly those with proteinuria >1.4 g/24h, eGFR <79 mL/min/1.73 m², IgAN‑PT > 12.4%, or the presence of crescents, may aid in tailoring follow‑up strategies. These findings support a clinicopathological approach to the management of IgA nephropathy and lay the groundwork for future studies assessing the predictive performance of these markers in light of emerging therapeutic options.
Key Learning Points:
IgAN‑PT is a commonly used risk stratification tool recommended by current guidelines;
This tool applies to the Portuguese population, with maximum impact when the presence of crescents is added;
Although crescents are not included in the original tool, their presence alone was an important independent prognostic risk factor for poorer kidney outcomes, highlighting their potential role in the future.