


Serviços Personalizados
Journal

Artigo
 Inglês (pdf)
 Artigo em XML
 Referências do artigo
 Enviar este artigo por email
Indicadores
 Citado por SciELO
 Links relacionados
 Similares em
SciELO
Similares em
SciELO Compartilhar

 Permalink
Ciência e Técnica Vitivinícola
versão impressa ISSN 0254-0223
Ciência Téc. Vitiv. vol.27 no.1 Dois Portos 2012
Climate change projections for the Portuguese viticulture using a multi-model ensemble
Projeção das alterações climáticas para a viticultura Portuguesa utilizando um conjunto de modelos
Helder Fraga1*, João A. Santos1, Aureliano C. Malheiro1, José Moutinho-Pereira1
1 CITAB, Universidade de Trás-os-Montes e Alto Douro, Vila Real, Portugal
SUMMARY
Portuguese vitiviniculture represents an extremely important economic activity for the agricultural sector, particularly for some renowned winemaking regions, such as Alentejo, Dão, Douro, and Minho. Viticultural zoning allows tying the suitability of a given grapevine variety to the local soil and climatic conditions. Given the existing climate variability in the Portuguese territory and its likely changes in the future, this zoning is thus of utmost interest. In this study, the current viticultural zoning in Portugal is discussed, as well as changes induced by climate change in the period 2011-2070. For this purpose, daily temperatures and precipitation rates were used to calculate the Huglin, cool night, dryness and hydrothermal indices. A composite index based on the previous indices was also calculated. For the assessment of the recent past conditions (1961-2000), an observational dataset (E-OBS) was used, while for future climate projections, a dataset comprising 16 simulations of regional climate models (produced by the ENSEMBLES project) was considered. In the future climate, statistically significant increases in the thermal indices are projected to occur in the next decades, while for the precipitation-based indices decreases might be expected, particularly over the south and innermost regions of Portugal. A reshaping of the main Portuguese winemaking regions is likely to occur in the upcoming decades, therefore emphasizing the need for the development of appropriate measures for the adaptation to or mitigation of these climatic changes at the level of varieties and rootstocks used, as well as at the implemented cultural practices, keeping the typicity and wine styles.
Key words: climate change; Portuguese viticulture; climate models; viticultural zoning; bioclimatic indices.
RESUMO
A vitivinicultura portuguesa representa uma atividade económica de extrema importância para o sector agrícola nacional, nomeadamente para algumas regiões de renome, como as Regiões Demarcadas do Alentejo, Dão, Douro ou Vinhos Verdes. A zonagem vitícola permite avaliar a adaptabilidade de uma dada casta às condições climáticas locais. Dada a diversidade climática existente no território português, esta zonagem é assim de particular interesse para a fileira vitivinícola nacional. Sabe-se ainda que alterações no clima futuro poderão ter impactos importantes sobre essa zonagem. No presente estudo é discutida a zonagem vitícola atual em Portugal, bem como as variações induzidas pelas alterações climáticas no período 2011-2070. Para o efeito, a partir de temperaturas e precipitações diárias, foram calculados os índices de Huglin, de frescura das noites, de secura, um índice hidrotérmico e um índice composto, baseado nos índices anteriores. Para a avaliação das condições no passado-recente (1961-2000) foi utilizada uma base de dados observacionais (E-OBS), enquanto para as projeções climáticas foi considerada uma base de dados composta por 16 simulações de modelos climáticos (projeto ENSEMBLES). No clima futuro são projetados aumentos significativos nos índices térmicos, enquanto nos índices de base pluviométrica são projetadas diminuições, em particular sobre o interior sul de Portugal. Pelo exposto, é previsível que nas próximas décadas ocorra uma redistribuição das regiões vitivinícolas portuguesas, destacando-se, por conseguinte, a necessidade de desenvolver atempadamente medidas adequadas de adaptação/mitigação ao nível das castas e dos porta-enxertos recomendados, bem como ao nível das práticas culturais, para ajudar a manter a tipicidade dos vinhos.
Palavras-chave: alterações climáticas; viticultura portuguesa, modelos climáticos; zonagem vitícola; índices bioclimáticos.
INTRODUCTION
Climate is widely acknowledged as one of the major factors affecting vine physiology, phenology and wine parameters (Jones and Davis 2000; Santos et al., 2011). In fact, the most worldwide renowned wine regions are located within relatively narrow latitude belts that provide very specific climatic conditions for high-quality wine production (Spellman 1999; Jones 2006). Although other factors, such as soils, winegrape varieties, agricultural and oenological practices might also play a crucial role on the entire winemaking process, climate and weather represent the most challenging factors (van Leeuwen et al., 2004), as they cannot be directly controlled by producers (we can only predict them and take measures to adapt and/or mitigate their effects) and vary significantly on relatively short time scales. Hence, viticultural zoning based on climatic factors has been applied as a first approach to delineate areas where climate is (nearly) optimal to winegrape growing, thus allowing the development of a sustainable winemaking sector, providing that the other factors are also reasonably suitable.
Specialized bioclimatic indices can be used not only in evaluating the climatic suitability of a specified region to winegrape growth and wine production (Malheiro et al., 2010), but also in assessing some wine quality parameters, such as the balance between acidity and alcoholic content (Huglin 1978; Magalhães 2008). The Huglin index (HI; Huglin 1978) is a degree day index that also accounts for day length during the vine growing season. It is used for assessing the basic thermal and radiative demands of the grapevine so as to complete its phenological stages, including full and adequate grape maturation. In fact, the HI classes show strong correlations with some grapevine phenological events (Jones et al., 2005b), also linking a specific grapevine variety to a given climatic region. The Cool night index (Tonietto and Carbonneau 2004), another thermal index, accounts for night temperatures (minimum temperatures) during the maturation stage (September). Some studies argue that, at this stage, moderately low nocturnal temperatures combined with diurnal high temperatures tend to be advantageous for the production of high quality wines, promoting the synthesis of anthocyanins and other phenolic compounds (Kliewer and Torres 1972; Mori et al., 2005).
Besides assessing the thermal conditions for grapevine development, it is also important to take into account the soil and atmospheric water conditions. The Hydrothermal index (HyI; Branas et al., 1946) combines the effect of air humidity (using precipitation) and temperature during the growing season to assess the risk of grapevine exposure to certain diseases, such as downy mildew. On the other hand, the Dryness index (DI; Riou et al., 1994) accounts for the soil water availability, thus providing information about the water stress conditions. The Composite index (CompI; Malheiro et al., 2010) is useful in depicting regions with suitable climatic conditions for winegrape growth by combining critical thresholds in the previous indices. In this context, by allowing the assessment of climate suitability for winegrape growth, the bioclimatic indices are a widely used tool in viticultural zoning.
The awareness of a potential climate change is fundamental in order to raise adaptive capacity (Metzger et al., 2008). Therefore, the assessment of regional climate projections is of high pertinence for the wine industry by enabling the development of adequate measures for both mitigating their impacts and adapting to the new climatic conditions. Under the A1B International Panel on Climate Change (IPCC) – Synthesis Report on Emission Scenarios (SRES) scenario include a global temperature rise within the range 2.2-5.1ºC (Nakićenović et al., 2000). More specifically, climate in Portugal (typically Mediterranean, with temperature increasing and precipitation decreasing southwards and inwards) is expected to undergo some significant changes under anthropogenic forcing, including changes in temperature and precipitation (Meehl et al., 2007), as well as in their extremes (Costa et al., 2012).
Vineyards in Portugal are virtually grown over almost all of the country (globally about 238.000 ha for aprox. 6 millions hl of wine production; IVV 2011), which is divided in large wine regions throughout the country (Fig. 1). However, the most important wine-making regions are localized within legally bounded controlled appellations (e.g. from north to south: Vinhos Verdes, Douro, Dão and Alentejo). These winemaking areas are quite diverse in their climates, geomorphological features, soil characteristics, and grown grapevine varieties (Magalhães, 2008). As an illustration, while Alentejo (southeast) is mostly flatland with a relatively homogenous climate, the Douro Valley (northeast) is very mountainous and presents a large diversity of mesoclimates. Taking into account the important incomes the winemaking sector brings to the Portuguese economy, amounting nearly 2% of the total national exportation revenue (IVV 2011), the present study is devoted to the understanding of the climatic viticultural zoning in Portugal and the future implication of the climate change in this sector. The current climatic zoning and its likely changes under future climates are discussed using the aforementioned five bioclimatic indices. As such, this study aims at contributing to a better planning of the measures that need to be taken by producers (grape-growers and winemakers), associations and organizations across the Portuguese wine industry in order to cope with climate change.
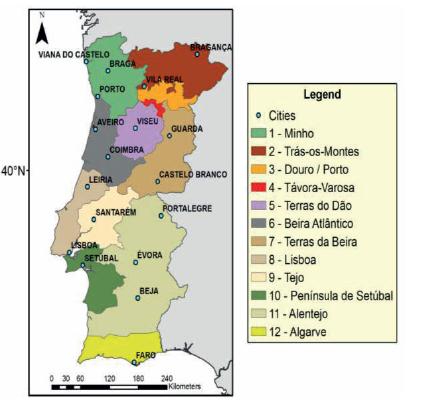
Figure 1– The wine regions of mainland Portugal (IGP- Protected geographical indication).
Regiões vitícolas de Portugal continental (IGP – Indicação geográfica protegida).
MATERIAL AND METHODS
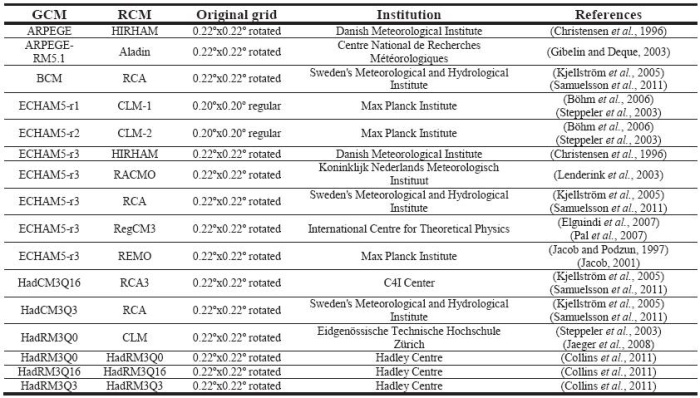
Five bioclimatic indices, specifically 1) Huglin Index (HI), 2) Cool Night Index (CI), 3) Hydrothermic Index (HyI), 4) Dryness Index (DI) and 5) a Composite Index (CompI) were calculated over Portugal, using the mathematical definitions found in Table I. For assessing climate change impacts, two periods were considered in this study. The baseline period representing current-past condition (1961-2000) was calculated using data from an observational dataset (E-OBS, version-5, Haylock et al., 2008), while for the future conditions (2041-2070) data from a 16-member ensemble, produced by the ENSEMBLES project (Table II), was considered. The future period (2041-2070) was chosen to better characterize mid-century climatic conditions under the A1B IPCC-SRES scenario, a moderate anthropogenic radiative forcing scenario, but with already high emission levels (Nakićenovićet al., 2000). Additionally, differences in the number of days with extreme temperatures (above 40ºC) and in the growing-season precipitations between future and current climates are also discussed.
TABLE I
List of all the bioclimatic indices used in this study, their definitions and references.
Lista dos índices bioclimáticos usados neste estudo, as suas definições e referências bibliográficas.
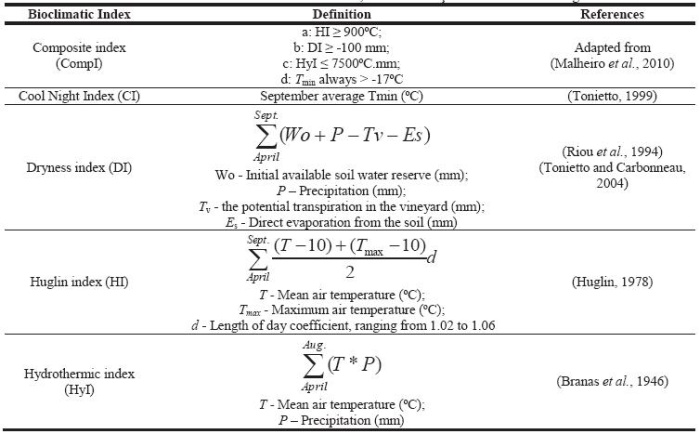
TABLE II
Summary of all GCM / RCM model chains, original grid resolutions, institutions and references used in this study.
Resumo de todos os GCM / RCM usados neste estudo, as suas resoluções originais, instituições e referências bibliográficas.
All data fields, from each model run, were bilinearly interpolated from their original resolution (Table II) onto a 0.25º × 0.25º grid, the same grid as in the observational dataset. This interpolation allowed applying a statistical error correction to the model-derived indices (model output statistics; MOS). The application of MOS to the calculated bioclimatic indices resulted in some losses of data along coastal areas of Portugal, where E-OBS grid-cells have missing data (cf. Fig. 2). Due to the low representativeness of these littoral areas to the national wine production, this is not an important shortcoming and no other statistical approach was thereby applied to estimate the indices in the blank cells (e.g. nearest neighbour with values).
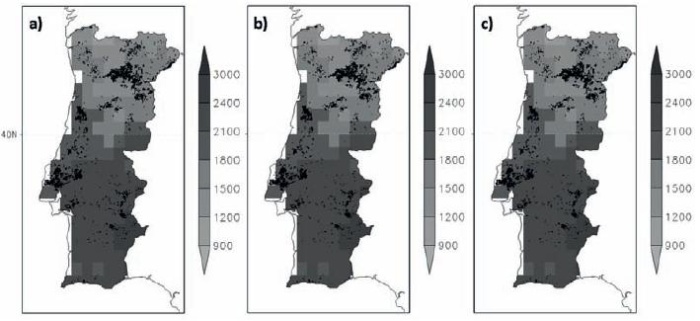
Figure 2– Huglin Index (HI; in ºC) for a) the baseline period (1961-2000), b) the future time period (2041-2070), and c) overall differences in 20412070 minus 1961-2000 (under the A1B IPCC-SRES scenario). Black areas represent the current vineyard land cover.
Índice de Huglin (HI; em ºC) para a) o período de referência (1961-2000), b) o período futuro (2041-2070), e c) diferenças entre 2041-2070 menos 19612000 (sob o cenário A1B IPCC-SRES). Áreas a preto representam o atual coberto vegetal de vinha.
For the model calibration, since the calculated bioclimatic indices are normally distributed (according to the Lilliefors test; not shown), adjustments (transfer-functions) using multiple linear regressions were carried out. The same linear transformations were then applied to all future indices. This type of statistical model error correction has been used in previous studies (Alexandrov and Hoogenboom 2000) and can be used to provide reliable climate change scenarios (Jakob Themeßl et al., 2011). The use of a 16-member ensemble in the assessment of viticultural zoning in the future is an innovative methodology, by taking into account model uncertainties. Due to the large amount of outcomes, the results shown in this study are only focused on the 16-member ensemble mean patterns.
In order to better analyse the spatial distribution of the resulting bioclimatic indices, an overlay of the current vineyard land cover was applied, using the Corine Land Cover Map (CLC 2000; EEA 2002; Büttner et al., 2006). This dataset provides an inventory of the land cover over Europe and has proven to have high accuracy in representing the cartography over mainland Portugal (Caetano et al., 2006).
RESULTS
The 16-member ensemble mean pattern of the HI (Fig. 2a), for the baseline period, shows relatively high values in the central and southern regions of Portugal (1800-3000ºC), while in the northern regions it reveals much lower values (900-1800ºC), which highlights the strong north-south contrast in the climatic conditions over Portugal. Similar results were reported by Magalhães (2008) using weather station data. For the future period (Fig. 2b), an overall increase in these values is expected (Fig. 2c), especially in the innermost regions, reaching values above 3000ºC (highest HI class). This pattern is in clear agreement with Malheiro et al., (2010) in a study for Europe and using a single model (COSMO-CLM). In fact, these increases will indeed lead to shifts to higher classes in the HI throughout Portugal.
This warming is also apparent in the night temperatures, as is suggested by the CI patterns. The CI (Fig. 3a) mean ensemble pattern shows a clear difference between south and coastal regions (warmer nights) and north and innermost regions (cooler nights). The CI future pattern shows a clearer distinction between southern (>18ºC), central (16-18ºC) and northern (12-16ºC) Portugal (Fig. 3b); increases of 2-4ºC are expected to occur, particularly over inland Portugal (Fig. 3c). This overall warming is also attested by an increase in the frequency of occurrence of extreme temperatures in the future. In fact, for some regions of the Douro Valley and Alentejo, projected changes include a significant rise in the number of days with maximum daily temperature above or equal to 40ºC (up to 8 days, Fig. 4a).
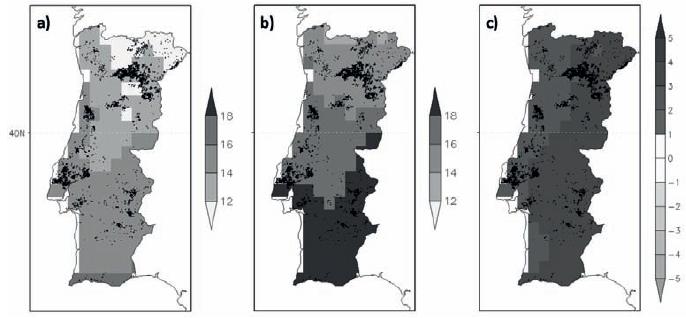
Figure 3– Cool night Index (CI; in ºC) for a) the baseline period (1961-2000), b) the future time period (2041-2070), and c) overall differences in 2041-2070 minus 1961-2000 (under the A1B IPCC-SRES scenario). Black areas represent the current vineyard land cover.
Índice de frescura das noites (CI; em ºC) para a) o período de referência (1961-2000), b) o período futuro (2041-2070), e c) diferenças entre 2041-2070 menos 1961-2000 (sob o cenário A1B IPCC-SRES). Áreas a preto representam o atual coberto vegetal de vinha.
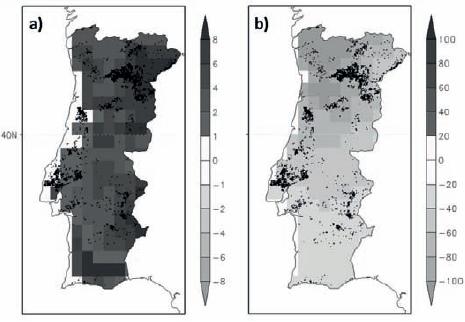
Figure 4– a) Differences in the number of days with maximum daily temperature equal to or above 40ºC (2041-2070 minus 1961-2000). b) Differences in the precipitation totals (in mm) during the growing season (2041-2070 minus 1961-2000).
a) Diferença no número de dias com temperatura máxima diária igual a superior a 40ºC (2041-2070 menos 1961-2000). b) Diferenças no total de precipitação acumulada (em mm) durante a época de crescimento vegetativo (2041-2070 menos 1961-2000).
In addition to the overall warming in both the mean temperature and its extremes, a decrease in precipitation is also projected to occur, particularly in the northern and coastal areas (Fig. 4b). This drying leads to changes in the DI mean pattern (Fig. 5a), where southern Portugal already shows moderate dryness under current climatic conditions (-100 to -50 mm). Changes in this index thereby suggest an important threat or challenge to the viticultural sector owing to the severe dryness that is likely to occur in the future (Fig. 5b), particularly in the innermost southern regions (Fig. 5c). This excessive dryness is in effect considered unsuitable for winegrape growth without irrigation (Koundouras et al., 1999). Conversely, the mean pattern of the HyI (Fig. 6a) for the baseline period shows low to moderate risk of downy mildew disease in most of the Portuguese mainland, and high risk in a small region in north-western Portugal (Alto Minho). The combined effect of the projected future warming and drying will yield a decrease in the HyI (Fig. 6b, c), leading to lower risks of crop contamination, which may have beneficial impacts on the sector.
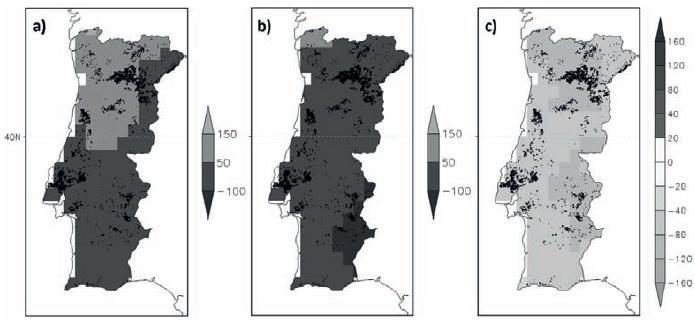
Figure 5– Dryness Index (DI; in mm) for a) the baseline period (1961-2000), b) the future time period (2041-2070), and c) overall differences in 2041-2070 minus 1961-2000 (under the A1B IPCC-SRES scenario). Black areas represent the current vineyard land cover.
Índice de secura (DI; em mm) para a) o período de referência (1961-2000), b) o período futuro (2041-2070), e c) diferenças entre 2041-2070 menos 1961-2000 (sob o cenário A1B IPCC-SRES). Áreas a preto representam o atual coberto vegetal de vinha.
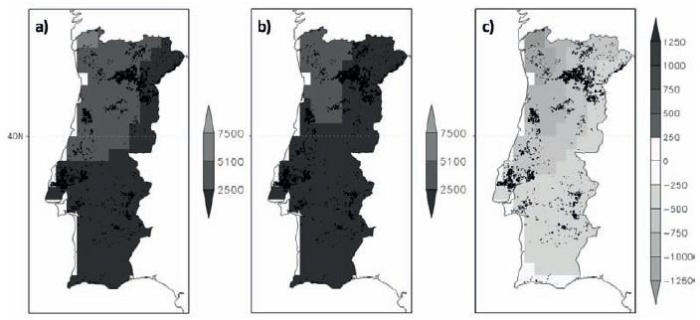
Figure 6– Hydrothermal Index (HyI; in ºC.mm) for a) the baseline period (1961-2000), b) the future time period (2041-2070), and c) overall differences in 2041-2070 minus 1961-2000 (under the A1B IPCC-SRES scenario). Black areas represent the current vineyard land cover.
Índice hidrotérmico (HyI; em ºC.mm) para a) o período de referência (1961-2000), b) o período futuro (2041-2070), e c) diferenças entre 20412070 menos 1961-2000 (sob o cenário A1B IPCC-SRES). Áreas a preto representam o atual coberto vegetal de vinha.
The CompI has proven to be effective in detecting the most suitable European regions for winegrape growth and wine production (Santos et al., 2012). For the baseline period, its mean pattern over Portugal highlights that most of Portugal has a very high suitability for viticulture (values above 0.99; Fig. 7a). However, in the future period, a tendency for lower values is depicted (Fig. 7b). In fact, the excessive dryness underlies this decrease (Fig. 7c) and may represent a detrimental impact on viticulture. Further, some regions in south-eastern Portugal (e.g. Alentejo) will have CompI values that suggest unsuitability for viticulture if mitigation measures (e.g. irrigation) are not implemented. From Fig. 8 it is clear that over most of Portugal (36-41 ºN) a decrease in the area of suitable climate (CompI above 0.5) is expected to occur in the future, while over north-western Portugal (polewards of 41ºN) small increases in suitability are projected instead.
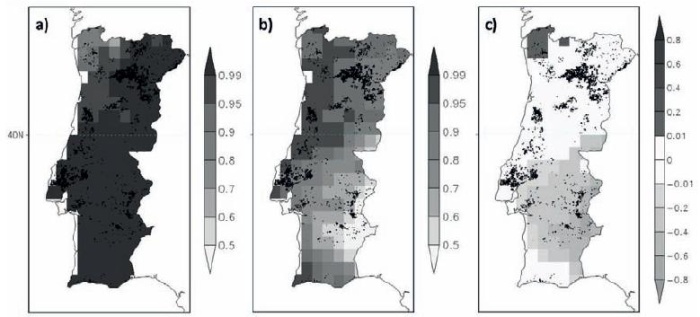
Figure 7– Composite Index (CompI) for a) the baseline period (1961-2000), b) the future time period (2041-2070), and c) overall differences in 2041-2070 minus 1961-2000 (under the A1B IPCC-SRES scenario). Black areas represent the current vineyard land cover. Not statistically significant differences at the 99% confidence level are grey shaded.
Índice composto (CompI) para a) o período de referência (1961-2000), b) o período futuro (2041-2070), e c) diferenças entre 2041-2070 me-nos 1961-2000 (sob o cenário A1B IPCC-SRES). Áreas a preto representam o atual coberto vegetal de vinha. Diferenças estatisticamente não significativas, com um nível de confiança 99%, são marcadas a cinzento.
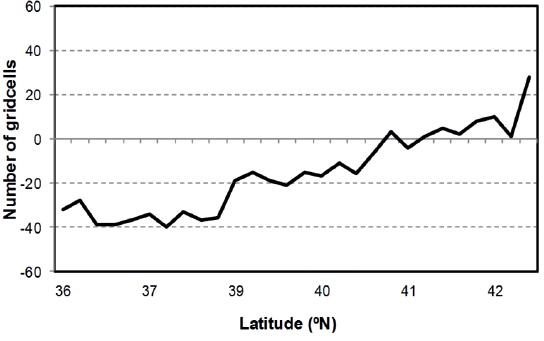
Figure 8– Latitudinal differences between the periods 2041-2070 and 1961-2000 in the number of grid cells equal to or above 0.5 in the composite index (CompI).
Diferenças latitudinais entre os períodos 2041-2070 e 1961-2000 no número de pontos da grelha, com valor igual ou superior a 0.5 no índice composto (CompI).
DISCUSSION AND CONCLUSIONS
Aiming at analysing the climatic viticultural zoning in Portugal, five bioclimatic indices (HI, CI, HyI, DI and CompI) were computed and mapped over mainland Portugal. Their recent-past spatial patterns allow the isolation of the most suitable regions for winegrape growth and high-quality wine production. On the other hand, their changes under human-driven climate change (A1B SRES scenario) suggest a reshaping of the suitability throughout the country in the next few decades (until 2070), shedding some light onto the measures that can be adopted to adapt to or mitigate climate change impacts on the Portuguese wine industry.
The HI pattern reveals a significant increase in the values of this index, particularly over the inland and southern areas of the country (Fig. 2). Increases in the HI have already been reported in other European countries, such as for Germany (Stock et al., (2005); Neumann and Matzarakis (2011) and for France (Duchene and Schneider (2005). This is indeed a clear manifestation of the expected warming under the A1B emission scenario, which is more accentuated in continental rather than coastal areas (Meehl et al., 2007; Knutti et al., 2008). Since HI values are largely tied to grapevine thermal demands, including strong correlations with some phenological events which are projected to be brought forward into warmer periods of the year (Jones et al., 2005b; Bock et al., 2011), this shift may have important impacts on the Portuguese viticultural sector. A careful selection of the winegrape varieties to be grown at a given location in the future, based on the new HI classes, is certainly one important adaptation measure.
The CI pattern clearly shows a warming of the nights in September, which may have important implications on the wine quality that must be taken into full consideration, particularly in southern Portugal (e.g. Alentejo), where average minimum temperatures are currently already above 18ºC (Fig. 3). This projected night-time warming is also supported by previous findings of Malheiro and Santos (2011; for the Iberian Peninsula) and expected to yield altered negatively wine typicity and quality (Bock et al., 2011). Furthermore, the CI values should be even higher in regions where the harvest is usually done in August (e.g. Alentejo). Additionally, the frequencies of occurrence of extremely high maximum temperatures (over 40ºC) will also increase (Fig. 4), which enhance thermal stresses and may eventually result in severe damages or even sunburns in leaves and berries. Grape harvest dates may also be affected by these extreme heat events, resulting from the high sensitivity of this crop to summer temperatures (Chuine et al., 2004; Menzel et al., 2011).
Despite the changes in the thermal conditions, changes in rainfall patterns can also strongly impact on the winegrapes. In particular, the overall decrease in the growing season precipitation, mainly in the northern half of Portugal (e.g. Douro Wine Region, Vinhos Verdes Wine Region), may substantially increase water stress symptoms (Fig. 4). In effect, the lack of rain may require compensation measures through irrigation. This idea is supported by the DI pattern that displays values below the minimum threshold of -100 mm over south-eastern Portugal (Fig. 5). Such decrease in the DI values can thus lead to great reductions in grapevine productivity, caused by damaging water stress (Moutinho-Pereira et al., 2004). In contrast, the decrease in the HyI values, accompanied by the lowering of the rainfall during the growing season, mainly in north-western Portugal (Vinhos Verdes controlled appellation), suggests a weakening of the risks of some pests and diseases in the vineyards, as the downy mildew disease, among others (Fig. 6).
The CompI summarizes the main changes in the previous indices and shows high agreement with the current distribution of the wine types in Portugal (Fig. 7 and Fig. 8). In the current climate, most of mainland Portugal tends to present optimal conditions for winegrape growth, whereas in the future large areas of south-eastern (e.g. Alentejo) will become less suitable. This outcome is supported by previous findings (Jones et al., 2005a; Stock et al., 2005; Malheiro et al., 2010). This climatic unsuitability is largely tied to the excessively dryness that can, however, be widely overcome by implementing both short and long term measures. Amongst the short term measures, it is worth highlighting agronomic practices such as soil (e.g. cover cropping and minimum tillage), organic fertilization and irrigation management and use of chemical sunscreens for leaf protection. With respect to the long term measures, just to mention, adjustments in the training systems (e.g. by optimizing canopy geometry), changes in the altitude or solar exposure of the vineyards (vineyard microclimatic conditions), rootstocks and winegrape varieties of each region and genetic breeding of new varieties, necessarily less sensitive to water and thermal stresses, can be carried out. Furthermore, it is also important to emphasize the genetic pool given by a vast range of autochthonous/indigenous and international varieties (341 legally used varieties; Veloso et al., 2010), which can provide a key tool for climate change adaptation. These measures need to be thoroughly evaluated for each specific region, since some can be more easily implemented in southern Portugal (plain areas more prone to irrigation) and others in northern Portugal (e.g. changes in altitude and solar exposure). Altogether, these measures can effectively mitigate the potentially adverse impacts of climate change on the wine production sector in Portugal and can decisively contribute to its sustainable development in the next decades. Hence, the present study provides some insight into future strategies for the maintenance of a highly competitive wine industry despite climate change threats.
REFERENCES
Alexandrov V. A., Hoogenboom G., 2000. The impact of climate variability and change on crop yield in Bulgaria. Agric. For. Meteorol., 104, 315-327. [ Links ]
Bock A., Sparks T., Estrella N., Menzel A., 2011. Changes in the phenology and composition of wine from Franconia, Germany. Clim. Res., 50, 69-81. [ Links ]
Böhm U., Kücken M., Ahrens W., Block A., Hauffe D., Keuler K., Rockel B., Will A., 2006. CLM- The Climate Version of LM: Brief Description and Long- Term Applications. COSMO Newsletter, 6, 225-235. [ Links ]
Branas J., Bernon G., Levadoux L., 1946. Éléments de viticulture générale. impr. Delmas, Montpellier, France. [ Links ]
Büttner G., Feranec G., Jaffrain G., 2006. EEA CORINE Land Cover Nomenclature Illustrated Guide- Addendum 2006. [ Links ]
Caetano M., Mata F., Freire S., 2006. Accuracy assessment of the Portuguese CORINE land cover map. Global Developments in Environmental Earth Observation from Space, 459-467. [ Links ]
Christensen J.H., Christensen O.B., Lopez P., van Meijgaard E., Botzet M., 1996. The HIRHAM 4 regional atmospheric climate model. DMI Scientific Report 96-4. [ Links ]
Chuine I., Yiou P., Viovy N., Seguin B., Daux V., Ladurie E.L.R., 2004. Historical phenology: Grape ripening as a past climate indicator. Nature, 432, 289-290. [ Links ]
Collins M., Booth B.B., Bhaskaran B., Harris G.R., Murphy J.M., Sexton D.M.H., Webb M.J., 2011. Climate model errors, feedbacks and forcings: a comparison of perturbed physics and multi-model ensembles. Clim. Dynam., 36, 1737-1766. [ Links ]
Costa A.C., Santos J.A., Pinto J.G., 2012.: Climate change scenarios for precipitation extremes in Portugal. Theor. Appl. Clim., 108, 217-234. [ Links ]
Duchene E., Schneider C., 2005. Grapevine and climatic changes: a glance at the situation in Alsace. Agronomy for Sustainable Development, 25, 93-99. [ Links ]
EEA-ETC/TE, 2002. CORINE Land Cover update, I&CLC2000 project, Technical Guidelines. [ Links ]
Elguindi N., Bi X., Giorgi F., Nagarajan B., Pal J., Solmon F., Rauscher S., Zakey A., 2007. RegCM version 3.1 user’s guide. PWCG Abdus Salam ICTP.
Gibelin A.L., Deque M., 2003. Anthropogenic climate change over the Mediterranean region simulated by a global variable resolution model. Clim. Dynam., 20, 327-339. [ Links ]
Haylock M.R., Hofstra N., Klein Tank A.M.G., Klok E.J., Jones P.D., New M., 2008. A European daily high-resolution gridded data set of surface temperature and precipitation for 1950–2006. J. Geophys. Res., 113, D20119.
Huglin P., 1978. Nouveau mode d’évaluation des possibilités héliothermiques d’un milieu viticole. Comptes Rendus de l’Académie d’Agriculture. Académie d’agriculture de France.
IVV, 2011. Vinhos e Aguardentes de Portugal, Anuário 2010/2011. Ministério da Agricultura, do Desenvolvimento Rural e das Pescas: Instituto da Vinha e do Vinho, Lisboa. [ Links ]
Jacob D., 2001. A note to the simulation of the annual and inter-annual variability of the water budget over the Baltic Sea drainage basin. Meteorol. Atmos. Phys., 77, 61-73. [ Links ]
Jacob D., Podzun R., 1997. Sensitivity studies with the regional climate model REMO. Meteorol. Atmos. Phys., 63, 119-129. [ Links ]
Jaeger E.B., Anders I., Luthi D., Rockel B., Schar C., Seneviratne S.I., 2008. Analysis of ERA40-driven CLM simulations for Europe. Meteorol. Z., 17, 349-367. [ Links ]
Jakob Themeßl M., Gobiet A., Leuprecht A., 2011. Empirical-statistical downscaling and error correction of daily precipitation from regional climate models. Int. J. Clim., 31, 1530-1544. [ Links ]
Jones G., 2006. Climate and Terroir: Impacts of Climate Variability and Change on Wine In Fine Wine and Terroir - The Geoscience Perspective. Macqueen, R.W., and Meinert, L.D., (eds.). Geoscience Canada, Geological Association of Canada, St. John’s, Newfoundland, Canada.
Jones G.V., Davis R.E., 2000. Climate influences on grapevine phenology, grape composition, and wine production and quality for Bordeaux, France. Am. J. Enol. Vitic., 51, 249-261. [ Links ]
Jones G.V., White M.A., Cooper O.R., Storchmann K., 2005a. Climate Change and Global Wine Quality. Clim. Change, 73, 319-343. [ Links ]
Jones G.V., Duchêne E., Tomasi D., Yuste J., Braslavska O., Schultz H.R., Martinez C., Boso S., Langellier F., Perruchot C., Guimberteau G., 2005b. Changes in European winegrape phenology and relationships with climate. Proc. XIV GESCO Symposium, 54-61. [ Links ]
Kjellström E., Bärring L., Gollvik S., Hansson U., Jones C., Samuelsson P., Rummukainen M., Ullerstig A., WillØn U., Wyser K., 2005. A 140-year simulation of European climate with the new version of the Rossby Centre regional atmospheric climate model (RCA3). SMHI, 54 pp. [ Links ]
Kliewer W.M., Torres R.E., 1972. Effect of Controlled Day and Night Temperatures on Grape Coloration. Am. J. Enol. Vitic., 23, 71-77. [ Links ]
Knutti R., Allen M.R., Friedlingstein P., Gregory J.M., Hegerl G.C., Meehl G.A., Meinshausen M., Murphy J.M., Plattner G.K., Raper S.C.B., Stocker T.F., Stott P.A., Teng H., Wigley T.M.L., 2008. A review of uncertainties in global temperature projections over the twenty-fi rst century. J. Clim., 21, 2651-2663. [ Links ]
Koundouras S., van Leeuwen C., Seguin G., Glories Y., 1999. Influence of water status on vine vegetative growth, berry ripening and wine characteristics in mediterranean zone (example of Nemea, Greece, variety Saint-George, 1997). J. Int. Sci. Vigne Vin, 33, 149-160. [ Links ]
Lenderink G., van den Hurk B.,. van Meijgaard E, van Ulden A., Cuijpers H., 2003. Simulation of present-day climate in RACMO2: first results and model developments. Ministerie van Verkeer en Waterstaat, Koninklijk Nederlands Meteorologisch Instituut. [ Links ]
Magalhães N., 2008. Tratado de viticultura: a videira, a vinha e o terroir. Chaves Ferreira Publicações, Lisboa, Portugal. [ Links ]
Malheiro A.C., Santos J.A., 2011. Macrozonagem vitivinícola da Península Ibérica face a cenário de alteração climática. Atlas das castas da Península Ibérica - história, terroir, ampelografia. Coordenador Jorge Böhm, Dinalivro., 155 -159. [ Links ]
Malheiro A.C., Santos J.A., Fraga H., Pinto J.G., 2010. Climate change scenarios applied to viticultural zoning in Europe. Clim. Res., 43, 163-177. [ Links ]
Meehl G.A., Stocker T.F., Collins W.D., Friedlingstein P., Gaye A.T., Gregory J.M., Kitoh A., Knutti R., Murphy J.M., Noda A., Raper S.C.B., Watterson I.G., Weaver A.J., Zhao Z.-C., 2007. Global Climate Projections. In: Climate Change 2007: The Physical Science Basis. Contribution of Working Group I to the Fourth Assessment Report of the Intergovernmental Panel on Climate Change [Solomon, S., D. Qin, M. Manning, Z. Chen, M. Marquis, K.B. Averyt, M. Tignor and H.L. Miller (eds.)]. Cambridge University Press, Cambridge, United Kingdom and New York, NY, USA.
Menzel A., Seifert H., Estrella N., 2011. Effects of recent warm and cold spells on European plant phenology. Int. J. Biometeorol., 55, 921-932. [ Links ]
Metzger M.J., Schroter D., Leemans R., Cramer W., 2008. A spatially explicit and quantitative vulnerability assessment of ecosystem service change in Europe. Reg. Environ. Change, 8, 91-107. [ Links ]
Mori K., Sugaya S., Gemma H., 2005. Decreased anthocyanin biosynthesis in grape berries grown under elevated night temperature condition. Sci. Hort., 105, 319-330. [ Links ]
Moutinho-Pereira J.M., Correia C.M., Gonçalves B.M., Bacelar E.A., Torres-Pereira J.M., 2004. Leaf gas exchange and water relations of grapevines grown in three different conditions. Photosynthetica, 42, 81-86. [ Links ]
Nakićenović N., Alcamo J., Davis G., de Vries H.J.M., Fenhann J., Gaffin S., Gregory K., Grubler A., Jung T.Y., Kram T., La Rovere E.L., Michaelis L., Mori S., Morita T., Papper W., Pitcher H., Price L., Riahi K., Roehrl A., Rogner H.-H., Sankovski A., Schlesinger M., Shukla P., Smith S., Swart R., van Rooijen S., Victor N., Dadi Z., 2000. Emissions scenarios. A special report of Working Group III of the Intergovernmental Panel on Climate Change. Cambridge University Press, Cambridge, United Kingdom and New York, NY, USA. [ Links ]
Neumann P. A., Matzarakis A., 2011. Viticulture in southwest Germany under climate change conditions. Clim. Res., 47, 161-169. [ Links ]
Pal J.S., Giorgi F., Bi X.Q., Elguindi N., Solmon F., Gao X.J., Rauscher S.A., Francisco R., Zakey A., Winter J., Ashfaq M., Syed F.S., Bell J.L., Diffenbaugh N.S., Karmacharya J., Konare A., Martinez D., da Rocha R.P., Sloan L.C., Steiner A.L. 2007. Regional climate modeling for the developing world - The ICTP RegCM3 and RegCNET. Bull. Am. Met. Soc., 88, 1395-1409. [ Links ]
Riou C., Carbonneau A., Becker N., Caló A., Costacurta A., Castro R.,. Pinto P.A, Carneiro L.C., Lopes C., Clímaco P., Panagiotou M.M., Sotez V., Beaumond H.C., Burril A., Maes J., Vossen P., 1994. Le determinisme climatique de la maturation du raisin: Application au zonage de la teneur en sucre dans la Communauté Européenne. Office des Publications Officielles des Communautés Européennes, Luxembourg, 319 pp. [ Links ]
Samuelsson P., Jones C. G., Willen U., Ullerstig A., Gollvik S., Hansson U., Jansson C., Kjellstrom E., Nikulin G., Wyser K., 2011. The Rossby Centre Regional Climate model RCA3: model description and performance. Tellus A., 63, 4-23. [ Links ]
Santos J.A., Malheiro A.C., Karremann M.K., Pinto J.G., 2011. Statistical modelling of grapevine yield in the Port Wine region under present and future climate conditions. Int. J. Biometeorol., 55, 119-131. [ Links ]
Santos J.A., Malheiro A.C., Pinto J.G., Jones G.V., 2012. Macroclimate and viticultural zoning in Europe: observed trends and atmospheric forcing. Clim. Res., 51, 89-103. [ Links ]
Spellman G., 1999. Wine, weather and climate. Weather, 54, 230-239. [ Links ]
Steppeler J., Doms G., Schattler U., Bitzer H.W., Gassmann A., Damrath U., Gregoric G. 2003. Meso-gamma scale forecasts using the nonhydrostatic model LM. Meteorol. Atmos. Phys., 82, 75-96. [ Links ]
Stock M., Gerstengarbe F.W., Kartschall T., Werner P.C., 2005. Reliability of climate change impact assessments for viticulture. Acta Hortic., 689, 29-39. [ Links ]
Tonietto J., 1999. Les macroclimats viticoles mondiaux et l’influence du mésoclimat sur la typicité de la Syrah et du Muscat de Hambourg dans le sud de la France: méthodologie de caractérisation, PhD Dissertation, Ecole Nationale Supérieure Agronomique, Montpellier, France.
Tonietto J., Carbonneau A., 2004. A multicriteria climatic classification system for grape-growing regions worldwide. Agric. For. Meteorol., 124, 81-97. [ Links ]
van Leeuwen C., Friant P., Choné X., Tregoat O., Koundouras S., Dubordieu D., 2004. Influence of climate, soil, and cultivar on terroir. Am. J. Enol. Vitic., 55, 207-217. [ Links ]
Veloso M.M., Almandanim M.C., Baleiras-Couto M., Pereira H.S., Carneiro L.C., Fevereiro P., Eiras-Dias J., 2010. Microsatellite database of grapevine (Vitis vinifera L.) cultivars used for wine production in Portugal. Ciência Téc. Vitiv., 25, 53-61. [ Links ]
ACKNOWLEDGEMENTS
The authors acknowledge the European Commission funded ENSEMBLES project (GOCECT-2003-505539) for providing the model datasets (http://ensembles-eu.metoffice.com/) and the ECA&D project (http://eca.knmi.nl) for providing the E-OBS dataset. We also thank Dr. Joaquim Pinto, at the University of Cologne, the German Federal Environment Agency and the COSMO-CLM consortium for supplying the COSMO-CLM data. We also acknowledge the European Environmental Agency for providing the Corine Land Cover data. This study was undertaken under the FCT (Portuguese Foundation for Science and Technology) funded ClimVine-Safe project (PTDC/AGR-ALI/110877/2009). This work is also supported by European Union Funds (FEDER/COMPETE - Operational Competitiveness Programme) and by national funds (FCT) - under the project FCOMP-01-0124-FEDER-022696.
* Corresponding author: Helder Fraga, Centre for the Research and Technology of Agro-Environmental and Biological Sciences, University of Trás-os-Montes e Alto Douro, P. O. Box 1013, 5001-801 Vila Real, Portugal, Fax: +351 259 350 480, e-mail:hfraga@utad.pt
(Manuscrito recebido em 08.05.2012. Aceite para publicação em 22.06.2012)
