


Services on Demand
Journal
Article
 English (pdf)
 Article in xml format
 Article references
 Send this article by e-mail
Indicators
-
 Cited by SciELO
 -
 Access statistics
Related links
-
 Similars in
SciELO
Similars in
SciELO
Share

 Permalink
Finisterra - Revista Portuguesa de Geografia
Print version ISSN 0430-5027
Finisterra no.91 Lisboa June 2011
ARTIGO ORIGINAL
Interannual oscillations in winter rainfall over Europe. Iberia study case
Oscilações interanuais da precipitação invernal na Europa. O caso da Península Ibérica
Oscillations interannuelles des précipitations hivernales en Europe. Le cas de la Péninsule ibérique
Pedro Tildes Gomes1
1 Investigador do Centro de Estudos Geográficos (IGOT-Ul). E-mail: pedrotildes@sapo.pt
ABSTRACT
Low-frequency variability is a good starting point for modelling the climate system and understanding mechanisms that can give us some indication of future climate evolution. This work aims to better understand the degree of association between the atmospheric circulation and precipitation over Europe and the Iberian Peninsula. To achieve this goal, the standard precipitation anomalies in Europe and the anomalies of sea level pressure (SLP) in the North Atlantic region during the twentieth century were subjected to Multi-Channel singular spectrum analysis (MSSA). This procedure allows us to measure the degree of association between the SLP and precipitation fields. The identification of common oscillations between the two climatic fields led not only to the confirmation of the physical meaning of these oscillations, but also to the identification of the dynamical evolution of the ocean-atmosphere system in the North Atlantic. Two oscillations, statistically significant, common to both the precipitation field and SLP field were isolated with periods of about 8 years and 5.3 years. The 8-year oscillation is the most significant and robust of the two climatic fields and exhibits a classic NAO pattern, with an out-of-phase variability between northern and southern parts of the domain. Furthermore, it is characterized by a westward propagation of the climate signal and a perfect out-of-phase variability between the precipitation and SLP. The 8-year oscillation is also very significant in the Iberian Peninsula and is associated with dry winters and wet winters, whose sequence was identified for the twentieth century. The 5.3-year oscillation is related to the East Atlantic Pattern that exhibits another dipolar structure, with an out-of-phase variability between southwest and northwest Europe. The regularity of the 8 year oscillation can be anticipated with a degree of certainty, thus permitting a prediction of the occurrence of wet and dry years and allowing for a better management of water resources.
Key words: Climatic signal, MSSA, precipitation, sea level pressure, oscillations.
RESUMO
A variabilidade de baixa frequência é um bom indicador para modelizar o sistema climático e apreender mecanismos que dêem indicações sobre evolução futura do clima. Com este trabalho pretende-se compreender melhor a relação entre a circulação atmosférica e a precipitação na europa e na Península ibérica. Para atingir esse objectivo, as anomalias standard da precipitação na europa e as anomalias da pressão ao nível do mar na região do atlântico norte durante o século XX foram submetidas à Multi-Channel Singular Spectrum Analysis (MSSA). Este procedimento permite medir o grau de associação entre os campos de pressão e precipitação. a identificação de oscilações de período comum entre os dois campos possibilitou não só a confirmação do significado físico dessas oscilações, mas também identificar dinâmicas de evolução do sistema oceano-atmosfera no atlântico norte. Duas oscilações, estatisticamente significativas, comuns entre o campo de precipitação e o campo de pressão, foram isoladas com períodos de aproximadamente 8 anos e de 5,3 anos. a oscilação de 8 anos é a mais significativa e robusta oscilação comum entre o campo de precipitação e de pressão e exibe um padrão clássico da NAO, com a variação em oposição de fase entre o norte e o sul da europa. Além disso, é ainda caracterizada por uma propagação para oeste do sinal climático e por uma perfeita oposição de fase entre o campo de precipitação e de pressão. a oscilação de 8 anos é também muito significativa na Península ibérica e surge associada aos invernos de seca e invernos chuvosos, cuja sequência foi identificada para o século XX. a oscilação de 5,3 anos está relacionada com o padrão do atlântico Oriental (East Atlantic Pattern), que se traduz numa outra estrutura dipolar de oposição de fase entre o sudoeste e o noroeste na europa. Pela regularidade da oscilação de 8 anos, facilmente se pode antecipar, com algum grau de certeza, a chegada de anos secos e húmidos, possibilitando, desta forma, uma melhor gestão dos recursos hídricos.
Palavras‑chave: Sinal climático, MSSA, precipitação, pressão ao nível do mar, oscilações, Europa.
RÉSUMÉ
La variabilité de basse fréquence est un bon indicateur pour la modélisation du système climatique et la compréhension des mécanismes qui donnent des indications sur la future évolution du climat. On cherche à comprendre la relation existant entre la circulation atmosphérique et les précipitations en Europe et dans la Péninsule ibérique. Pour atteindre cet objectif, les anomalies standard des précipitations en Europe et les anomalies de la pression au niveau de la mer de l’atlantique nord durant le XXème siècle ont été soumises à une Multi-Channel singular spectrum analysis (MSSA). Cette procédure a permis de mesurer le degré d’association entre les champs de pression et de précipitation. L’existence de périodes communes aux deux champs a rendu possible non seulement la confirmation de la signification physique de ces oscillations, mais aussi l’identification de dynamiques d’évolution du système océan-atmosphère de l’atlantique nord. Deux oscillations statistiquement significatives, communes aux champs de précipitation et de pression et de périodes d’environ 5,3 ans et 8 ans, ont été isolées. L’oscillation de 8 ans commune aux deux champs climatiques est la plus significative et la plus sûre. Elle présente une configuration classique de NAO, avec une variation en opposition de phase entre le nord et le sud de L’Europe. En outre, elle est caractérisée par une propagation vers l’Ouest du signal climatique et par une parfaite opposition de phase entre le champ de précipitation et le champ de pression. Elle est également très significative dans la Péninsule ibérique et est associée aux hivers secs et aux hivers pluvieux, dont la séquence a été identifiée au XXème siècle. L’oscillation de 5,3 ans est liée au modèle de L’Atlantique Est (East Atlantic Pattern), qui se traduit par une autre structure dipolaire en opposition de phase entre le SW et le NW de L’Europe. La régularité de l’oscillation de 8 ans permet d’anticiper facilement et avec un certain degré de certitude l’apparition d’années sèches et d’années humides, en rendant ainsi possible une meilleure gestion des ressources hydriques.
Mots clés: Signal climatique, MSSA, Précipitation, Pression au niveau de la mer, Oscillations, Europe
I. INTRODUCTION
The aim of this study is to analyse interanual rainfall variability in terms of the spatial-temporal structures of oscillatory components of precipitation over Europe. Winter (DJF) rainfall standardized anomalies over Europe are analysed for interanual variability over the time interval 1900-1998, by means of Multi-Channel singular spectrum analysis (MSSA). The same procedure was applied to the sea Level Pressure (SLP) field over the North Atlantic for the same period of time, thus the main modes of winter rainfall variability in Europe can be related to the same frequencies of variation in the SLP field over the North Atlantic region.
Precipitation is one of the most important climatic variables and also one of the most difficult to predict. The study of periodic or quasi-periodic components is important because they are easier to predict, especially on an interannual time scale. Interannual variability gives better results than seasonal prediction. In the case of the latter, statistical results are less robust.
As Qian et al. (2000) have pointed out, the investigation of spatial structures and temporal propagation of oscillations in precipitation fields over Europe is almost absent despite a well established influence on regional and global climate through the modulation of low-frequency modes such the Quasi-Biennial Oscillation (QBO), the el Niño-southern Oscillation (ENSO) and the North Atlantic Oscillation (NAO).
Previous studies have identified some oscillatory components in Europe and the North Atlantic. Alcoforado et al. (2000) found that for the Later Maunder Minimum (LLM) period, the precipitation variability was similar to that of present times. Periods of drought are usually followed by periods of abundant rainfall. The most important and recognized in a number of papers is the ~8-year oscillation, however the spatial-temporal structure of this oscillation was only analysed by Moron et al. (1998), who used merely the sea-surface temperature over the North Atlantic. Corte-Real et al. (1998) also identified this oscillation using the precipitation time-series in Évora (Portugal). Gomes (2001) found this same periodic component in winter (DJF) using both the precipitation time-series of Lisbon, Madrid and Gibraltar and the NAO index. These were found to be in an almost perfect out-of-phase relationship, especially in Lisbon. Gomes (2006) recognized the importance of this periodic component in the winter (DJF) precipitation variability, especially over South-Western Iberia.
The 8-year periodic component is often associated with the NAO variability (Corte-Real et al., 1998, Hurrel et al., 2003). The power spectra of the winter NAO time series, reveals variance peaks at the quasi-biennial and quasi-decadal periods (Hurrel et al., 2003). The variance of the quasi-biennial oscillation was found to be enhanced in the later 19th and early 20th century while the variance of the quasi-decadal component was greater during the second part of the 20th century (Hurrel et al., 2003). These changes in variance, namely for the quasi-decadal oscillation, are also detected in the Lisbon winter precipitation time-series (Gomes, 2001 and 2006).
Trigo et al. (2004) studied the relationship between the NAO and the regimes of the Iberian rivers and the consequent economic impact on hydropower. They discovered a close relationship between the variability of the NAO and the flow of the major Iberian rivers. In addition to this, the positive trend in NAO index observed in the second half of the twentieth century was found to be associated with a negative trend in river flows
This paper’s focus is on determining the importance of the quasi-decadal space-time variability of the precipitation time series and it’s relationship to the SLP field and the NAO variability in Europe and the Iberian Peninsula.
This paper is organized as follows: data and methods are presented in section 2 and the main results in section 3. section 3 a) is dedicated to the results obtained in the empirical Orthogonal function (EOF) analysis and Monte Carlo singular spectrum analysis (MC-SSA) and Multi taper Method (MTM) on the space Principal Components (s -PC). In sections 3 b) and 3 c) the results of the Multi Channel singular spectrum analysis (MSSA) are presented. The actual assessment is preceded by a thorough examination of the statistical significance of spectral peaks, that is, by checking whether they are statistically significant before investigating their physical meaning. For this reason some tests are performed at different resolutions and using different analysis methods. Section 4 analyses the case of recent droughts and the wettest years of the Iberian Peninsula, and their relationship to the quasi-decadal variability of the NAO.
II. DATA AND STRATEGY
Two gridded data sets were used in the analysis: the northern Hemisphere Monthly sea-Level Pressure Grids, which start from 1899, provided by the national Centre for atmospheric research (NCAR) (Trenberth and Paolino Jr., 1980) and the ‘gu23wld0098.dat’ (version 1.0) historical monthly precipitation dataset for global land areas, provided by the Climatic research Unit (CRU) (Hulme, 1992; Hulme, 1994; Hulme et al., 1998). The SLP file, produced at NCAR, was constructed first on a daily scale. The monthly averages have a resolution of 5° x 5° and cover the northern hemisphere only. In total, the data network consists of monthly maps with 72 points in longitude and 15 points in latitude. The main advantage of this file over the other previously described, lies in the temporal coverage as it spans the period from 1899 to the present day. Data were extracted for the period of time between 1899 and 2000, and for the North Atlantic region and Europe. This not only provides information over a significant length of time (not available in the reanalysis data of national Center for atmospheric research (NCAR) / national Centers for environmental Prediction (nCeP) but also provides relatively updated information (unlike the pressure data from the UKMO).
The precipitation file consists of a global gridded data file limited to mainland areas, constructed, maintained and organized by the CRU (Hulme, 1992; Hulme, 1994; Hulme et al., 1998). The resolution is 2.5 Lat. x 3.75 Long. And spans the period between 1900 and 1998. The precipitation values are monthly totals, and each grid-point value is calculated as the balance of all weather stations encompassed within each square corresponding to the resolution indicated. In the interpolation process of the global network of 11,880 weather stations, almost all secular records were taken into account.
For the SLP and precipitation data, only grid cells with less than 5% of missing values were retained for analysis. The next step was to compute seasonal averages and seasonal totals for winter (December, January and February) for both fields. Data were standardized with zero mean and unit variance and missing values were replaced by zero. Other replacing methods were tested to see if the results changed, namely filling gaps with “white noise”. Results were found not to change in both the number of principal components to retain, and in the spatial/temporal structure of the main modes of variability of the precipitation and SLP fields.
In a first step, two separate empirical Orthogonal function (EOF) analyses were performed on the normalized seasonal precipitation and SLP fields, in order to extract the dominant spatial-temporal modes. This procedure allows for a compression and condensation of a huge quantity of information into a small number of variables, which are able to capture the maximum proportion of initial variance. The leading Principal Components (PC’s) are then used as channels for three subsequent MSSA with embedding dimensions (m) of 20, 25 and 30 to test the robustness of the periodic signals. The channels are first examined individually using Multi taper Method (MTM) and Monte Carlo singular spectrum analysis (MCSSA) to assess the level of significance of the spectral peaks. Both tests are performed against a red noise null hypothesis at the 90%, 95% and 99% confidence levels. Technical details on MC-SSA, MTM am MSSA could be found in Plaut and Vautard (1994), Allen and Smith (1996), Moron et al. (1998) Ghil et al. (2002).
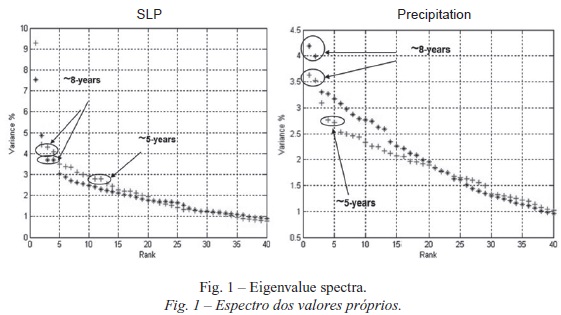
The first step in a MSSA analysis is the identification of the oscillatory components. In order to do this, the methodology of Plaut and Vautard (1994) was adopted. Firstly, a search was made for nearly equal eigenvalues, on the eigenvalue spectra (fig. 1 and 2), whose corresponding ST-EOF’S had to be nearly periodic, with the same period and in phase quadrature as can be seen in fig. 3 (Plaut and Vautard, 1994). The associated st- PC’s were also in quadrature.
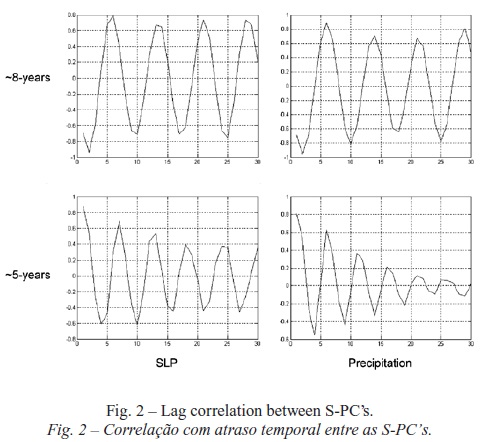
Secondly, the lag correlation between two consecutive ST-PC’S has itself an oscillatory behaviour and is a sine function. The maximum cross correlation between a pair of ST-PC’S must be statistically significant, and the lag at which the maximum correlation occurs is approximately one quarter of the oscillation period (fig. 2 – ). MC-SSA and MTM analyses were performed on the Channels (S-PC’S) as additional tests and were taken into account for the MSSA analysis.
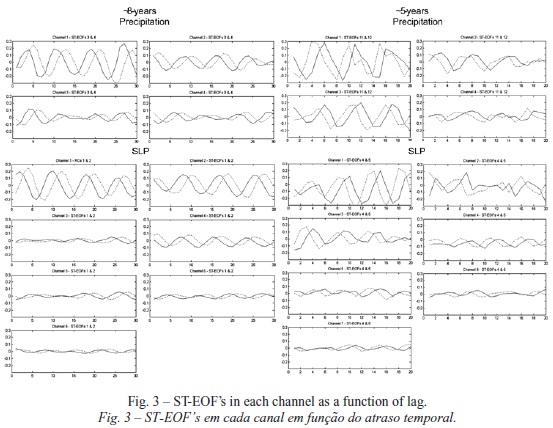
The space-time EOF’s (ST-EOF’S) can be presented both in lag and physical space. In the lag space the paired ST-EOF’S are displayed for each channel as a function of the lag (fig. 3).
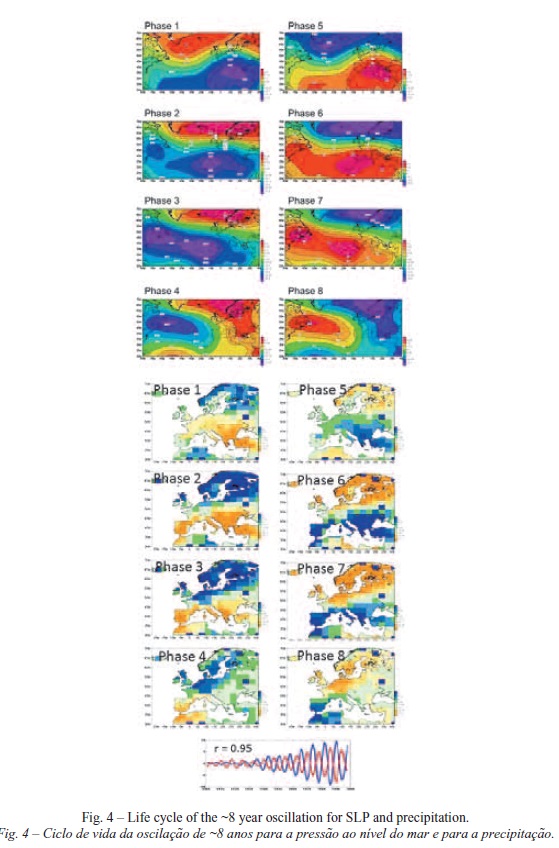
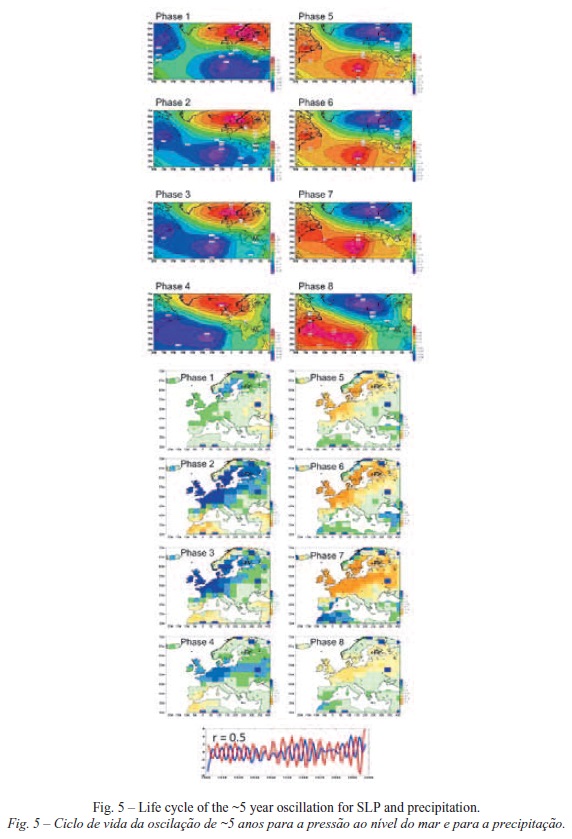
ST-EOF’S in physical space (fig. 4) are displayed as a sequence of maps using reconstruction and composite techniques based on Moron et al. (1998). Figure 4 was constructed in this manner. An additional analysis was made on the ~8-year oscillation, with a composite analysis on the raw precipitation and SLP anomalies.
The spatial distribution of amplitudes of this oscillation are depicted on composite maps of precipitation and SLP difference between extreme high (low) phases during an oscillation spell and the extreme high (low) phases on the first decades of the century, where this oscillation has relatively low amplitude. T-testing is used to reveal geographical regions where anomalies are statistically significant (fig. 5 and 6). Some of the programs used here were the Matlab algorithms for MSSA written by Eric Breitemberger from the Geophysical institute (University of Alatska). The SSA-MTM toolkit (Ghil et al., 2002, Dettinger et al., 1995) was used to compute MC-SSA and MTM.
III. RESULTS
1. Main spatiotemporal modes of SLP in the North Atlantic and precipitation in Europe
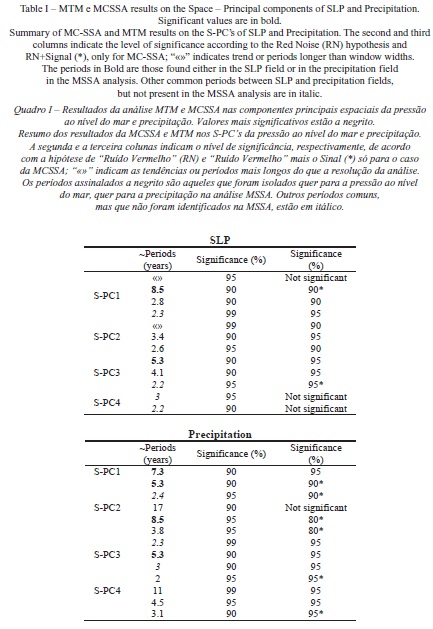
An EOF analysis was performed on the normalized seasonal precipitation and SLP fields, in order to extract the main dominant spatial-temporal modes. seven leading space principal components (S-PC’S), explaining 56.2% of total variance of the precipitation fields, and four PC’s explaining 70.1% of total variance in the case of the SLP fields are retained for subsequent MSSA. The 1st s -EOF of SLP (34.5%) and the 3rd (11.8%) are the easiest to identify as the typical NAO pattern (Wallace and Gutzler, 1981) and the eastern Atlantic Pattern, respectively. The 2nd (13.1%) and the 4th (10.6%) are more difficult to interpret (Table I).
The explained variance for the precipitation field is much lower than that of the SLP field, since the former is more easily influenced by local factors than the latter, which translates into a more complex spatial-temporal variability. The choice of modes to retain obeyed a criterion of visual inspection of the eigenvalues graph. The point from which the eigenvalues decrease gradually without sudden breaks is the point from where the corresponding modes are excluded from the analysis. To test the robustness of the results, other tests were made with cuts elsewhere, taking into account a different number of modes. The results did not significantly improve the analysis. for example, when additional modes were taken into account (in particular for precipitation), an increase of “noise” is confirmed, which is attested by an increased complexity of the analysis: less explained variance on the main modes and having to take into account modes of spatial and temporal variability that were difficult to explain or had no physical meaning.
For the precipitation field, S-EOF1 (17.1%) and s -EOF2 (15.5%) represent an out-of-phase variability between northern and southern Europe. These show similar patterns to those of SLP S-EOF1 & s -EOF3. These could also be obtained by using an sVD analysis between SLP and Precipitation (not shown). s -EOF3 (7.6%) and s -EOF4 (5.7%) represent longitudinal contrasts. s -EOF3 reflects an opposite variability between eastern and Western Europe, whilst s -EOF4 shows that precipitation variability in Central Europe can be out-of-phase with those to the west and to the east. Hence, the most important spatial modes reflect mostly latitudinal contrasts (Qian et al., 2000). The s -EOF’s of seasonal precipitation are in close agreement to those in Qian et al., (2000) despite the fact that these authors analysed the non-seasonal variability of monthly precipitation instead of the seasonal values here examined.
The s -PC (channels) are examined individually using Multi taper Method (MTM) and Monte Carlo singular spectrum analysis (MC-SSA). Here these two tests are used to assess the robustness of the analysis: if the same spectral peak is isolated in both tests this improves the chances significant signals are being found.
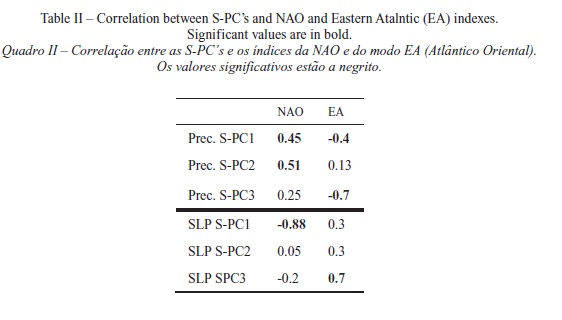
The spectral analysis on the S-PC’S reveals that results in MC-SSA are less statistically significant and that the level of significance of the spectral peaks is generally lower. a period of 8 years is detected in SLP S-PC1 and precipitation S-PC1 and S-PC2. a period of 5.3-years appears in SLP S-PC3 and precipitation S-PC1 and S-PC3. Other periods between 2 and 2.4 years are detected both in SLP and precipitation S-PC’S. In table II correlations between S-PC’S and both NAO and eastern Atlantic indexes are presented. The NAO has significant correlations with SLP S-PC1 and precipitation S-PC1 & S-PC2. The eastern Atlantic Pattern has significant correlations with SLP S-PC3 and Precipitation S-PC1 and S-PC3. It seems that the ~8-year oscillation is related to the NAO, which is in agreement with the findings of Moron et al., (1998) and Gomes (2001). The ~5-year oscillation is probably linked to the eastern Atlantic Pattern, although this relationship is not very clear.
2. Patterns in space/Time
The 7 S-PC’S of precipitation and 4 S-PC’S of SLP were subjected to MSSA using embedding dimensions of 20, 25 and 30 years to better assess the level of significance (fig. 1).
In figure 2 the eigenvalue spectra is displayed (for SLP and Precipitation) only for m=20 and m=30 up to order 40.
As usual statistical significance is greater with low values of m. this is without doubt more evident up to order 20, especially for precipitation. The search for potential oscillatory pairs begins with the identification of nearly equal eigenvalues. In figure 2 only those pairs with similar periods in both SLP and precipitation are retained for further analysis. The ~8-year cycle is represented by MSSA components 3&4 for SLP, and MSSA components 1&2 for precipitation (with m=20, m=25 and m=30). The ~5-year oscillation is represented by MSSA components 11&12 (m=20) and 16&17 (m=30) for the SLP field, and MSSA components 4&5 (m=20 and m=30) for precipitation. Clearly, the 8-year oscillation is more robust and statistically significant. The 5-year oscillation is best captured with m=20.
In order to select significant oscillatory pairs, the criterion based on the lag-correlation between two consecutive ST-PC’S was adopted (fig. 3).
The maximum cross-correlation between the consecutive ST-PC’S is statistically significant, and the lag at the maximum correlation is approximate to one quarter of the identified oscillation period. Moreover, the correlation has itself an oscillatory behaviour and is a sine function. Following Plaut and Vautard (1994) the lag correlation for all oscillatory pairs in figure 2, remains close to a sine function for more than one period.
ST-EOF’S (SLP 3&4 and 11&12; and Precipitation 1&2 and 4&5) are displayed in each channel as a function of lag, and each channel is associated with one space-EOF (fig. 4). In the case of the quasi-decadal oscillation the correlation remains high with increasing period. However the same cannot be said for the ~5 year oscillation in which the values progressively decrease with increasing number of periods taken into account, particularly in the case of the precipitation field. As already noted, in this case, results are always less statistically significant due to the greater influence of local factors. Still, in the case of quasi-decadal oscillation, the correlation values are always high and significant, even taking into account several periods ahead.
The phase quadrature is evident in each case, but it is striking in the case of the ~8-year oscillation. In this case the period is identical in all channels, so it reflects the spatial coherence detected at this period (Plaut and Vautard, 1994). This feature is not so evident in the case of the ~5-year oscillation. In the ~8-year oscillation the amplitude is largest in EOF’s 1&2 for precipitation, and the first EOF for SLP. These are the s -EOF’s related to the NAO Pattern (table II).
In the case of the ~5-year oscillation the amplitude is largest in s -EOF’s 1&3, for both the SLP and precipitation fields. These are s -EOF’s associated with the eastern Atlantic Pattern, with the exception of SLP S-EOF1. Both oscillations reveal non-zero components on the other channels, and phase shifts between channels. Thus we can expect two propagating space-time patterns.
3. Analysis of the most significant oscillation in physical space
3.1 The ~8-year oscillation
The most significant spatial signal is an out-of-phase variability between northern and southern Europe (in the case of precipitation) and in northern and southern North Atlantic (in the case of SLP), which shows a typical NAO seesaw pattern, especially in phases 2 and 6. In both SLP and precipitation, the anomalies seem to have a westward propagation, especially in the southern part of the domain. This means that, for example, drought episodes tend to be recorded further east in domain that then migrate to the western regions. So if a drought occurred in Greece it is likely to be reported later on in the Iberian Peninsula. The same reasoning can be applied to the abnormally wet years. In Phases 2 and 5 all southern Europe seems to be in phase. The NAO signal becomes stronger, which is translated into an out-of-phase variability between northern and southern Europe. The time-series used to compute the phase composites are plotted bellow. The out-of-phase variability is almost perfect between SLP and precipitation (fig. 5).
3.2 The ~5-year oscillation
The 5-year oscillation is characterized by another dipole structure in SLP positioned slightly to the southeast of the previously mentioned oscillation, with high amplitude values located in Western Europe and the eastern Atlantic. It seems to propagate to the southwest. The spatial signal of this oscillation in the precipitation field again shows an out-of-phase variability, this time between northern / Central Europe and the southern Europe / Mediterranean region, especially in phases 2, 3, 6 and 7. In this case the out-of-phase variability is displaced southward relatively to the ~8-year oscillation. The time-series are shown below. The out-of-phase variability between SLP and precipitation is less statistically significant comparatively to the ~8-year oscillation (fig. 6).
IV. THE ~8 YEAR OSCILLATION AND THE OCCURRENCE OF RAINY AND DRY WINTERS IN THE IBERIAN PENINSULA
The ~8 year oscillation is a key element in explaining the precipitation variability in winter over the Iberian Peninsula, as well as over Europe (Corte-Real et al., 1998, serrano et al., 1999, Morala et al., 2003, Quian et al., 2000, tildes Gomes, 2001 and 2006). this NAO-related oscillation is very significant especially in the southwest of iberia. Gallego et al. (2005) found a close relationship on a daily scale between variability of the NAO and precipitation over the Iberian Peninsula, over the western, the south-western and the interior regions of the Iberian Peninsula.
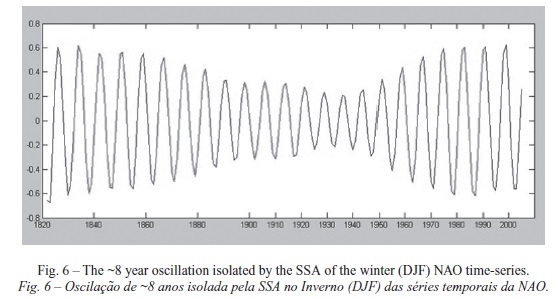
Using a very simple graphical visualization of the 8-year oscillation, isolated by using either the SLP field or the NAO index, one can identify periods of drought and periods with above normal precipitation. Let us consider, for example, the ~8 year oscillation isolated by means of the SSA of the winter (DJF) NAO time-series (fig. 7).
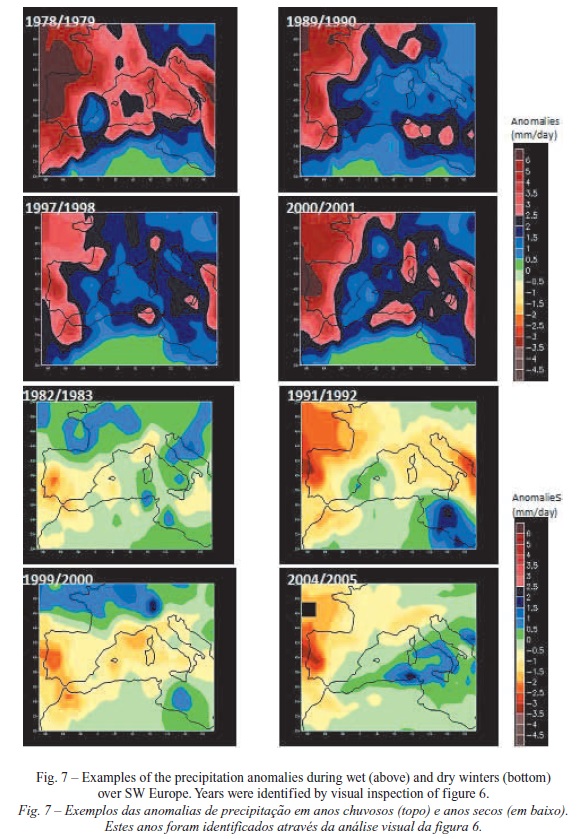
Since the NAO index varies with an out-of-phase relationship with precipitation, one could expect that years with the highest (lowest) index are those with negative (positive) precipitation anomalies. thus periods with the highest and lowest values of the index coincide with extreme events regarding precipitation. The NAO variability is thus a good predictor for precipitation variability over the Iberian Peninsula. Presented in figure 7 are some examples of these periods over the last three decades.
Based on the reconstruction of the 8-year oscillation extracted from the NAO time-series, winters with above normal precipitation (low indices in the reconstruction in figure 6), and winters with below normal precipitation values, can be easily identified. In both cases (dry and wet winters), it is possible to isolate extreme events related to precipitation. The analysis reveals that in the case of below normal precipitation values, major drought episodes were found to occur, some of which were very intense. Cases in point were the droughts periods of the early 80’s and 90’0s, as well as the last drought period occurring in 2004/05. The latter was analysed by Garcia-Herrera et al. (2006), who associated this drought period to positive NAO indices occurring from November to January while in February NAO indices were low. The eastern Atlantic climate indices were also analysed by these authors who found that, for the winter in question, positive values of NAO and the EA were in phase.
The spatial patterns of wet and dry winters have some similarities. For years with precipitation levels above and below average, the highest anomalies generally occur over Portuguese territory. It follows that these extreme events, isolated by the reconstruction of the 8-year oscillation of the NAO time-series, have greater impact over Portugal. This is explained by the strong influence of the NAO on precipitation variability in Portugal, especially in southern Portugal and Andalucía (Spain). On the other hand, spatial patterns in wet winters show more clearly the typical NW/SE contrast over the Iberian Peninsula. It seems very clear that in drought periods during these particular decades, northern Portugal is less affected. The ability to forecast taking into account the variability of the NAO is improved in the south and southwest of the peninsula, particularly for the negative phases of NAO, i.e., for years associated with higher values of precipitation. These findings are in agreement with those made by Corte-Real et al. (2005). The authors found that the cyclonic regime is related to the negative phases of the NAO with greatest relevance in the southern regions, where the correlation of precipitation with the NAO reaches the highest negative values.
V. DISCUSSION AND CONCLUSIONS
Two common oscillations between SLP and precipitation fields were isolated: a ~8-year oscillation related to the NAO, and a ~5-year oscillation that could be related to the eastern Atlantic Pattern.
The analysis shows that the most important spatial-temporal modes reflect mostly latitudinal contrasts: dipoles structures in SLP and an out-of-phase variability between the northern and southern regions of the European domain in the case of precipitation field. For the ~5-year oscillation, the highest amplitudes are located to the south of the ~8-year oscillation, reflecting a latitudinal contrast located more to the south-west of Europe.
There is also a good agreement in the spatial-temporal patterns of the two oscillations between the SLP and the precipitation fields, reflecting the out-of-phase variability between SLP and precipitation.
The ~8-year oscillation modulates winter precipitation variability over the Iberian Peninsula. It explains all the extreme events occurring in the last decades regarding droughts and floods, with greater significance in the southwest region. This oscillation could easily be related to the NAO (fig. 5). The causes for the ~5-year oscillation are not as easy to identify (as seen in figure 3 and tables I and II), despite the fact that this period could be found in the eastern Atlantic index (fig. 5).
Perhaps one of the most interesting features in the ~8-year oscillation is an increase in its amplitude over the second half of the 20th century. this increase was confirmed by the increase of over 20% of the values of local variance in the last two decades. These increases are found in both the SLP and precipitation fields. It should be stressed that the percentages of total variance are 7.4% and 7.2% for SLP and precipitation, respectively (fig. 2 – ) and, consequently, the values reached in the last decades of the 20th century are clearly higher. to test if this increase in amplitude in the ~8-year oscillation produced any significantly different anomalies on the SLP and precipitation fields, composite averages of SLP and precipitation were calculated: the extremes (both high and low) of the second half of the 20th century were compared against the extremes (again, both high and low) of the first half. Regions where the differences between composites were statistically significant at the 90% confidence level were identified (according to the student t-test). High amplitude spells in precipitation are characterized, in the extreme high phases, by an increase of precipitation over north-western Europe and the north of the Iberian Peninsula. In the extreme low phases, precipitation anomalies are higher during high amplitude spells over northern Europe and the northwest of the Iberian Peninsula and significantly lower in central Mediterranean region.
Another important feature in the ~8-year oscillation is the observed periodicity over time of the wet and dry periods in Iberia. For this reason it is possible to predict, with a degree of certainty, periods of drought and periods of abundant rainfall by graphical examination of the oscillation over time alone. It is easy to extrapolate to the nearest future and to have a very good idea of when, for example, a drought period will occur. Some care should be exerted since the climate system has not evolved in a deterministic way. However, multi-annual fluctuations, in particular the low frequency ones, are more effective in predicting climate at a medium to long-term range, and these predictions have proven to be more reliable than, for example, attempts that have been made at short-term forecasting, including seasonal forecasts. At present it is not yet possible to predict the exact year of occurrence of a drought or abnormally wet year, however, some hypotheses were formulated about future research on this topic. Any future research in the field of forecasting will have to take into account the quasi-decadal variability of the NAO, in particular the oscillation with periods of about 8 to 10 years. this is a crucial climate issue for this region as water is one the most important resources and water resource management would be hugely facilitated with the possibility of drought prediction.
ACKNOWLEDGEMENTS
The author wishes to thank the reviewers for helping to improve the manuscript with their useful comments.
BIBLIOGRAFIA
Alcoforado, M.J.; Nunes, M. F.; Garcia, J. C.; Taborda, J. P. (2000) – Temperature and Precipitation Reconstruction in southern Portugal during the Late Maunder Minimum (1675-1715). The Holocene, 10 (3): 333-340. [ Links ]
Allen, M.R. and Smith, L.A. (1996) – Monte Carlo SSA: Detecting irregular oscillations in the presence of colored noise. Journal of Climate, 9: 3373-3404 [ Links ]
Corte-Real, J., Qian, B., Xu, H., (1998) - Regional climate change in Portugal: Precipitation variability associated with large-scale atmospheric circulation. International Journal of Climatology, 18: 619-635. [ Links ]
Gomes, P. T. (2001) – Relationships between Iberian rainfall variability and the North Atlantic Oscillation. In M. Brunet India and D. López Bonilo (editors), Detecting and modeling regional climate change, Springer Verlag: 377-387. [ Links ]
Gomes, P. T. (2006) – Modos de variabilidade da precipitação na Península Ibérica: teleconexões atmosféricas e oceânicas. Tese de Doutoramento em Geografia Física, Universidade de Lisboa, 711pp. [ Links ]
Ghil, M.; Allen. M.R.; Dettinger, M.D.; Ide, K.; Kondrashov, D.; Mann, M.E.; Robertson, A.W.; Saunders, A.; Tian, Y.; Varadi, F.; Yiou, P. (2002) - Advanced Spectral Methods for climatic time series. Reviews of Geophysics, 40 (1): 1-41. [ Links ]
Gallego, M. C.; García1, J. A.; Vaquero J. M. (2005) - The NAO signal in daily rainfall series over the Iberian Peninsula. Climate Research: 29: 103–109. [ Links ]
Garcia-Herrera, R.; Paredes, D.; Trigo, R.M.; Trigo,I.F.; Hernández, E.; Barriopedro, D.; Mendes,M.A. (2006) - The Outstanding 2004/05 Drought in the Iberian Peninsula: Associated Atmospheric Circulation. Journal Of Hydrometeorology, 8: 843-498 [ Links ]
Hulme, M. (1992) - A 1951-80 global land precipitation climatology for the evaluation of General Circulation Models. Climate Dynamics, 7: 57-72 [ Links ]
Hulme, M. (1994) - Validation of large-scale precipitation fields in General Circulation Models pp.387-406, in Global precipitations and climate change (eds.) Desbois, M. and Desalmand, F., NATO ASI Series, Springer-Verlag, Berlin, 466pp. [ Links ]
Hulme,M., Osborn,T.J. and T.C.Johns (1998) - Precipitation sensitivity to globalwarming: Comparison of observations with HadCM2 simulations. Geophys.Res. Letts., 25: 3379-3382. [ Links ]
Hurrel, J.W; Kushnir, Y.; Ottersen, G.; Visbeck, M. (2003) – An overview of the North Atlantic Oscillation. In James W. Hurrel, Yochanan Kushnir, Geir Ottersen, and Martin Visbeck (editors), The North Atlantic Oscillation: climatic significance and environmental impact, American Geophysical Union: 1-35.
Morala, L.; Serrano, A.; Garcia, J.A. (2003) – Detecting quasi-oscillations in the monthly precipitation regimes of the Iberian Peninsula. Annales Geophysicae, 21: 819-832. [ Links ]
Moron, V.; Vautard, R.; Ghil, M. (1998) – Trends, interdecadal and interanual oscillations in global sea-surface temperatures. Climate Dynamics, 14: 545-569. [ Links ]
Plaut, G. and Vautard, R. (1994) – Spells of low-frequency oscillations and weather regimes in the northern hemisphere. Journal of the Atmospheric Sciences, 51: 210-236 [ Links ]
Qian, B.; Xu, H.; Corte-Real, J. (2000) – Spatial-temporal structures of quasi-periodic oscillations in precipitation over Europe. International Journal of Cliamtology, 20, 1583-1598. [ Links ]
Serrano, A.; Garcia, J.A.; Mateos, V.L.; Cancillo, M.L.; Garrido, J. (1999) – Monthly modes of variation of precipitation over the Iberian Península. Journal of Climate, 12: 2894-2919. [ Links ]
Trenberth, K.E.; Paolino Jr., D.A. (1980) – The Northern Hemisphere sea-level pressure data set: Trends, errors and discontinuities. Monthly Weather Review, 180: 855-872. [ Links ]
Trigo, R.M. ; Pozo-Vázquez, D.; Osborn, T. J.; Castro-Díez, Y.; Gámiz-Fortis, S.; Esteban-Parra, M. J. (2004) - North Atlantic oscillation influence on precipitation, river flow and water resources in the Iberian Peninsula. International Journal of Climatology, 24: 925-944. [ Links ]
Wallace, J.M.; Gutzler, D.S. (1981) – Teleconnections in the Geopotential Height Field during the Northern Hemisphere Winter. Monthly Weather Review, 109: 784-812 [ Links ]
Recebido: Janeiro, 2010. Aceite: Fevereiro, 2011.

