


Serviços Personalizados
Journal

Artigo
 Inglês (pdf)
 Artigo em XML
 Referências do artigo
 Enviar este artigo por email
Indicadores
 Citado por SciELO
 Links relacionados
 Similares em
SciELO
Similares em
SciELO Compartilhar

 Permalink
Finisterra - Revista Portuguesa de Geografia
versão impressa ISSN 0430-5027
Finisterra no.98 Lisboa dez. 2014
ARTIGO ORIGINAL
Application and comparison of UTCI and PET in temperate climate conditions
Aplicação e comparação dos índices UTCI e PET em regiões de clima temperado
Andreas Matzarakis1 Stefan Muthers2 Frank Rutz3
1 Albert-Ludwigs-University Freiburg. D-79085 Freiburg. E-mail: matzarak@uni-Freiburg.de
2 University of Bern. Climate and environmental Physics. Sidlerstrasse 5. CH-3012 Bern. E-mail: muthers@climate.unibe.ch
3 Fraunhofer-institut für angewandte festkörperphysik. Tullastraße 72. D-79108 Freiburg. E-mail: frank.rutz@iaf.fraunhofer.de
ABSTRACT
The assessment of the thermal bioclimate is based on the human energy balance and derived indices such as Physiologically equivalent temperature (PET) or Universal thermal Climate index (UTCI). these two indices were compared over a period of ten year based on hourly data in a middle European city with a temperate climate. The analysis performed shows that the differences obtained result from the different thermophysiological settings of clothing insulation. For conditions with extremely high vapour pressure values, UTCI yields higher values than PET, which could describe the thermophysiological stress more appropriately.
Keywords: Physiologically equivalent temperature (PET), Universal thermal Climate index (UTCI), temperate climate, bioclimate, Freiburg (Germany).
RESUMO
A avaliação do bioclima térmico é baseada no balanço de energia humano e índices derivados, tais como a temperatura equivalente fisiológica (PET) ou o í ndice térmico universal (UTCI). Estes dois índices são comparados numa cidade média de clima temperado (Freiburg, na Alemanha), a partir de dados horários, num período de dez anos. A análise mostra que as diferenças obtidas resultam da eficácia da modelização termo-fisiológica do isolamento do vestuário, a qual pode variar. Em condições de muito forte humidade, o UTCI apresenta valores mais elevados do que o PET, sendo este índice o que melhor descreve o stress termo-fisiológico naquelas condi ções.
Palavras-chave: Temperatura fisiológica equivalente (PET), índice térmico Universal (UTCI), clima temperado, bioclima, Freiburg (Alemanha).
RESUME
Application et comparaison des indices PET et UTCI en Milieu tempéré . La détermination du bioclimat thermique est basée sur l’équilibre énergétique humain et sur des indices d érivés, tels que la température équivalente physiologique (PET) ou l’indice universel de climat thermique (UTCI). On a compar é ces deux indices pendant 10 années, à partir de données horaires recueillies dans une ville européenne au climat temp éré (Freiburg, en Allemagne). On en conclut que les différences enregistrées résultent de l’inégale efficacit é de la modélisation thermo-physiologique de l’isolation par les vêtements. en conditions de très forte humidité, UTCI donne des valeurs plus élevées que PET et c’est ce second indice qui paraît décrire le mieux les cas de stress thermo-physiologiques dans ces conditions-là.
Mots-clés: Température equivalente Physiologique (PET), indice Universel de Climat thermique (UTCI), climat tempéré, bioclimat, Freiburg (Allemagne).
I. INTRODUCTION
One of the most often used thermal indices in the last twenty years is the physiologically equivalent temperature (PET) (Mayer and Höppe, 1987; Höppe, 1999; Matzarakis et al., 1999). PET is an index for the assessment of the changes in human thermal comfort. It is defined “as the air temperature at which, in a typical indoor setting (without wind and solar radiation), the energy budget of the human body is balanced with the same core and skin temperature as under the complex outdoor conditions to be assessed” (Höppe, 1999; Mayer and Höppe, 1987; Matzarakis et al., 1999). the reason of the broad and wide use is the possibilities of easy computing PET‘s values through the rayMan model (Matzarakis et al., 2007, 2010). The range of PET studies cover global to local and micro scale (Matzarakis, 2006; Matzarakis and Amelung, 2008; Andrade and Alcoforado, 2008; Gulyas et al., 2006, Lin et al., 2010). Rayman requires standard meteorological data from synoptic or climate stations and is easy to apply (Matzarakis et al., 2007, 2010).
A more recent thermal index is the Universal thermal Climate index (UTCI, www.UTCI.org , Jendritzky et al., 2012) developed under the frame work of the international society on Biometeorology (ISB) and the COst action 730 (Cooperation in science and technical Development, supported by the EU RTD framework Program) (Jendritzky et al., 2010, 2012). The aim was to produce an international standard index, based on scientific progress in thermo-physiological modeling of human response to meteorological conditions including the acclimatization issue. The word “ universal” is appropriate for all assessments of the outdoor thermal conditions in the major human biometeorological fields (Jendritzky et al., 2010). UTCI was then developed following the concept of an equivalent temperature. This involved the definition of a reference environment with 50% relative humidity (but with vapour pressure not exceeding 20 hPa), with calm air and radiant temperature equalling air temperature, to which all other climatic conditions are compared. Equal physiological conditions are based on the equivalence of the dynamic physiological response predicted by the model for the actual and the reference environment. As this dynamic response is multidimensional (body core temperature, sweat rate, skin wetness etc. at different exposure times), a strain index was calculated by principal component analysis as a single dimensional representation of the model response. The UTCI equivalent temperature follows the concepts of former thermal indices (i.e. PET), for a given combination of wind, radiation, humidity and air temperature. it is then defined as the air temperature of the reference environment outdoors, which produces the same strain index value indoors. UTCI has been included in the rayMan model (Matzarakis et al., 2007, 2010) and can be used for the UTCI standard conditions (www.UTCI.org ).
The objective of this paper is to show the pattern of both indices in a high temporal resolution and in a mild climate location. it is based on hourly data for a period of ten years. the case study is the city of Freiburg, Germany, which has a temperate climate (Cfb, according to Köppen-Geiger classification). It rains all the year round, although the total rainfall is only 887mm. the warmest month of the year is July with an average temperature of 19.6º C, and the coldest is January with an average temperature of 1.4º C (http://en.climate-data.org/location/2134/, accessed June 30th 2014).
II. DATA AND METHODS
Modern human biometeorological methods use the energy balance of the human body (Höppe, 1993, 1999) in order to extract thermal indices and describe the effects of the thermal environment on humans (Mayer, 1993; VDI, 1998). for this purpose, hourly measurements of air temperature, air humidity, wind speed and global radiation for a period of over ten years (1.9.1999 to 30.4.2010) from the urban climate station of the Chair of Meteorology and Climatology, Albert-Ludwigs University of Freiburg have been used (Matzarakis and Mayer, 2008) in order to calculate the mean radiant temperature, PET and UTCI.
PET and UTCI which are based on the human energy balance and describe the effects of the meteorological conditions (short and long wave radiation, air temperature, air humidity, and wind speed) and of thermo-physiological conditions (clothing and activity) on humans are applied. The specific categories for assessment of thermal stress and thermal comfort are given in table I. the simulations have been performed by the use of the rayMan model, which is able to transfer the global radiation from an area with free horizon to urban structures (Matzarakis et al., 2007, 2010).

Both indices are compared and categorized according thermal stress values. PET classification is made according Matzarakis and Mayer (1996) and UTCI is explained in the site www.UTCI.org.
The input parameters have to be measured at 1.1 m high, which is the height of the gravity centre of the human body, except wind speed data that has to be collected at a height of 10 m above ground. This means there is a separation in the height of the input parameters when calculating UTCI. In addition the main difference between PET and UTCI is that PET always uses standard clothing (clo = 0.9) and UTCI adjusts clothing based on the existing specific conditions outdoors (Jendritky et al., 2012). the latter is based on a) typical dressing behaviour in different temperatures, as observed in the field, resulting in a model of the distribution of clothing over the different body segments in relation to the ambient temperature, b) the changes in clothing insulation and vapour resistance caused by wind and body movement and c) the change in wind speed in relation to the height above ground. The outcome of the clothing model defines in detail the effective clothing insulation and vapour resistance for each of the thermophysiological model’s body segments over a wide range of climatic conditions (Havenith et al., 2012).
III. RESULTS
The results are presented as follows:
(i) Class diagrams for UTCI and PET constructed in order to compare different kinds of results; (ii) Beanplots (Kampstra, 2008; Muthers and Matzarakis, 2010) in order to visualize the distribution and the shape of the results for annual and seasonal conditions; (iii) analysis of percentiles for the comparison of the relationship between the two thermal indices used.
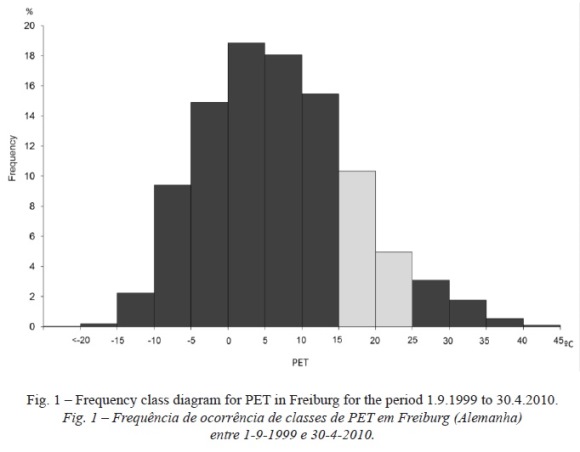
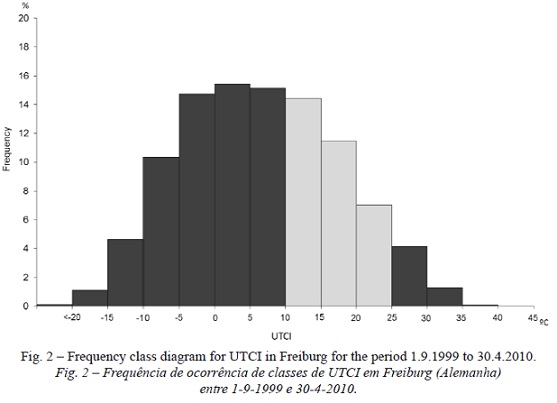
1. Class diagramsIn order to visualise the frequency distribution of the PET and UTCI values, two class diagrams have been produced (without considering any physiological relevant classification). Figure 1 shows the frequency classes diagram for PET and figure 2 shows UTCI. It can be seen that the mean conditions (slight and neutral thermal conditions) are similar. The differences are in the maxima and minima values. Under very high and extreme cold stress PET has a higher frequency than UTCI. In cold conditions 5.8% of UTCI values and 3% of PET values are lower than -10 ºC. As to heat conditions, 0.7 % of PET values are higher than 35 ºC versus only 0.1 % of UTCI values (fig. 1 and 2).
2. Beanplots
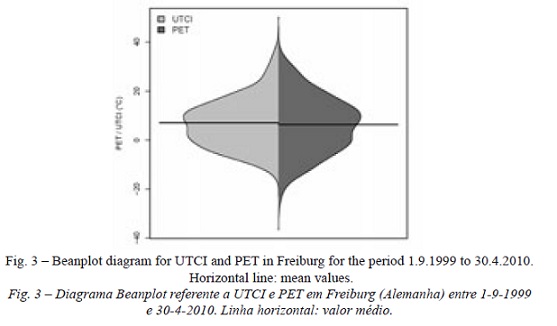
Figure 3 shows the distribution of the UTCI and PET values (left and right side of the plot respectively). The box plot indicates that the mean of UTCI is slightly higher than PET’s. The shape of both distributions is different, showing a more pronounced frequency in the cold conditions for UTCI. PET shows colder conditions all the year round.
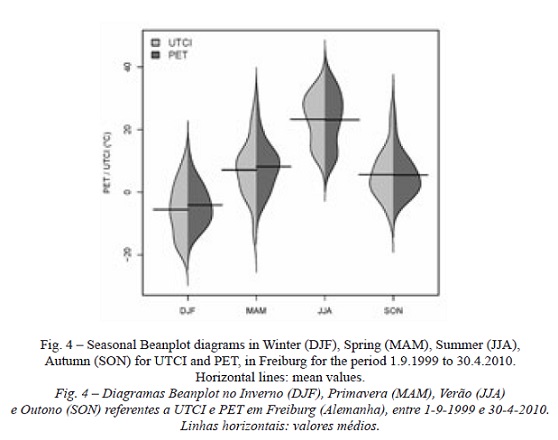
The seasonal distributions (fig. 4) show that there are fewer differences in PET and UTCI’s mean values in summer (JJA) and autumn (SON) than in spring (MAM) and Winter (DJF). Figure 4 also demonstrates that the highest frequency differences occur during spring followed by autumn. The summer distribution or shape of the beanplots is very similar except for the extreme hot conditions, where PET shows higher frequency of these values. For winter conditions UTCI is lower than PET, having also a different shape.
3. Scatterplots
Figure 5 shows the scatter plot of UTCI and PET for the examined period. It can be seen that the correlation coefficient between both indices is 0.936 and the cloud is narrower for temperatures above 15 ºC. in Freiburg, the maximum differences are around 5 ºC. For cold conditions the differences can be greater than 30 ºC because of the clothing adaptation model for UTCI.

IV. DISCUSSION AND CONCLUSION
The present analysis for Freiburg shows that PET and UTCI are generally comparable. The comparison of the frequency classes of figures 1 and 2 shows that the main values fall in the thermal comfort or in the cold stress categories. A direct comparison of the classes between PET and UTCI is not possible because of definition of no thermal stress for UTCI (+9 to +26ºC). In general, it can be seen that the mean value for the whole year and the mean values for the different seasons are similar, except for the winter period where PET is higher than UTCI. The shape of annual distribution of UTCI and PET (fig. 3) is characterized by slight higher UTCI and lower PET values. In extreme heat classes is UTCI higher and in the extreme cold PET lower. The UTCI and PET’s distributions have different shapes and there is a more pronounced distribution in the values of UTCI. The shape distribution of the different seasons shows a structure very similar to the annual one.
The statistical relationship between PET and UTCI show a correlation coefficient (r) of 0.936 and less, scattering the classes of heat stress. This is a result of the approach used for the clothing model. in the heat stress classes the clothing is less than 1 clo and so better comparable. A direct comparison between the thermal comfort classes and the cold conditions is not possible, due to the adjusted clothing insulation in UTCI. For the warm stress level (based on the 95 percentile) which corresponds to PET > 25.8 ºC it can be seen that the relationship has a correlation coefficient r= 0.975. for 99 percentile the relationship corresponds to 33.8 ºC, r=0.958.
The outlier analysis in the range of very high values revealed that UTCI accounts better for very high values of vapour pressure. This may be negligible for middle European climate conditions, since such high values only occur under artificial circumstances. However, in tropical conditions this difference may become important.
In general, there is a good agreement and relationship between PET and UTCI for the warm levels. Additional comparisons for different climate regions, but more specifically for arid and hot-humid conditions, are required in order to check the behaviour of both thermal indices. Also differences between urban and rural areas should be of interest. It seems that both indices can be used for general analysis. For extreme conditions it is recommended to use more than one index.
For hot conditions, UTCI or PET may be used indifferently, although UTCI is better for warm and humid environments. For cold conditions, UTCI gives more details about cold stress.
BIBLIOGRAPHY
Andrade H, Alcoforado MJ (2008) Microclimatic variation of thermal comfort in a district of Lisbon (Telheiras) at night. Theoretical and Applied Climatolology, 92: 22-37. [ Links ]
Gulyas A, Unger J, Matzarakis A (2006) Assessment of the microclimatic and human comfort conditions in a complex urban environment: modelling and measurements. Building and Environment, 41: 1713-1722. [ Links ]
Havenith G, Fiala D, Klazejczyk K, Richards M, Bröde P, Holmer I, Rintamaki H, Benshabat Y, Jendritzky G (2012) The UTCI-clothing model. International Journal of Biometeorology, 56: 461-470. [ Links ]
Höppe P (1993) Heat balance modelling. Experientia, 49: 741-745. [ Links ]
Höppe P (1999) The physiological equivalent temperature – a universal index for the biometeorological assessment of the thermal environment. International Journal of Biometeorology, 43: 71-75. [ Links ]
International Union of Physiological sciences - thermal Commission (2003) Glossary of terms for thermal physiology. Journal of Thermal Biology, 28: 75-106. [ Links ]
Jendritzky G, Bröde P, Fiala D, Havenith G, Weihs P, Batchvarova E, Dedear R (2010) the Universal thermal Climate index UTCI. In Matzarakis a, Mayer H, Chmielewski f-M (ed.) Proc. 7th Conference on Biometeorology, Freiburg. Ber. Meteor. inst. Univ. Freiburg nr. 20: 184-188. [ Links ]
Jendritzky G, De Dear R, Havenith G (2012) UTCI - Why another thermal index? International Journal of Biometeorology, 56: 421-428. [ Links ]
Kampstra P (2008) Beanplot: a boxplot alternative for visual comparison of distributions. Journal of statistical software 28, Code snipPET 1. [ Links ]
Lin T-P, Matzarakis A, Hwand Rl (2010) shading effect on long-term outdoor thermal comfort. Building and Environment, 45: 213-211. [ Links ]
Matzarakis A (2006) Weather and climate-related information for tourism. Tourism and Hospitality Planning and Development, 3: 99-115. [ Links ]
Matzarakis A, Amelung B (2008) Physiologically equivalent temperature as indicator for impacts of climate change on thermal comfort of humans. In thomson MC, et al. (eds.) Seasonal Forecasts, Climatic Change and Human Health. Advances in Global Change research 30, springer-sciences and Business Media, 161-172. [ Links ]
Matzarakis A, Mayer H (2008) Importance of urban meteorological stations - the example of Freiburg, Germany. Ber. Meteor. Inst. Univ. Freiburg 17: 119-128. [ Links ]
Matzarakis A, Mayer H (1996) Another kind of environmental stress: thermal stress. WHO Newsletter, 18: 7-10. [ Links ]
Matzarakis A, Mayer H, Iziomon MG (1999) Applications of a universal thermal index: physiological equivalent temperature. International Journal of Biometeorology, 43: 76-84. [ Links ]
Matzarakis A, Rutz F, Mayer H (2010) Modelling radiation fluxes in simple and complex environments – Basics of the rayMan model. International Journal of Biometeorology, 54:131-139. [ Links ]
Matzarakis A, Rutz F, Mayer H (2007) Modelling radiation fluxes in simple and complex environment - application of the rayMan model. International Journal of Biometeorology, 51: 323-334. [ Links ]
Mayer H (1993) Urban bioclimatology. Experientia, 49: 957-963. [ Links ]
Mayer H, Höppe P (1987) Thermal comfort of man in different urban environments. Theoretical and Applied Climatology, 38: 43-49. [ Links ]
Muthers S, Matzarakis A (2010) Use of beanplots in applied climatology – a comparison with boxplots. Meteorologische Zeitschrift, 19: 639-642. [ Links ]
VDI (1998) VDI 3787, Part i: environmental Meteorology, Methods for the human biometeorological evaluation of climate and air quality for the urban and regional planning at regional level. Part i: Climate. Beuth, Berlin.
 Todo o conteúdo deste periódico, exceto onde está identificado, está licenciado sob uma Licença Creative Commons
