


Serviços Personalizados
Journal

Artigo
 Inglês (pdf)
 Artigo em XML
 Referências do artigo
 Enviar este artigo por email
Indicadores
 Citado por SciELO
 Links relacionados
 Similares em
SciELO
Similares em
SciELO Compartilhar

 Permalink
Finisterra - Revista Portuguesa de Geografia
versão impressa ISSN 0430-5027
Finisterra no.98 Lisboa dez. 2014
ARTIGO ORIGINAL
Comparison of measured and simulated mean radiant temperature. Case study in Lisbon (Portugal)
Simulação e medidas in-situ da temperatura radiativa média. Exemplo em Lisboa (Portugal).
Ágota Szűcs1 Tamás Gál2 Henrique Andrade3
1 Université de La rochelle, avenue Michel Crépeau, 17042 La rochelle Cedex, France. E-mail: agotaszucs@gmail.com
3 Institute of Geography and spatial Planning, CEG-IGOT- Universidade de Lisboa
ABSTRACT
Mean radiant temperature (MRT) is one of the most relevant human bioclimatic indices, particularly suitable for assessing the influence of climatic parameters on thermal comfort outdoors. MRT can be calculated either from physical measurements, carried out using a globe thermometer or a pyranometer and a pyrgeometer, in order to quantify short and long wave radiation fluxes, or through computer simulation. The first method, although accurate, entails the measurement of radiant fluxes from six directions, therefore it is time consuming, complex and it requires the use of expensive equipment. The second method is based on RayMan, ENVI-met and SOLWEIG computational models, often employed in urban climatological research. The present research deals with the comparison of MRT data obtained by measurement and computational simulation in Campo de Ourique, a densely populated city quarter of Lisbon. The measurements were carried out in a park and in the surrounding canyon streets during four summer days in 2006. The three computational models present some differences regarding their viability in estimating MRT compared to measurement: in case of direct solar exposure RayMan and SOLWEIG provided particularly good approximation (with an average difference of 6 and 9%, respectively), whereas the average overestimation of MRT obtained by ENVI-met is around 20%. However, in shaded locations ENVI-met provided the most acceptable agreement between measured and simulated MRT; in contrast RayMan and SOLWEIG overestimated MRT by 15% on average.
Keywords: Mean radiant temperature, measurement, simulation, RayMan, ENVI-met, SOLWEIG, Lisbon (Portugal).
RESUMO
A temperatura radiativa Média (MRT) é um dos índices bioclimáticos melhor adaptados para a apreciação da influência dos parâmetros climáticos no conforto térmico em espaços exteriores. Pode ser deter minada a partir de medições com um termómetro-globo ou com piran ómetro e pirgeómetro para quantificar os diversos fluxos de radiação, ou por simulação numérica. O primeiro m étodo dá resultados precisos, mas exige a medição dos fluxos de radiação em seis direcções e os aparelhos são caros. O segundo método utiliza os modelos RayMan, ENVI-met e SOLWEIG, frequentemente usados em climatologia urbana. Os resultados obtidos por medição e simulação foram comparados no caso de um bairro urbano denso de Lisboa (Campo de Ourique). As medi ções foram efectuadas durante quatro dias, no Verão de 2006, num espaço verde e ruas vizinhas. O cálculo de MRT pelos modelos numéricos dá resultados algo diferentes. Nos locais ao sol, os valores obtidos por RayMan e SOLWEIG são os que mais se aproximam dos valores medidos (diferenças médias de 6% e 9%, respectivamente), ao passo que ENVI-met os sobrestima em 20%. Nos locais à sombra, ENVI-met fornece o melhor resultado, ao passo que RayMan e SOLWEIG sobrestimam os valores em 15%.
Palavras-chave: Temperatura radiativa M édia, medição, simulação numérica, RayMan, ENVI-met, SOLWEIG, Lisboa (Portugal).
RÉSUMÉ
Simulation et mesure in-situ de la Température Radiante Moyenne. Un exemple à Lisbonne (Portugal). La Température Radiante Moyenne (MRT) est un des indices bioclimatiques le plus adapté pour apprécier l’influence des paramètres climatiques sur le confort thermique en espace extérieur. Elle peut être calculée soit à partir des mesures physiques effectuées par un thermomètre dit “ globe” ou avec un pyranomètre et un pyrgeomètre pour quantifier les flux de radiation, soit par simulation numérique. La premi ère méthode donne des résultats précis, mais exige la mesure des flux selon six directions. Elle est longue et compliquée à mettre en œuvre, en plus l’appareil de mesure est coûteux. La seconde méthode utilise les modèles RayMan, ENVI-met et SOLWEIG, couramment employés dans les recherches de climatologie urbaine. Les résultats obtenus par ces deux méthodes ont été comparées dans le cas d’un quartier urbain dense situé à Lisbonne: Campo de Ourique. Les mesures ont été effectu ées pendant 4 jours, en été 2006, dans un parc et dans des rues environnantes. Les modèles numériques utilisés montrent quelques différences en ce qui concerne leur validité pour calculer la MRT. Pour les endroits ensoleillés, les valeurs obtenues par RayMan et SOLWEIG correspondent le plus aux valeurs mesurées (la différence moyenne étant respectivement de 6 et de 9 %), cependant ENVI-met les surestime de 20% en moyenne. Dans le cas des endroits ombragés, ENVI-met fourni l’approximation la plus pertinente, alors que RayMan et SOLWEIG présentent une surestimation de 15%, en moyenne.
Mots-clés: Température radiante Moyenne, mesure, simulation numérique, RayMan, ENVI-met et SOLWEIG, Lisbonne (Portugal).
I. RESEARCH CONTEXT
Natural and artificial surfaces can be found in urban environments where more than half of the earth’s population lives. The former surfaces can be mineral or contain vegetation whereas the latter can be dense or porous and made of metal, glass etc. The atmospheric variables in urban areas, and therefore human thermal comfort outdoors, are significantly affected by the geometry of the convoluted urban environment and by the physical characteristics of the materials.
Nowadays, public awareness has been raised towards the various consequences of urbanisation and, among them, the urban heat island phenomena (UHI).
the UHI is a result of a combination of factors affecting the local energy balance, such as the building geometry, surface roughness, physical properties of building materials, anthropogenic heat sources etc. (Oke, 1982, in yow, 2007). According to Oke (1982) and arnfield (2003) seasonal climatic and daily synoptic conditions, such as diurnal cycle, play an important role in determining UHI characteristics. Therefore, each urban area has a specific UHI uniqueness due to the circumstances at a given location.
There are various types of UHI and several methods of observing and studying them. UHI occurs at ground level, at different heights and as surface heat islands. Atmospheric UHI may be measured within the planetary boundary layer (above the city) and in the urban canopy (up to the top of the buildings of the urban zone). The surface UHI occurs at the level of the various urban surfaces and yow (2007) refers to it as skin surface temperature. Surface UHI has a particularly strong effect on radiative environment and therefore on thermal comfort of humans in outdoor urban environments, especially in case of strong solar radiation exposure. It can exacerbate thermal discomfort, in particular during warm summer periods: the artificial surfaces, such as asphalt and concrete absorb heat during daytime, warm up the air by convection and release heat into the atmosphere during the night (Oke, 1982; Kuttler, 2008; armson et al., 2012). The reduction of vegetation and the increase of artificial surfaces lead to lower albedo (and the decrease of reflected short-wave radiation) and to the reduction of evapotranspiration (in other words, the decrease of cooling due to latent heat transfer).
Atmospheric and surface UHI represent an important problem during hot summer periods that occur regularly in southern Europe. The increased use of air conditioning during these periods releases more heat into the outside air which adds to the high short and long wave radiation fluxes in the urban environment resulting in extended and more frequent thermally uncomfortable periods. these in turn give rise to health problems especially among children and the elderly.
The UHI phenomenon is predicted to increase with climate change, since mean temperatures, the frequency of heat waves and their duration are forecasted to rise (Vanos et al., 2010).
The present study aims to evaluate the computationally simulated MRT values against in-situ measured MRT values. MRT was measured and evaluated in an urban garden and also in surrounding streets − both on shaded and sunexposed sides.
II. THERMAL COMFORT IN OUTDOOR ENVIRONMENTS
The human body exchanges energy with its environment through convection, conduction and radiation. in an outdoor environment the climatic parameters vary to a substantially larger extent than in an indoor environment: in particular, long-, and shortwave radiation, air movement, surface and air temperatures. As a consequence, the human body needs to adapt to the extended range of environmental outdoor conditions through its thermoregulation system, in order to maintain a constant deep body temperature. Thermal comfort signifies a state where the constant deep body temperature can be maintained by the least energy exchange occurring at the body’s surface. Discomfort describes the departure from comfort.
in terms of human thermal comfort, outdoors thermal conditions are strongly influenced by temperature and even more so by radiation, whose variable pattern induce large differences between sun-exposed and shaded zones (Égerházi et al., 2013; Kántor et al., 2012).
The Mean radiant temperature (MRT) is one of the indices that takes into account all short and long-wave radiative flux reaching the individual and is applicable in complex outdoor environments. It integrates the incoming and reflected direct and diffuse short wave radiation, as well as long wave radiation from the surrounding surfaces, the ground and from the sky.
In what concerns the human thermal comfort outdoors, conductive heat fluxes can be neglected. On the contrary, radiative and convective fluxes play an important role in the heat balance of the human body. Convective fluxes of latent and sensible heat are modified mainly by air humidity and air temperature, respectively, while both are influenced by wind speed (Kántor et al., 2012). However, the MRT is the key factor affecting thermal comfort in case of strong direct solar radiation.
MRT can be measured with a globe thermometer − a tool used originally in indoor environmental conditions and later adapted for outdoor settings. The standard globe thermometer is a hollow sphere of copper, painted black and containing a thermometer in its centre. The wall thickness is 0.4mm and the sphere diameter is 150mm. The temperature measured in the centre of the globe thermometer results from radiative and convective fluxes. Indoors, where air movement is restricted, the globe temperature gives a good approximation of MRT, whereas in outdoor locations its reading is significantly influenced by convection and is closer to air temperature. Therefore it is not an ideal tool to measure MRT outdoors.
MRT can also be measured using a pyrgeometer and a pyranometer, proposed by H öppe and also suggested by VDI 3789 Guideline (Höppe, 1992; VDI, 1998). It requires costly equipment and the measurement procedure is tedious and timeconsuming. Terrestrial and solar radiation fluxes that fall on a person are measured separately: a pyranometer is used to measure radiative fluxes within the short wave domain and a pyrgeometer is used to record radiative fluxes situated in the longwave domain. The 3D space is divided into six parts: upper and lower directions, and the four cardinal directions. The different directions have different weighting factors according to the body’s position (seating down or standing) (Kántor et al., 2012)
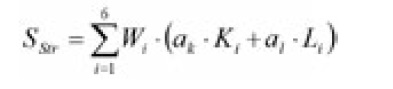
The mean radiant flux density (sstr in W/m2) absorbed by the individual is calculated from the measured terrestrial (Li in W/m2) and solar (Ki in W/m2) fluxes in the above mentioned six directions, multiplied by the weighting factors (Wi) according to the body shape corresponding to each direction (i = 1 to 6), and by the absorption coefficients of the clothed body from short− (ak), and longwave radiation (al) − as equation 1 illustrates (Höppe, 1992, in Kántor et al., 2012).
The MRT can be calculated from Sstr according to the Stephan–Boltzmann law, using equation 2 (Kántor et al., 2012):
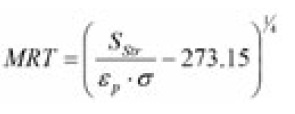
Where
σ is the Stefan-Boltzmann constant and
ε pis the emissivity of the clothed human body which is equal to a l according to Krichhoff’s law (Kántor et al., 2012).
In order to avoid difficult and lengthy measurements, various computational models can be used to estimate MRT: RayMan (Matzarakis et al., 2000; Matzarakis et al., 2007), ENVI-met (Bruse, 1999 and 2006) and SOLWEIG (Lindberg et al., 2008; Lindberg and Grimmond, 2011).
The present research provides a detailed comparison of computer simulated MRT values with measured MRT at Campo de Ourique, a densely populated city quarter of Lisbon, Portugal. It is the extension of a previous research project carried out by Oliveira et al. (2011), which focused on the assessment of the thermal performance of an urban garden and its influence on the atmospheric parameters in the neighbouring area.
III. STUDY AREA
The chosen study area is situated in Lisbon, a city located near the western coast of Portugal, at 38º43’ latitude n and 9º9’ longitude W, lying 30km to the east of the Atlantic shore, on the Tagus river estuary (Alcoforado et al., 2009). Lisbon’s climate is “Mediterranean” with mild winters and hot, dry summers. The hottest month is august (average temperature: 23ºC), followed by July (22.7ºC) and September (21.8ºC) (Alcoforado et al., 2009). The prevailing wind in summer blows from N and NW during the whole day (40% of the time) and during late afternoon (30% of the time) (Alcoforado et al., 2006). Total average precipitation is less than 7mm in July and august, while it increases to 28mm in September.
The studied urban quarter is situated in a densely built-up zone in the western part of Lisbon, close to the Monsanto hill forest park. The study area is relatively flat with an altitude of approximately 90m above sea level. It has a garden, the Garden Teófilo de Braga, surrounded by 15-25m high buildings along a N-S and E-W oriented network of approximately15 m wide streets (Oliveira et al., 2011). The average sky view factor of the streets calculated by RayMan is 0.28, which leads to pronounced differences regarding duration of insolation along the longitudinal axis of the N-S and the E-W oriented streets: 3.5 hours for the former and 11 hours for the latter (Oliveira et al., 2011).
The garden has a rectangular shape and occupies 0.58ha. It is a pleasant place for rest, contemplation of nature and recreation. It has a small lake in its centre and a dense plant community consisting mostly of deciduous trees (Oliveira et al. , 2011).
IV. METHODOLOGY: MEASUREMENT AND COMPUTER SIMULATION
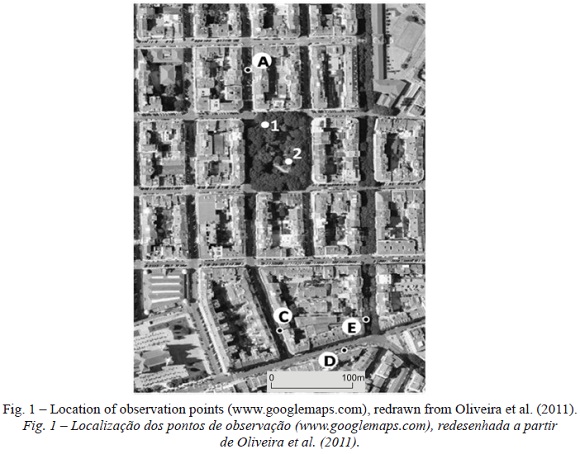
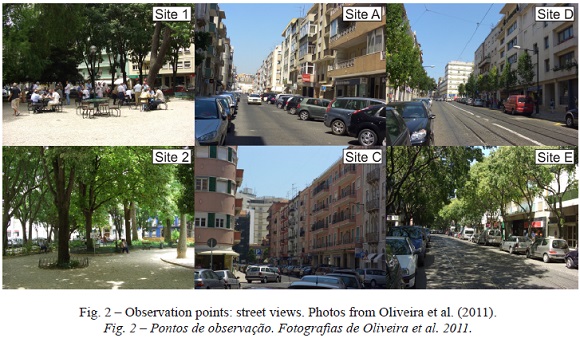
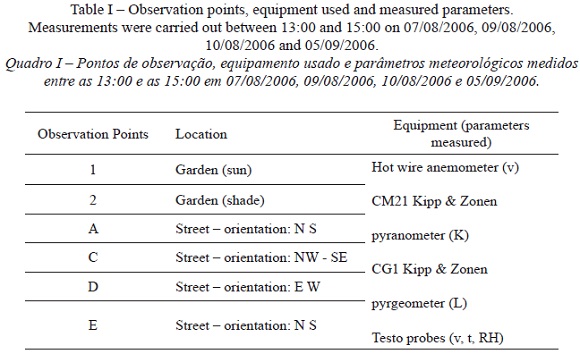
Itinerant measurement campaigns were carried out in 2006 during four summer days, at 2 locations in the garden (points 1 and 2) and at 4 locations in the neighbouring streets (points a, C, D, e), as shown in figure 1, in order to measure air temperature, relative humidity, wind speed, short and long wave radiation. The measurement points were chosen so that they could provide some information on the influence of the garden on microclimatic parameters in different street orientations and in streets with and without trees. Points a, C and D are situated in streets with no trees and a N-S, NW-SE and E-W direction respectively. Point e is located in a N-S direction street lined with dense rows of mature trees. Point 1 is situated within the garden, in a location where people enjoy sitting at tables, and is exposed to sun during the entire afternoon, while point 2 is constantly under shade projected by the tree crowns (fig. 2).
Air temperature, relative humidity and wind speed were recorded at all sites, at a height of 1.5 m, using testo probes, while incident short-, and longwave radiation from six directions were measured at a height of 1.1m, using CM21 Kipp & Zonen pyranometer and a CG1 Kipp & Zonen pyrgeometer, respectively. The measurements were performed according to the integral measurement method developed initially by Jendriztky and Nübler (Jendriztky and Nübler, 1981; VDI, 1988; Oliveira et al., 2011; Kántor and Unger, 2011) during the early afternoon hours when most people visit the garden to find shelter from the summer heat. The pyranometer measures the short wave radiation (K), and the pyrgeometer the long wave radiation fluxes (L). K and L have been recorded for the four cardinal directions, as well as downwards and upwards. The mean radiation flux intensity absorbed by the human body was calculated using the terrestrial and the solar radiation fluxes, weighted according to the direction and the absorption coefficient of the body for short and longwave radiation. The MRT was calculated according to the Stefan-Boltzmann law (Oliveira et al., 2011) taking into account the direction of the solar and thermal infrared radiative fluxes. The MRT can be considered as an indicator of all surface temperatures combined and as an overall descriptor of perception regarding the radiative environment surrounding the human body, and therefore is a biometeorological indicator.
Two sets of in-situ measurement were carried out consecutively at each street point, one in the shade and the other under direct solar radiation (the instrument was moved from the shade to the sun), in order to detect the impact of solar radiation. The measurement equipment stayed in place for 10-15 minutes during each measurement at the sun exposed and at the shaded locations (table I).
The general atmospheric conditions during the experiment were relatively hot, cloudless with maximum and minimum temperatures above the average monthly values measured at the airport: Tmax - 31.8ºC (07/08/2006), 35.6ºC (09/08/2006), 33.3 ºC (10/08/2006) and 31.0ºC (05/09/2006), Tmin – 22.0ºC (07/08/2006), 26.4ºC (09/08/2006), 22.9ºC (10/08/2006) and 21.1ºC (05/09/2006) (Oliveira et al., 2011). The temperature threshold above which the impact of high temperatures can be observed on mortality rates in Lisbon is 32ºC (Nogueira and Paixão, 2008); the temperature measured was above this threshold at two experiment sites. The wind conditions were highly variable with very low speeds: between 1.6 m/s and 0.4 m/s.
The measured MRT values were compared with computationally simulated ones obtained using three different models: RayMan, ENVI-met 3.1 and SOLWEIG2. These computational models calculate the radiative environment within the studied city district at pedestrian level. The various models require different data inputs as described below.”ENVI-met is a raster-based 3D microclimate model, designed to simulate surface-vegetation atmosphere processes in urban areas, with a typical grid resolution from 0.5 m to 10 m in space and 10 seconds in time ” (Bruse, 1999 and 2006). It simulates the dynamics of microclimate during a diurnal cycle using fundamental laws of thermodynamics and fluid mechanics. The model requires input data regarding buildings, vegetation and meteorological conditions. The atmospheric parameters used are from Lisboa/Geof ísico Meteorological station (MS), 1 km SE of the study site. The prognostic variables of ENVI-met includes, among others, temperature, wind speed and direction, radiative fluxes, humidity and particle dispersion.
RayMan is a bioclimate and radiation model that facilitates the calculation of radiation flux densities based on building, vegetation and meteorological data. The 3D environment is divided into an upper and a lower hemisphere separated by a plane surface 1.1 m above the ground (Matzarakis et al., 2000, Matzarakis et al., 2007). RayMan requires input data on building geometry, surface characteristics (albedo, emissivity), geographical location, date, time, meteorological variables and vegetation.
SOLWEIG – SOlar and Long Wave Environmental Irradiance Geometry model, developed by Lindberg et al. (2008) simulates spatial and temporal variation of radiation fluxes, shadow patterns in urban environments, based on the geographical location, the urban morphology (buildings, plants) and meteorological parameters (temperature, humidity, direct and diffuse components of short wave radiation). SOLWEIG is a raster-based model and uses Digital elevation Models to represent the convoluted urban morphology including buildings and vegetation. it requires data on building geometry, surface characteristics (emissivity for vertical surfaces and for the ground, albedo, transmissivity of shortwave radiation for the vegetation), meteorological data (short, and longwave radiation, temperature, relative humidity, wind speed), date and time in order to calculate MRT at a point of interest.
The simulated MRT and shadow patterns have hourly temporal resolution, and the spatial resolution of the 3D geometrical model is 2.5 m. The cell sizes used to model the Campo de Ourique area by ENVI-met and SOLWEIG are 2m x 2m, and 2.5 x 2.5 m, respectively.
V. RESULTS
The observed MRT values recorded during the in-situ measurement campaigns were compared with computer simulation results obtained using SOLWEIG, RayMan and ENVI-met models. The analysis is concentrated on the effect of solar radiation; therefore the data were divided into two groups: those recorded at sunexposed locations, and those recorded in shaded areas.
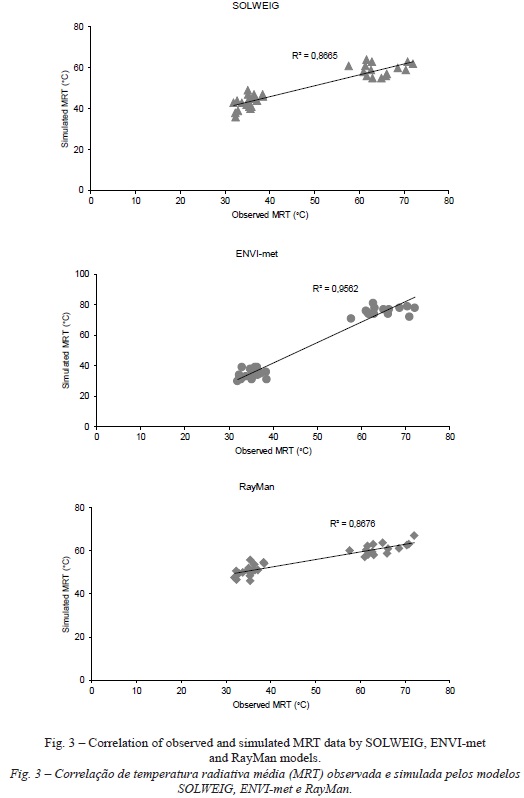
The observed and simulated datasets – recorded and calculated both under shade and sun – were compared through regression analysis, statistical similarity test of series (using f test, calculated with ANOVA method), and calculation of differences for each point analysing the mean and the extreme differences. The computationally simulated and the measured data have a very strong correlation for all models used: the highest correlation was found for the ENVI-met model (0.96), and a slightly lower one for SOLWEIG and RayMan models (0.87 for both), meaning that the covariance between the measured and the simulated values is strong, but they are not necessarily identical (table II and fig. 3). The f test revealed, under the null hypothesis that values of the two datasets are similar, that measured and simulated values are not significantly different when MRT was calculated using ENVI-met and SOLWEIG (f =1.07 and 0.47 respectively); however the null hypothesis was rejected (f=6.43) when RayMan model was used (table II).
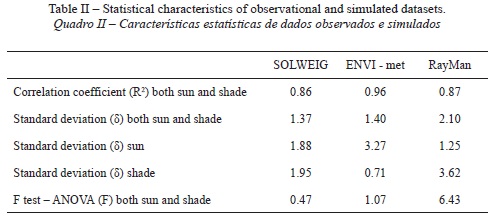
Regarding the median value of the absolute temperature difference for the observation points, the ENVI-met and SOLWEIG models once again yield better results (3.7 and 7.7ºC respectively), while the result is less favourable when the RayMan model is used: 13.5ºC.
The maximal absolute differences obtained with all models are high: 18ºC for ENVI-met, 14ºC for SOLWEIG and 20ºC for RayMan (Andrade and Szűcs, 2012).
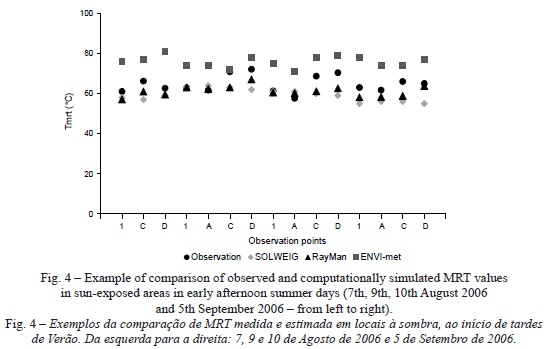
The shaded and the sun-exposed zones show significant differences regarding MRT. The highest value, 72ºC, was observed at point D that was exposed to direct solar radiation and situated in an E-W orientated street on the south part of the selected zone, while the lowest, 58ºC, was obtained at point a (fig. 4). It may be surprising that the lowest MRT was not observed in the garden, but instead at point a in the northern part of the study area. The explanation is that point a receives direct solar radiation during a short period of 2 hours whereas point 2 has 3.5 hours of solar exposure (Oliveira and Andrade, 2007) – which is intense enough to counterbalance temperature reduction due to evapotranspiration.
It should be noted that point 1 was exposed to solar radiation during the measurement period and has no MRT values measured in the shade. On the contrary, point 2 has no MRT data recorded under direct solar exposure, since it is shaded during the afternoon. Furthermore, the MRT data for august 7th are not available for point a due to a data handling error.
The observed difference between minimum and maximum MRT values in shaded areas is substantially smaller: 6ºC, resulting from a minimum value of 32ºC recorded in the garden (point 2) and a maximum value of 38ºC occurring at point e (fig. 5).
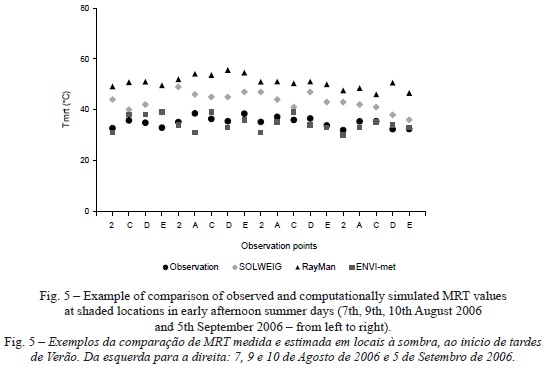
The MRT estimations, calculated by the 3 computational models used for the study, provide a relatively satisfying fit with measured MRT values, both in shaded and in sun-exposed areas.
MRT values calculated by SOLWEIG and RayMan for areas exposed to direct solar radiation are 9% and 6% below measured values on Celsius-scale, respectively. In contrast, ENVI-met provides an overestimation of about 20% for the same climatic conditions – that can lead to differences as high as 20ºC. Figure 5 depicts the comparison between observed MRT values and those simulated computationally.
Hedquist et al. (2009) carried out a measurement campaign in Central Phoenix Arizona and collected surface and air temperature on the ground with mobile sampling and by helicopter in order to obtain a detailed record over a complete diurnal period; the values were then compared with those obtained by computational modelling using ENVI-met. According to their study, the model over-predicted surface radiant temperature values in the afternoon by 25-30ºC compared to those measured by Hedquist et al. (2009). Other studies carried out by Thorsson et al. (2007) and Matzarakis et al. (2007) employed RayMan to model MRT in Göteborg in an open city square and in an urban area Freiburg Germany, respectively. The results obtained by the model were in good correlation with measurements in case of high solar elevations in Göteborg, and during the whole day of study in Freiburg.
The present study shows that the MRT values obtained by ENVI-met are in acceptable agreement with the observed data in the shade. The average and median values of the observational and simulated data sets are very close to each other, while data dispersion around a mean value (standard deviation) is slightly higher for the computationally simulated data.
In contrast, SOLWEIG and RayMan models overestimate MRT in shaded locations (by about 15%). figure 5 shows the comparison of observed MRT values in shaded areas with the computational simulation results.
Hwang et al. (2009) found a good correlation (R2= 0.85) between measured and modelled MRT values, both during winter and summer seasons, when using RayMan in Taiwan in order to study outdoor thermal comfort at an university campus. their results agree with the results of our study, in which high correlation coefficients, between computer simulated data for shade and sun, were obtained with the RayMan (R2 = 0.87) the ENVI-met (R2= 0.96) and the SOLWEIG models (R2 = 0.87).
It has also to be taken into account, when analysing and comparing in-situ measured data with computationally simulated results, that the measurement devices have a range of error themselves. In case of the latest generation of the Kippen & Zonen pyrgeometer the accuracy is about 3% (CG4 Handbook, 2003, in Viúdez-Mora, 2011). Moreover, the simulation is a geometrical, physical and climatological abstraction of the reality, and as a consequence the results represent an approximation of the real conditions.
VI. CONCLUSION
Modelling MRT represents a challenge for researchers in urban climatology particularly in complex environments, that include buildings from various architectural periods, constructed with different materials, as well as vegetation that has very different physical characteristics from the buildings.
The results obtained in Campo de Ourique district, through simulations and through physical measurements, highlight some differences in the viability of the three tested models to estimate MRT.
In general, it can be stated that there is always a tested computational model that provides MRT estimations with an acceptable agreement with the in-situ measurements, for the entire set of values. Among the three models, RayMan has provided a particularly good fit for sites exposed to direct solar radiation. ENVI-met overestimated substantially the MRT in case of direct solar exposure: the simulated values exceed those measured by 15ºC on average, and in some cases the difference reaches 20º C. SOLWEIG provided more precise results than ENVI-met for the solar exposure case, with about 4-5ºC difference to the measured MRT values. The large errors occurring using ENVI-met indicate the RayMan model as the first choice for MRT estimation in sites under solar exposure and the SOLWEIG as the second choice.
At shaded locations, simulation results obtained by ENVI-met present the best fit with observed data. RayMan overestimates the MRT by 15-20º C, as does SOLWEIG, albeit to a smaller extent. As a consequence, ENVI-met is retained as the better adapted tool for MRT simulation for shaded locations, against RayMan and SOLWEIG.
The attention drawn to the quality of life in urban areas by studies of thermal comfort is of great importance when designing or renewing urban areas as the number of urban citizens is constantly increasing. Thermal ambience has to be planned concomitantly with buildings, streets, vegetation etc. an early-phase inclusion of climatic parameters into the architectural and landscape design process promotes the creation of comfortable, more pleasant and healthier open spaces.
ACKNOWLEDGEMENTS
This research has been carried out at the Centre of Geographical studies of the University of Lisbon, together with the late Henrique Andrade (1960-2013) in the frame of the UrBKLiM Project. One year after his passing away, this paper is also presented as homage to him. The authors would like to state that some results of the present research have been published previously in conference proceedings (Andrade and Szűcs, 2011).They express their gratitude to Dr Bernadett Balázs, Dr ágnes Gulyás, Dr Fredrik Lindberg for the assistance provided in using ENVI-met, RayMan and SOLWEIG models. Thanks are also due to the anonymous referees who have helped to improve the manuscript.
BIBLIOGRAPHY
Alcoforado MJ, Andrade H, Lopes A, Vasconcelos J (2009) Application of climatic guidelines to urban planning. The example of Lisbon (Portugal). Landscape and Urban Planning, 90: 56-65. [ Links ]
Alcoforado MJ, Andrade H, Lopes A, Vasconcelos J, Vieira R (2006) Observational studies on summer winds in Lisbon (Portugal) and their influence on daytime regional and urban thermal patterns. Merhavim 6: 88–112. [ Links ]
Andrade H, Szűcs á (2012) Comparison of observed and estimated mean radiant temperature. Proceedings of the ICUC8 - 8th International Conference on Urban Climates, 6th-10th August, 2012 UCD Dublin Ireland.
Armson D, Stringer P, Ennos A R (2012) The effect of tree shade and grass surface on surface temperatures in an urban area. Urban Forestry & Urban Greening, 11: 245-255. [ Links ]
Bruse M (2006) ENVI-met 3 – a three dimensional microclimate model. Ruhr Universit ät Bochum, Geographischer Institut, Geomatik. Available: http://www.envi-met.com (retrieved 16th June 2008). [ Links ]
Bruse M (1999) The influence of local environmental design on microclimate, PhD Thesis, University of Bochum, Germany. [ Links ]
CG4 Handbook (2003) CG4 pyrgeometer. Instruction manual. Kipp&Zonen, Delft Holland. [ Links ]
Égerházi LA, Kovács A, Unger J (2013) Application of microclimate modelling and onsite survey in planning practice related to an urban micro environment, Advances in meteorology, Article ID 251586, 10 pages.
Kántor A, Unger J (2011) The most problematic variable in the course of human-biometeorological comfort assessment – the mean radiant temperature. Central European Journal of Geosciences 3(1): 90-100. [ Links ]
Kántor N, Égerházi L, Unger J (2012) Subjective estimations of thermal environment in recreational urban spaces - Part 1: investigations in Szeged, Hungary, International Journal of Biometeorology, 56: 1075-1088. [ Links ]
Kuttler W (2008) The urban climate - basic and applied aspects. In Marzluff J M et al. (eds.) Urban Ecology - An International Perspective on the Interaction Between Humans and Nature, Springer, New York: 233 - 248. [ Links ]
Lindberg F, Holme, B, Thorsson S (2008) SOLWEIG 1.0 – Modelling spatial variations of 3D radiant fluxes and mean radiant temperature in complex urban settings. International Journal of Biometeorology, 52(7): 697-713. [ Links ]
Lindberg F, Grimmond C S B (2011) The influence of vegetation and building morphology on shadow patterns and mean radiant temperatures in urban areas: model development and evaluation. Theoretical and Applied Climatology, 105(3-4): 311-323. [ Links ]
Hedquist B C, Brazel A J, Di Sabatino S, Carter W (2009) Phoenix urban heat island experiment: micrometeorological aspects 8th Symposium on the Urban Environment, Phoenix Arizona. Available: http://www.scribd.com/doc/41753627/145712 (retrieved 16th June 2012). [ Links ]
Höppe P (1992) Ein neues Verfahren zur Bestimmung der mittleren Strahlungstemperatur in Freien. (A new measurement procedure to obtain the mean radiant temperature outdoors). Wetter und Leben, 44: 147-151 (in German).
Hwang R-L, Lin T-P, Matzarakis A (2009) Outdoor thermal comfort in university campus in hot-humid regions. The seventh International Conference on Urban Climate, Yokohama Japan. Available: http://www.ide.titech.ac.jp/~icuc7/extended_abstracts/pdf/361686-1-090504094823-006.pdf (retrieved 16th June 2012).
Jendritzky G, Nübler W (1981) A model analyzing the urban thermal environment in physiologically significant terms. Archiv für Meteorologie, Geophysik und Bioklimatologie, (ser. B, 29): 313-26.
Matzarakis A, Rutz F, Mayer H (2007) Modelling radiation fluxes in simple and complex Environments - application of the RayMan model. International Journal of Biometeorology, 51: 323–334. [ Links ]
Matzarakis A, Rutz F, Mayer H (2000) Estimation and Calculation of the mean radiant temperature within urban structures. In de Dear R J, Kalma J D, Oke T R, Auliciems A et al. (eds) Biometeorology and Urban Climatology at the Turn of the Millennium, Macquarie University Sydney: 273–278, [ Links ]
Nogueira P, Paix ão E (2008) Models for mortality associated with heat waves: update of the Portuguese heat health warning system. International Journal of Climatology ; 28(4):545-62. [ Links ]
Oke T R (1982) The energetic basis of the urban heat island. Quaterly Journal of the Royal Meteorological Society, 108 (455): 1-24. [ Links ]
Oliveira S, Andrade H (2007) An initial assessment of the bioclimatic comfort in an outdoor public space in Lisbon. International Journal of Biometeorology, 52: 69–84. [ Links ]
Oliveira S, Andrade H, Vaz T, (2011). The cooling effect of green spaces as a contribution to the mitigation of urban heat: A case study in Lisbon. Building and Environment, 46: 2186-2194. [ Links ]
Thorsson S, Lindberg F, Eliasson I, Holmer B (2007) Different methods for estimating the mean radiant temperature in an outdoor urban setting. International Journal of Climatology, 27: 1983–1993. [ Links ]
Vanos J K, Warland J S, Gillespie T J, and Kenny N A (2010). Review of the physiology of human thermal comfort while exercising in urban landscapes and implications for bioclimatic design. International Journal of Biometeorology, 54: 319–334. [ Links ]
VDI (1998) Environmental meteorology, methods for the human-biometeorological evaluation of climate and air quality for urban and regional planning at regional level. VDI-Verlag, Düsseldorf.
Viúdez-Mora A (2011) Atmospheric downwelling longwave radiation at the surface during cloudless and overcast conditions. Measurements and modeling. Doctoral thesis, Universitat de Girona, ISBN 978-84-694-5001-7. [ Links ]
Yow D M (2007) Urban heat islands: observations, impacts, and adaptation. Geography Compass, 1(6): 1227-1251. [ Links ]
Received: December 2013. Accepted: July 2014

