


Serviços Personalizados
Journal
Artigo
 Inglês (pdf)
 Artigo em XML
 Referências do artigo
 Enviar este artigo por email
Indicadores
-
 Citado por SciELO
 -
 Acessos
Links relacionados
-
 Similares em
SciELO
Similares em
SciELO
Compartilhar

 Permalink
Finisterra - Revista Portuguesa de Geografia
versão impressa ISSN 0430-5027
Finisterra no.106 Lisboa dez. 2017
https://doi.org/10.18055/Finis10102
ARTIGO ORIGINAL
‘Unequal mobilities’ in the Lisbon metropolitan area: daily travel choices and private car use
‘Mobilidades desiguais’ na área metropolitana de Lisboa: trajetos quotidianos e usos de transporte particular
Des «mobilités inégales» dans la région de Lisbonne: parcours journaliers et choix d’un transport privé
Renato Miguel do Carmo1; Sofia Santos2; Daniela Ferreira2
1 Professor Auxiliar do Departamento de Sociologia do ISCTE-IUL e investigador do Centro de Investigação e Estudos em Sociologia (CIES) do Instituto Universitário de Lisboa (IUL), Avenida das Forças Armadas 376, 1600-077 Lisboa, Portugal. E-mail: renato.carmo@iscte-iul.pt
2 Investigadora do Centro de Investigação e Estudos em Sociologia (CIES) do Instituto Universitário de Lisboa (IUL), ISCTE, Lisboa, Portugal. E-mail: sofia.santos@iscte.pt ; daniela.ferreira77@gmail
ABSTRACT
Mobilities have been looked at in increasingly greater depth over the last few decades, posing a growing set of theoretical and methodological problems for urban studies. One of the approaches being adopted in this field is the consideration of the relationship between social inequalities and various different mobility conditions. The present article seeks to demonstrate the extent to which mobility behaviours of residents of the Lisbon Metropolitan Area vary in accordance with a range of inequality variables, such as gender, education, social class, and age, thus generating clearly marked social profiles. Special attention is paid to car use. Statistical analysis of a questionnaire applied to 1,500 residents shows that regular car use is still relatively circumscribed to one social group, to which it offers the advantage of less time spent on daily travel, notwithstanding the increased costs. On the other hand, populations who regularly use public transport are at a disadvantage, spending more of their day travelling from one place to another.
Keywords: Social inequalities; mobilities; metropolitan space; transport; car use.
RESUMO
O estudo sobre mobilidades tem vindo a aprofundar-se nas últimas décadas, colocando um conjunto crescente de novos problemas teóricos e metodológicos às ciências sociais. Uma das abordagens diz respeito à relação entre desigualdades sociais e diferentes condições de mobilidade. Este artigo pretende demonstrar em que medida os usos e os custos da mobilidade, entre os residentes da Área Metropolitana de Lisboa, variam em função de um conjunto de variáveis de desigualdade – como é o caso do género, da escolaridade, da classe social, da idade – de forma a gerar perfis sociais bem vincados. Dos vários usos abordados dar-se-á especial relevo à utilização do automóvel. A análise estatística efetuada, a partir de um questionário aplicado a 1500 inquiridos, conclui que o uso regular do automóvel continua a ser relativamente circunscrito a um grupo social, propiciando menor consumo de tempo nas deslocações diárias, apesar de implicar mais custos. Em contrapartida, verifica-se uma desvantagem das populações que usam regularmente os transportes públicos, gastando mais tempo do seu dia em deslocações.
Palavras-chave: Desigualdades sociais; mobilidades; espaço metropolitano; transportes; automóvel.
RÉSUMÉ
Les études sur la mobilité ont été approfondies au cours des dernières décennies, en posant ainsi aux sciences sociales de nombreux problèmes théoriques et méthodologiques nouveaux. Un de ces thèmes est celui du rapport entre les inégalités sociales et les divers types de mobilité. On a cherché à démontrer en quelle mesure les habitudes et les coûts de transport concernant les habitants de l’Aire Métropolitaine de Lisbonne, diffèrent en fonction d’un ensemble de variables – le genre, la scolarisation, la classe sociale, l’âge – définissant des profils sociaux nettement différenciés. On a insisté sur l’usage des voitures individuelles. L’analyse statistique, basée sur un questionnaire appliqué á 1500 personnes, permet de conclure que l’usage habituel d’une voiture personnelle continue à être circonscrit à un certain groupe social, lui permettant de perdre moins de temps dans les parcours journaliers, mais au prix d’un coût plus élevé. En effet, ceux qui utilisent régulièrement les transports en commun perdent davantage de temps dans leur parcours.
Mots clés: Inégalités sociales; mobilité; espace métropolitain; transport; voiture.
I. INTRODUCTION
When we analyse the ways in which cities evolve – specifically in Portugal in this case – we find close relationships between the development of transport systems, changes in mobility patterns, and the expansion of the urban fabric (Salgueiro, 2001; Costa, 2007). The size of the Lisbon Metropolitan Area (AML) within the context of a small country like Portugal, and its social and spatial heterogeneity, mean it is a privileged place in which to analyse these dynamics. The AML’s gradual evolution was underpinned by progress in public transport, with cross-river links, the electric tram, the train and large terminals driving urban growth (Vieira, 1982; Salgueiro, 2001). However, since the 1990s the development of communication routes and road infrastructures and the increase in car use have been the main factors behind the appearance of new hubs and the expansion of urban sprawl, in an ever more polycentric and fragmented configuration (INE, 2003; Costa, 2007; Pereira & Silva, 2008; Salgueiro, 2001).
The urban expansion the AML has experienced over the last thirty years has contributed to a deep territorial differentiation, which is in turn overlapped by different types of social inequality. These associated phenomena have additional impacts on the way mobilities are generated within the context of a metropolitan territory with growing sociodemographic heterogeneity. Having said this, it is possible to identify metropolitan mobility patterns constructed on the basis of the differentiated use of means of travel and transport, distinct uses of time, and the financial costs they imply.
This article seeks, firstly, to show the extent to which mobility patterns and uses vary in accordance with a range of socioeconomic and sociodemographic variables, such as gender, education, social class, and also age. Secondly, our goal is to determine the extent to which car use is defined by a relationship with social inequalities, considering the variables mentioned. In a context in which private transport use in the AML has continually increased over the last twenty years, we can see that regular car use is still relatively limited to a certain social groups (INE, 2003; Santos, 2016). Our idea is not to push the idea that private transport is better and more suitable than other forms, or that every social group should have access to this type of transport under the same conditions. On the contrary, we consider than increasing private car use as a means of transport is not only unsustainable, but also a factor that favours social inequalities. What we are seeking to show is the extent to which there is a relationship between the rise in the use of private transport in the AML context and the deepening of social inequalities between its residents. To do so, we will characterise the relationship between mobilities and social inequalities by analysing the results of a survey-based questionnaire applied to 1,500 AML residents.
The article is divided into five parts. The first provides a framework by relating inputs from the inequality analyses and studies on how the right to the city is increasingly dependent on the right to mobility. The second characterises the AML socio-demographically. The third defines the methodology and criteria used to define the survey sample. The fourth presents a descriptive analysis of the data from the survey on spatial mobility practices in accordance with a set of social inequality variables. The fifth offers a multivariate analysis, using a logistic regression model based on the dependent variable private car use.
II. LITERATURE REVIEW: SPACE, MOBILITIES AND INEQUALITIES
Since the 1970s, authors inspired to Marxist theory have been actively pursuing the discussion about the capitalist system and the reproduction of social inequalities in the production of space (Harvey, 1973; Lefebvre, 1974; Castells, 1977). The work of some other authors after them (Fainstein, 2009; Soja, 2010) has deepened the notion of the right to the city, arguing in favour of processes that are more inclusive and socially and spatially fairer (Tonkiss, 2005).
The study of social inequalities is backed up by a vast body of sociological theory, which is in turn allied with a broad panoply of empirical material, particularly on a statistical level. In this respect it is important to note authors such as Goran Therborn (2006), Richard Willkinson and Kate Pickett (2009), among others, who propose a multidimensional interpretation of the various phenomena linked to inequality, which should be studied on the basis of the relationship between different variables (Carmo, Rio & Medgyesi, 2018). Recent analyses have placed particular emphasis on the spatial reproduction of income inequalities (Souche, Mercier, & Ovtracht, 2015; Santos, 2016).
On the other hand, the study of mobilities has gradually been consolidated over the last few decades. Some authors see it as a new paradigm that poses new theoretical and methodological challenges for the social sciences (Urry, 2000; Kaufmann, Bergman, & Joye, 2004; Sheller & Urry, 2006; Cresswell, 2006; Canzler, Kaufmann, & Kesselring, 2008; Carmo & Simões, 2009). Few topics have been as widely studied in the social scientific field as the (re)production of inequalities and the distribution of economic and social resources, but the latter’s relationship with geographic mobility has not been adequately addressed (Kaufmann et al., 2004; Ohnmacht, Maksim, & Bergman, 2009).
At the same time, space and mobility also seem to be relatively ignored in studies on social inequalities (Manderscheid, 2009; Soja, 2010). In reality, the social domain is still not very developed in transport policies, taking second place above all to the economic, and more recently, environmental domains (Martens, 2006; Preston, 2009). Most public authorities do not incorporate fairness considerations into their transport policy, but rather simply add a few singular instruments targeted at special needs of specific groups (Martens, 2006; Vieira, Moura & Viegas, 2007; Beirão, 2007).
The analysis of the relationship between social inequalities and the population’s mobility conditions begins with the recognition that an individual’s ability to move around and to move other individuals, objects or information constitutes a stratifying force (Manderscheid, 2009; Ascher, 2010; Motte-Baumvol, Bonin, Nassi, & Belton-Chevallier, 2016). This line of thought leads on to the development of the study of the relationship between mobility and social inequality dynamics (Kaufmann et al., 2004; Cass, Shove, & Urry, 2005; Camarero & Oliva, 2008). Camarero and Oliva postulated the working hypothesis that urban dispersion processes, sociotechnical organisation, the growing use of the car, and the “postfordisation ” of time and space, have resulted “in a mobility model that promotes new forms of exclusion and social risk and creates an environment that forces different social groups to design private, unequal strategies” (Camarero & Oliva, 2008, p. 345).
In fact, when mobility began to be studied from the social scientific viewpoint, car driving received a lot of attention due to the generalisation of the use of private transport and its effects, namely on the deepening of inequalities and in terms of the symbolic dominance and status associated with car use (Urry, 2005; Sheller, 2005; Featherstone, 2005).
From the late XIX century, the automobility system (Sheller & Urry, 2000; Featherstone, Thrift & Urry, 2005) enabled, at first, an unprecedented level of freedom, flexibility and range in the possibility of travel. Nonetheless, the urban sprawl that followed determines that places of residence, work, school or leisure are increasingly further apart from each other. Consequently, automobilty can constitute a system which forces people to intense mobility generating cities where the ownership and use of car in everyday life is mandatory (Urry, 2005). This has been a major concern of environmental policies. The political movements associated with ecological concerns were responsible for adding decreased car use to the traditional efficiency and economic development indicators as an imperative element of transport and mobility policies (Martens, 2006).
In general terms, Sheller (2008) says there are various forces which place constraints on mobility: the particular individual’s physical capacities; temporal or spatial constraints linked to particular places; social obligations; and conditioning factors of a mental or attitude-related nature (cultural skills and frameworks that make a person disposed to be mobile). Church, Frost, and Sullivan (2000) consider different types of processes that influence an individual’s ability to access activities: the spatiotemporal organisation of the household and interaction with friends and relatives (time/space budget management); the transport system, its costs, extent and network service patterns, and the conditions it offers in terms of personal security and public space; and the spatiotemporal organisation of the activities that people need to gain access to.
Other lines of study are also developing around the relationship between transport and poverty, and within urban poverty, the focus on mobility restrictions related with gender, nationality or ethnicity, or homelessness (Church et al., 2000; Hine & Grieco, 2003; Fol, Dupuy, & Coutard, 2007; Jaffe, Klaufus, & Colombijn, 2012; Jackson, 2012; Oliveira, 2014; Elias, Benjamin, & Shiftan, 2015). Church et al. note certain limitations to these approaches. They tend to emphasise a particular dimension of the problem, such as age, for example, and to neglect other factors. They do not adequately take account of these groups’ heterogeneity in material or activity pattern terms, or the multidimensionality of the reasons that put them at a disadvantage – all factors that affect their relationship with the transport system. In turn, whatever approach is adopted, one must always broaden the field of observation to the city or regional level, rather than limiting it to microscale projects targeted at groups that are specifically identified as marginalised (Hine & Grieco, 2003; Preston, 2009). Manderscheid (2009) notes that some of the studies focused on sociodemographic groups are based on rational choice models that prove insufficient to an understanding of the interconnection between social inequalities, spatial infrastructures and mobility patterns, to the extent that they fail to adequately theorise the link between socio-spatial structures and individual and collective practices (Cachado et al, 2017).
Following this bibliographical review, we will now seek to explore a socio-spatial perspective on mobility, considering that the socioeconomic variables (gender, economic conditions, professional situation, age…) interact with the characteristics of a territory to produce differentiated mobility practices.
III. SOCIODEMOGRAPHIC CHARACTERISATION OF THE LISBON METROPOLITAN AREA
The city of Lisbon forms part of a vast metropolitan territory with more than 2.5 million residents, with an identifiably significant territorial and social fragmentation and complex observable combinations of contiguous and socially polarised spacesi. As the study by Salgueiro (2001) shows, the history of the city of Lisbon and its metropolitan area has evolved around spaces where elites and more disadvantaged groups occupy zones that are close to one another but segmented. The outcome is a fragmented city. The truth is that the extensive suburbanisation of wide areas by the more advantaged socioeconomic strata which took place in the USA, for example, has not happened in Portugal or most other European countries (Grant, 2013). In the Lisbon region suburbanisation has taken place in two ways: a) the construction of large housing areas or complexes (property developments), usually by large companies; b) the marginal construction of houses on unapproved plots by smaller businesses or private individuals (Salgueiro, 2005). There are dualities in these territories, where we can find unapproved developments and even quasi-slum-like neighbourhoods on the one hand, and gated communities on the other. In some municipal areas the size of the unofficial neighbourhoods has conditioned both certain investments and the shape of the urban area itself.
Particularly in Portugal, the major demographic movements towards the larger urban centres that took place in the 1960s and 70s were accompanied by a very disorganised spatial land use, with the appearance on a large scale of unapproved housing and the building of low-cost neighbourhoods on the outskirts of cities and in their suburbs (Salgueiro, 2001). The 1990s saw processes of metropolitan expansion that entailed greater urban qualification and a suburbanisation of rural areas (INE, 2004). Simultaneously, people with more resources and dependent on car use looked for homes that offered better conditions in the suburbs (Hall, 2005). More available land means that homes can be roomier, yet also cheaper because land prices outside the city are lower than they are in Lisbon. This logic generally implies a population profile in which people are looking for better quality of life far from the hubbub of the city, along with privacy, green spaces and more parking (Salgueiro, 2005). The Portuguese population responded to opportunities provided by policies that favoured car use (Salgueiro, 2001; Pereira & Silva, 2008; Nunes, 2011; Padeiro, 2012), by preferring investments in improved roads and the urbanisation of spaces that were inadequately served by public transport – questions that are not always clearly stated in the relevant policy documents. A strictly technicist viewpoint of Portuguese planning as supposedly neutral (Cardoso & Breda-Vázquez, 2007) has played a part in this change in the urban model. Specifically in the transport sector, there is a lack of clear statements of the rulemaking and policy guidelines applicable to the planning process (Viegas, 2003).
Alongside these suburbanisation processes, city centres are under sociodemographic imbalances and Lisbon has been no exception to this rule (Pacione, 2009). This is partly due to the departure of some of the population – above all the younger elements – from the centre, with the elderly remaining. Such movements in turn have economic consequences for city centres – again, not just in Lisbon – where the decline of retail outlets and services is a reality. However, more recently there has been a renewal of the centre of Lisbon, with variations in the population of different parts of the Lisbon municipality, and in particular that of some central parishes, which are to some extent reversing the loss of previous decades (Santos, 2016; INE, 2014). Also, in the AML there is still a major differential in the population’s level of qualification. In fact, the AML includes council areas with a higher percentage of people with higher education, such as Lisbon, Oeiras and Cascais, as well as high levels of inequality. Lower levels of qualification can also be found in both rural and more urbanised territories, with links to an ageing population and the persistence of pockets of urban poverty in parts of the AML.
A decade of growth – the 1990s – was followed by a contraction, which itself began to reverse from 2004/2005 onwards, above all in the AML. The latter then grew, despite the fact that the Lisbon Council Area first lost population and has now stagnated since the turn of the century. This recovering trend was then abruptly halted, beginning in 2010. Despite this demographic evolution, the Lisbon municipality retains its unparalleled centrality, while other parts of the AML are marked by dispersed, rural settlements. Among other things, these factors influence the means people use to commute and the time they take to do so. The economic/financial crisis and the cuts in public investment and welfare benefits are worsening the living conditions of the AML’s population, as can be seen from the high rates of unemployment and emigration (INE, 2014).
IV. MATERIALS AND METHODS
As part of the project entitled “Localways - Ways of local sustainability: mobility, social capital and inequality”, a questionnaire-based survey was applied to a sample of the resident population of the AML. Its main goal was to gauge the multiple forms of social inequality, mobility practices, daily routines and forms of civic participation among the population. To this end we constructed a questionnaire script that addressed a broad range of dimensions we wanted to survey.
Given the large size of the statistical universe, it was necessary to establish a representative sample: 1,500 AML residents aged 18 years or more, covering a total of 75 parishes. The latter’s distribution was based on a territorial typology that was created in the meantime (Santos, 2016).
This typology for the AML was derived from a principal component analysis (PCA), in which we found four dimensions that constitute the key elements for a socio-territorial differentiation of the AML and explain 78.5% of the variance. We then carried out a cluster analysis using the PCA scores and based on the dimensions identified above. This led to the formation of four clusters and thence to four territorial profiles: Massified sub/urban; Qualified urban; Rural and recent or poorer suburban; Old urban and urban under renewal. There follows a brief description of each of the profiles that comprise the typology (fig. 1):
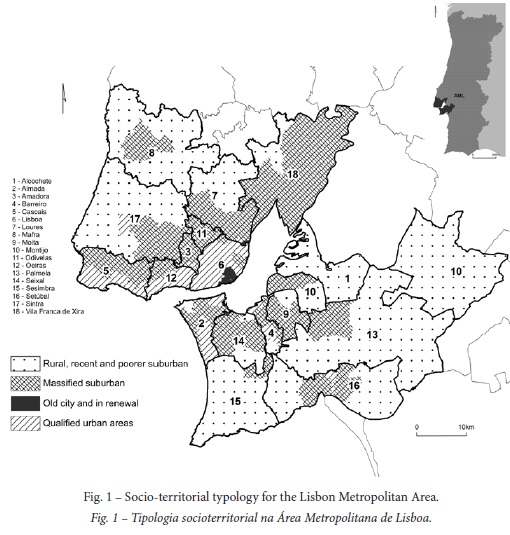
a)Massified sub/urban is composed of 78 urban and suburban parishes (58% of the AML population). Despite the fact that these parishes are negatively related with qualification, they are also defined by a negative association with depopulation and disqualification, presenting a more neutral behaviour with regard to both ageing and consolidation and renewal.
b) Qualified urban comprises 48 urban parishes (28% of the population resident in the AML), which are positively associated with qualification and negatively with depopulation and disqualification. The Lisbon Council Area is a major presence here, but so are some parishes in Cascais, Oeiras and Almada, along with the central parishes of some of the other council areas.
c) Rural and recent or poorer suburban (59 parishes, but only 11% of the AML’s resident population), defined by a much lower degree of settlement than the other groups, as well as by the disqualification of both population and housing. This group also presents a negative relationship with urban ageing and urban consolidation and a more neutral behaviour in terms of renewal, thereby suggesting a certain dynamism. It thus includes rural parishes, some of a more peripheral type and others that are the administrative centres of their council areas.
d) Old urban and under renewal, with 26 old urban parishes. This profile displays the greatest transformation: defined by an association with ageing and urban consolidation, it also represents a territory which, while disqualified, is in a process of renewal. Only 4% of the AML’s population live here, in an area that predominantly constitutes Lisbon’s historic centre.
The sample was stratified on the basis of this typology and organised using the following selected quotas (sampling error 2.5%): age, education, gender, and professional situation. This means that all the quotas were used in accordance with their representativeness in each classified territory in the AML (table I). A proportional number of parishes were randomly selected from within each profile. The survey was applied using the random route method: in each selected parish, we identified “starting points”(homes) from which to begin the routes that led to the selection of each home.
In order to statistically analyse the survey data, we will first take a descriptive uni and bivariate approach. We will then present a multivariate analysis using a binary logistic regression, from which we will create a model to explain the behaviour of the dependent variable uses private transport.
V. GENERAL RESULTS: UNEQUAL MEANS OF TRAVEL, TIME USES AND COSTS
This section presents a descriptive interpretation of what we consider to be the most important data regarding the means, uses and costs involved in AML residents’ habitual travel. The goal of this initial analysis is to characterise the variables that are most closely correlated with this type of mobility practice, and thus identify the most obvious and greatest inequalities. We then analyse the use of private transport, by constructing a statistical logistic regression model. As we will see, it is in relation to this type of use that the largest disparities in a whole range of variables are to be found.
Globally, the data purposely refer to all forms of travel, be they for work, study, leisure or shopping. Our perspective on mobility recognises that the majority of the studies and policies in this area have focused too much on transport-planning for commuting. To this end, although the importance of the purpose of the travel is taken into account, we present the results globally.
Our analysis of the survey results begins with the respondents’ daily means of travel: 28% walk, 33% use collective transport, and 39% use the car. It may be surprising how relatively balanced these figures are, but the most publicised data from Statistics Portugal only refer to the population who are employed or studying. The factor that seems to influence people’s choice of daily means of travel appears to be precisely the individual’s work situation. Even then, the association value is low, as shows figure 2 (χ2 (8) =160,000; p<0.001; Cramer’s V=0.237).
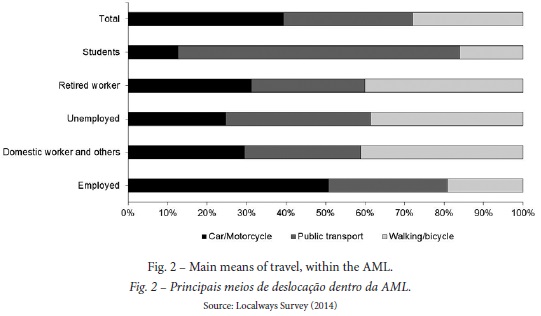
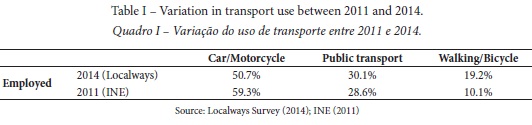
The employed population is the one that most uses the car, whose generalisation in the last twenty years has probably been the most noteworthy aspect in the evolution of the mobility behaviours of the Portuguese population. Even so, a comparison of 2011 data from Statistics Portugal with the more recent (2014) results from the Localways survey suggests that even the employed population appears to have reduced its car use in the AML (table I). This trend is probably linked to the recent context, marked as it has been by unemployment and impoverishment.
Turning to the type of territory, the data confirm that it is in the more rural or peripheral territories that the car is used most, probably because of the lower availability of public transport (table II) (χ 2 (6 = 86,043; p<0,001; Cramer’s V=0.170). We also identified an association with gender: 33% of women used the car as their main means of travel, compared to 48% of men, albeit we will look at these figures in more depth later.
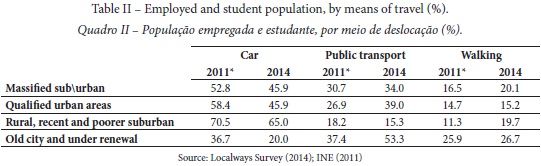
Focusing on the spatial perspective, the questionnaire underlines and complements the 2011 Census data. The reduction in car use in the areas classified as qualified urban seems to have been accompanied by an increase in the use of public transport. We know that in these areas the public transport service is more effective, and that the population’s higher socioprofessional status tends to contribute most to their choice of the car. Particularly during an economic crisis, these are spaces that are better equipped to deal with hard times. In areas where public transport is in shorter supply, like rural and peripheral zones, and where the population is less qualified and more affected by unemployment, a reduction in car use is accompanied by an increase in walking.
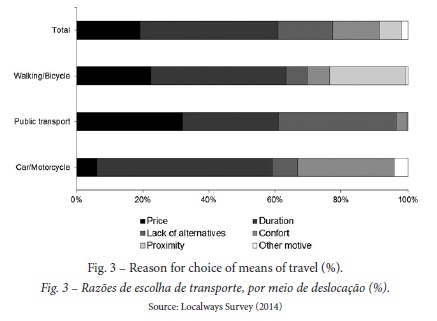
When we interpret the reasons for choosing specific means of travel, we cannot ignore the characteristics of the means itself (fig. 3) (χ2 (10) = 708,821; p<0,001; Cramer’s V=0.482). Whereas people who use the car do so primarily because of the speed and comfort it offers, collective transport users resort to this means due to its price or the lack of an alternative. Walking is chosen not only for its lower cost in price terms, but also because of the short distances involved, which make it possible to do without the other means of transport.
Interpretation of the time travelled variable is particularly important, given the constraints it imposes on the organisation of people’s daily lives. We observed that over 30% of the people who travel spent 30 minutes or less of their day doing so, thereby revealing the significance of non-workers. At the other end of the scale, 20% lost more than 1h30m of their day moving around. Professional situation influences average time spent, above all in that it also affects the choice of means of travel (table III).
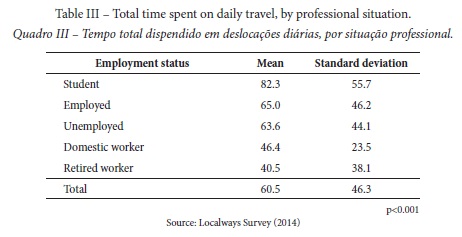
It is thus the more elderly – the group which concentrates the highest percentage of pensioners, and which in Portugal also coincides with the population with the least schooling – who spend the least time travelling. This is the group that walks most and is least obliged to travel. Walking is primarily used for short distances, which take less time. Collective forms of transport penalise their users by imposing a significant increase in time taken.
Residential and work locations are associated with the breadth of available transport options, which can either mitigate or accentuate existing inequalities, and also form part of them. We observed that central urban locations – above all Lisbon itself – appear to be the only ones where the use of public transport does not necessarily entail a significant increase in journey times. The more rural and peripheral areas are less well served by public transport, but intensive car use and the higher proportions of the population who live and work in the same council area mean this does not lead to more time spent travelling. In turn, it is in the massified urban and suburban areas that we find the greatest inequality in terms of the match between more frequent use of public transport and a larger amount of time spent travelling (fig. 4) (χ2 (6)= 443,347; p<0.001; Cramer’s V=0.414).
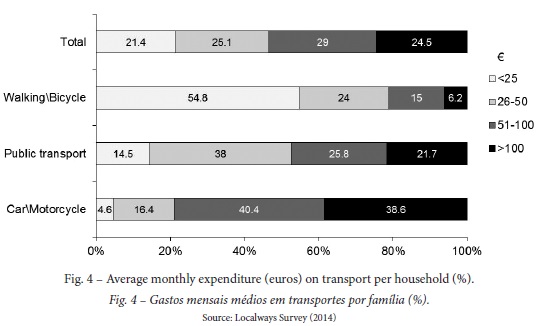
We can see how the cost of travelling varies enormously with the means of travel. The majority of people who move around by public transport manage to do so for 50 euros/month or less. On the contrary, almost 80% of people who use the car spend more than that. Even so, there is a noteworthy proportion of people who spend more than 100 euros/month on travel, despite using collective forms of transport.
Continuing our analysis of resources and skills, we find that almost 60% of respondents hold a driver’s licence, but that around 30% don’t have a car, while 50% have one, and 18% have two or more. There is a strong relationship with gender: it is above all women who do not have a driver’s licence. However, this association decreases when we look at the younger generations. Gender is particularly decisive when we address the importance of family mobility management. At this level 17% of respondents said they had dependents whose mobility was not autonomous. Within this group, whereas 70% of the women said they were the main or only person responsible for the travel of their dependents, only 30% of the men said the same thing (χ2 (5)= 55,584; p<0,001; Cramer’s V= 0.489).
The situation of less well qualified working women is especially worrying. In Portugal, it is still the case that women in general spend significantly more time than men doing housework (Perista, 2002; Barroso, 2013). The survey also shows that despite making greater use of public transport – which takes up more time – it is primarily women who are responsible for children’s mobility. One of the effects suggested by the questionnaires is that women tend to work closer to home, and are thus subject to more time and space constraints in their daily lives. The current context of an economic crisis is worsening this situation. The problems of unemployment and impoverishment are compounded by public disinvestment, especially in public transport services, with rising prices and reductions in the service provided.
VI. LOGISTIC REGRESSION MODEL: INEQUALITIES IN THE USE OF THE CAR
Car use stands out in both public policies and the practices of the population in general and of employed persons in particular. We therefore looked for variables that would explain why people resort to it. Much has been suggested by the analysis we have already described: the interplay between social and spatial dynamics contributes to the decision to choose or condition car use. We reinforced these interpretations with a logistic regression exercise in which we selected variables associated with these dynamics in order to identify their relative weight in people’s choice of the car. To some extent we can thus establish the hierarchical relationships between the variables, at least in terms of their preponderance in explaining car use. Logistic regression was a particularly suitable tool for this, given that our analysis had already ascertained that these variables do not behave in a way which linearly accompanies the use of the car.
As such, in this final section we will now present a statistical logistic regression model designed to measure which independent variables condition car use (the dependent variable) most. Predictor (independent) variables can be qualitative and/or quantitative. A logistic regression enables us to measure the probability that something will happen in accordance with the influence exerted by the variables chosen as independent (Pallant, 2011; Field, 2013).
< p>For this model we selected a set of independent variables with a view to determining whether or not they contribute to the increase in car use. The main purpose of this technique was thus to identify the variables which do the most to raise the probability that people will use a car in the Lisbon Metropolitan Area. The dependent variable – in this case, a binary one – was therefore car use, with 1 representing everyone who uses cars, and 0 everyone else. After the descriptive statistical analysis presented in the previous section, it is the aim of the regression model to produce an analytical condensation of the most relevant variables which are considered as predictors of car use. For this purpose we transformed most of the used indicators into binary variablesii. We selected sociodemographic, housing-related, and territorial predictor variables. These three groups match the three blocks which were input in the regression model in that order.The first block is made up of the following variables: male gender, employed population, capacity to pay 415 eurosiii in extra expenses without resorting to loans, responsibility (of the respondent) for travel by dependents, and also a social position within the more advantaged social categories (composed of employers, executives, professionals and managers). This block also contains the quantitative variable education.iv
For the second block we selected three variables. Out of the home occupancy statuses, we selected respondents with their own home. Based on a list of ten different pieces of equipment installed in the home, we selected respondents who possessed less than five (which represent less than half from a list of ten pieces of equipment),v and turned this variable into a binary one. Finally, we used the total number of problemsvi in the home as the quantitative variable.
For the third block we used a category from the territorial typology: respondents living in rural or recent or disqualified suburban areas. We also used the public transport evaluation index: individuals were asked to evaluate public transport in the light of the following criteria: geographic coverage; frequency; timetable; speed/time; articulation with other means of transport; price; comfort. This evaluation went from 0 (Awful) to 6 (Excellent). In order to construct the index we calculated the average for the various criteria and aggregated the scores as follows: 0 (Awful) to 2 (Insufficient) – negative; 3 (Sufficient) – reasonable; 4 (Good) - positive; 5 and 6 (Very good and Excellent) – very positive.
The first comment suggested by an analysis of this model is that it is statistically significant,vii and that it explains 31% (Nagelkerke 0.310) of the variation.viii The model can calculate the probability that a car will be used by combining observed values for a set of predictor variables for that use. In predictive terms, this set can be interpreted as follows: the regression coefficient (logged odds) for car use increases by 0.847 for people with the capacity to pay for extra expenditure, and decreases by -1.104 for those who have less than five pieces of equipment in their home, and so on (table IV).
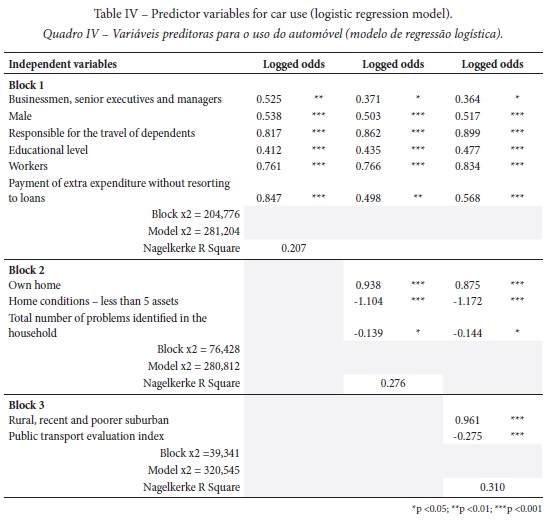
Within block 1 (sociodemographic variables), we can see that in addition to the variable capacity to pay extra expenses, another factor that contributed to increased car use was when respondents were responsible for their dependents’ travel (logged odds 0.817). It is important to note that this block is the one with the greatest weight in the model’s explanatory capacity, accounting for 20.7% out of the total 31%. This confirms the preponderance of income when it comes to explaining car use. Quite apart from anything else, there is a resource-based limitation that can prevent people from using cars.
With regard to block 2, housing-related variables, we find that while the respondents with less than five pieces of equipment contribute -1.104 to a reduction in car use probability, people with their own home raise the probability by 0.938. A person’s living conditions, which are associated with income, combine with the territory where they live: it is in the poorer and more excluded places that populations are least able to resort to the car. At the same time we can suggest that the only people who can live in places that impose car dependence are those with the ability to resort to the car, and this is related with the second part of this block. The metropolitan expansion generated by the highway urbanism that took place in the second phase of suburbanisation occurred alongside a greater ease of access to mortgage loans and thus the ability to buy one’s own home (Nunes, 2011). This means that it is in these more recently occupied areas, where home ownership is greater in relative terms, that the public transport service offers the worst conditions and the car is more widely used – a conclusion that is further strengthened by our interpretation of the last block.
In the latter, which is characterised by variables of a territorial nature, we find that the territorial typology rural, recent or poorer suburban contributed 0.961 to increased car use. As for the public transport evaluation index, the better the assessment, the more it contributes to lower car use. It therefore possesses a regression coefficient of -0.275.
When we analyse the final model we find that when some variables are input into other blocks, they lose importance as predictors of car use. Having said this, they are still significant, as is the case with more advantaged social classes, male gender and type of home occupancy, and the reduction in coefficient is not notable.
The predictor variables that stand out most with regard to an increased probability of car use include sociodemographic ones, such as professional situation – employed, and the need to move dependents around; but also characteristics of a respondent’s housing and socio-territorial situations, such as being a homeowner or living in areas that are characteristic of the territorial typology rural, recent or poorer suburban. Thus, we are talking about people who lead an active life and who possess some degree of housing stability, thus managing to have their own home in a more peripheral territory.
These data show that although the economic crisis has caused something of a reduction, the increase in private car use essentially has occurred in certain relatively advantaged groups. The truth is that there is now a larger gap between them and the more vulnerable populations, whose dependence on public transport is not only enormous, but also especially problematic in more peripheral areas, where the offer of public transport is both less and limited. This situation is unsustainable in terms of an effective mobility policy. The answer must include greater investment in means and networks of public transport, instead of continuing to primarily favour the private car – a policy that ends up privileging the more advantaged social groups.
VII. CONCLUSIONS
The generalisation of car use, made possible or even promoted by the urban policies of the last few decades, is founded on deep-rooted systemic and cumulative inequalities. In the last twenty years the AML’s expansion has been constructed on the basis of an increase in the use of the car, and thus on a freer but also more individualised form of urban mobility. The urban consolidation process continues to go hand-in-hand with a greater use of public transport and a reduction in the time taken by commuting. The professional qualification of the population in some of these areas contradicts this trend and tends to lead to private mobility. The mobility possibilities of the social groups that are most dependent on public transport are more constrained, but these groups are simultaneously the ones that engage in more sustainable and collective ways of living in the city.
Urban centres in general, and Lisbon in particular, tend to offer the most vulnerable social groups better territorial resources, be it in the shape of a more developed public transport system, or because they reduce the need for mobility by concentrating job opportunities, services and various kinds of facilities. However, the official statistics only refer to the employed and student population, and a number of territories in the AML are facing the challenge posed by the mobility needs of a large contingent of people who are older and often conditioned by lower levels of physical and financial capacity to access transport, be it public or private.
We sought to lift this veil of invisibility shrouding social inequalities in the mobility field, which are particularly evident in the information from the Localways project questionnaire. The inequalities derived from mobility issues are reflected in greater restrictions on the most vulnerable social groups in terms of their access to participation in the metropolitan space. This is especially true of the unemployed, working women with fewer qualifications, and the elderly population. Founded as they are on practices that are identifiable in terms of the means people use to travel, the distances they cover and the time it takes them to do so, mobilities contribute to more or less difficult daily life experiences that have marked effects on these groups.
It is therefore possible to make a useful contribution by providing information that is otherwise either not collected – the case of the mobility of elderly and unemployed persons, for example – or simply not analysed, as in the case of employed women. These groups, which are already more vulnerable, are also excluded from the planning process itself. Mobility is an important element in the overall picture, and its territorial nature can either worsen, or on the contrary help improve, an already unequal situation. This is the level at which mobility and spatial planning policies must play a more decisive role, recognising and opposing the unequal effects of the recent decades in which the use of the car has been favoured. Thus, this makes the need to implement policies that strengthen public transport (diversifying networks and connections) urgent, enabling greater equality in access to the means of available transportation, and in turn reducing society's dependence on the use of the automobile.
The analysis we have described in this article sought to define different mobility patterns, using a set of variables whose interaction with one another influences the means of transport people use. We can clearly see that the possibility of using a car usually means spending less time on daily travel, but also implies more costs. To put it another way, private car use is rewarding for certain more advantaged social groups, not only because it means spending less time travelling, but also because it is more comfortable, for example. However, this situation is unsustainable in both social and environmental terms. This is why there is a fundamental need to reverse the tendency of the last few decades and invest in a policy of generalising public transport, in such a way that the private car gradually becomes a complementary means of organising daily mobility, and in the long-term stops playing the dominant role in the intense mobility/transport flows that currently criss-cross the AML.
ACKNOWLEDGMENT
This work was supported by the Portuguese Fundação para a Ciência e a Tecnologia (PTDC/ATP-EUR/5023/2012).
An individual doctoral thesis funded by the FCT (reference SFRH/BD/71997/2010) was developed in articulation with the LOCALWAYS project. This thesis was conducted by Sofia Santos and supervised by the IR of this project, Renato Miguel do Carmo. It was finished in the end of 2015.
REFERENCES
Ascher, F. (2010). Novos Princípios do Urbanismo seguido de Novos Compromissos Urbanos [New Principles of Urbanism followed by New Urban Commitments]. Lisbon: Livros Horizonte. [ Links ]
Barroso, M. (2013). Qualidade de vida profissional em contextos organizacionais no Norte e Sul da Europa [Quality of professional life in organizational contexts in Northern and Southern Europe]. Lisboa: PhD Thesis, Instituto Universitário de Lisboa. [ Links ]
Beirão, G., & Cabral, J. (2007). Understanding attitudes towards public transport and private car: a qualitative study. Transport Policy, 14, 478-489. [ Links ]
Cachado, R. A., Carmo, R. M., Ferreira, D., & Santos, S. (2017). Usos e meios de transporte na Área Metropolitana de Lisboa: uma abordagem qualitativa da mobilidade [Uses and means of transport in the Lisbon Metropolitan Area: a qualitative approach to mobility]. Análise Social, 223(LII), 392-415. [ Links ]
Camarero, L., & Oliva, J. (2008). Exploring the social face of urban mobility: daily mobility as part of the social structure in Spain. International Journal of Urban and Regional Research, 32, 344-362. [ Links ]
Canzler, W., V. Kaufmann, & Kesselring, S. (Ed.) (2008). Tracing Mobilities: Towards a Cosmopolitan Perspective. Aldershot: Ashgate.
Cardoso, R., & Breda-Vázquez, I. (2007). Social Justice as a guide to Planning Theory and Practice: Analysing the Portuguese Planning System. International Journal of Urban and Regional Research, 31(2), 384-400. [ Links ]
Carmo, R. M., Rio, C., & Medgyesi, M. (Eds.) (2018). Reducing Inequalities: a Challenge for the European Union? London: Palgrave Macmillan. [ Links ]
Carmo, R., & Simões, J. (Org.) (2009). A Produção das Mobilidades. Redes, Espacialidades e Trajectos [The Production of Mobility. Networks, Spatialities and Trajectories. Lisbon]. Lisboa: Imprensa de Ciências Sociais. [ Links ]
Cass, N., Shove, E., & Urry, J. (2005). Social exclusion, mobility and access. The Sociological Review, 53(3), 539-555. [ Links ]
Castells, M. (1977). The Urban Question. A Marxist Approach. London: Edward Arnold. [ Links ]
Church, A., Frost, M. & Sullivan, K. (2000). Transport and Social Exclusion in London. Transport Policy, 7, 195-205. [ Links ]
Costa, N. (2007). Mobilidade e Transporte em Áreas Urbanas. O caso da Área Metropolitana de Lisboa [Mobility and Transportation in Urban Areas. The case of the Lisbon Metropolitan Area]. PhD Thesis, Universidade de Lisboa. Lisboa: Universidade de Lisboa. [ Links ]
Cresswell, T. (2006). On the Move. Mobility in the Modern Western World. New York: Routledge. [ Links ]
Elias, W., Benjamin, J. & Shiftan, Y. (2015). Gender differences in activity and travel behavior in the Arab world. Transport Policy, 44, 19-27. [ Links ]
Fainstein, S. (2009). Spatial Justice and Planning [electronic version]. Spatial Justice 01. Retrieved from: http://www.jssj.org/wp-content/uploads/2012/12/JSSJ1-5en1.pdf [ Links ]
Featherstone, M. (2005). Introduction. In M. Featherstone, N. Thrift, & J. Urry (Eds.), Automobilities (pp. 1-24). London: Sage Publications. [ Links ]
Field, A. (2013). Discovering Statistics using IBM SPSS Statistics. 4th edition. London: Sage. [ Links ]
Fol, S., Dupuy, G., & Coutard, O. (2007). Transport policy and the car divide in the UK, the US and France: beyond the environmental debate. International Journal of Urban and Regional Research, 31(4), 802-18. [ Links ]
Grant, J. (2013). Suburbs in transition. Planning Theory & Practice, 14(3), 391-415. [ Links ]
Hall, T. (2006). Urban Geography. New York: Routledge. [ Links ]
Harvey, D. (1973). Social Justice and the City. Oxford: Blackwell. [ Links ]
Hine, J., & Grieco, M. (2003). Scatters and clusters in time and space: implications for delivering integrated and inclusive transport. Transport Policy, 10, 200-306. [ Links ]
Instituto Nacional de Estatística (INE). (2003). Movimentos pendulares e organização do território metropolitano: área metropolitana de Lisboa e área metropolitana do Porto: 1991/2001 [Commuting movements and organization of the metropolitan territory: metropolitan area of Lisbon and metropolitan area of Porto: 1991/2001]. Lisboa: Instituto Nacional de Estatística. [ Links ]
Instituto Nacional de Estatística (INE). (2004). Tipologia socioeconómica das Áreas Metropolitanas de Lisboa e do Porto – 2001 [Socioeconomic Typology of the Metropolitan Areas of Lisbon and Porto – 2001]. Lisboa: Instituto Nacional de Estatística. [ Links ]
Instituto Nacional de Estatística (INE). (2014). Tipologia socioeconómica das Áreas Metropolitanas de Lisboa e do Porto – 2011 [Socioeconomic Typology of the Metropolitan Areas of Lisbon and Porto – 2011]. Lisboa: Instituto Nacional de Estatística. [ Links ]
Jackson, E. (2012). Fixed in mobility: young homeless people and the city. International Journal of Urban and Regional Research, 36(4): 725-41. [ Links ]
Jaffe, R., Klaufus, C. & Colombijn, F. (2012). Mobilities and mobilizations of the urban poor. International Journal of Urban and Regional Research, 36(4), 643-54. [ Links ]
Kaufmann, V., Bergman, M. & Joye, D. (2004). Motility: Mobility as Capital. International Journal of Urban and Regional Research, 28(4), 745-756. [ Links ]
Lefebvre, H. (1974). La Production de l’Espace [The Production of Space]. Paris: Anthropos. [ Links ]
Manderscheid, K. (2009). Unequal Mobilities. In T. Ohnmacht, H. Maksim & M. Bergman (Eds.) Mobilities and inequality (pp. 27-50). Cornwall: Ashgate. [ Links ]
Martens, K. (2006). Basing Transport Planning on Principles of Social Justice. Berkeley Planning Journal, 19, 1-17. [ Links ]
Motte-Baumvol, B., Bonin, O., Nassi, C. & Belton-Chevallier, L. (2016). Barriers and (im)mobility in Rio de Janeiro. Urban Studies, 53(14), 2956-2972. [ Links ]
Nunes, J. (2011). Florestas de Cimento Armado. Os Grandes Conjuntos Residenciais e a Constituição da Metrópole de Lisboa (1955-2005) [Armed Cement Forests. The Great Residential Suites and the Constitution of the Metropolis of Lisbon (1955-2005)]. Lisboa: Fundação Calouste Gulbenkian. [ Links ]
Oliveira, C. (2014). Still driven – Mobility patterns and gender roles in Portugal. CIES e-Working Paper, n.º 185/2014, Lisboa: Centro de Investigação e Estudos de Sociologia, Instituto Universitário de Lisboa (CIES-IUL). [ Links ]
Ohnmacht, T., Maksim, H., & Bergman, M. (Eds.) (2009). Mobilities and inequality. Cornwall: Ashgate. [ Links ]
Pacione, M. (2009). Urban Geography: a global perspective. London: Routledge. [ Links ]
Padeiro, M. (2012). Conciliar os transportes e o ordenamento urbano: avanços recentes e aplicabilidade em áreas metropolitanas portuguesas [Reconciling transport and urban planning: recent advances and applicability in Portuguese metropolitan áreas]. Cidades, Comunidades e Territórios, 25, 1-20. [ Links ]
Pallant, J. (2011). SPSS Survival Manual, a step by step guide to data analysis using SPSS. 4th edition. Australia: Allen & Unwin. [ Links ]
Pereira, M., & Silva, F. N. (2008). Modelos de Ordenamento em confronto na área metropolitana de Lisboa: cidade alargada ou recentragem metropolitana? [Comparative Planning Models in the metropolitan area of Lisbon: enlarged city or metropolitan refurbishment?]. Cadernos Metrópole, 20, 107-123. [ Links ]
Perista, H. (2002). Género e trabalho não pago: os tempos das mulheres e os tempos dos homens [Gender and Unpaid Work: Women's Times and Men's Times]. Análise Social, XXXVII(163), 447-474. [ Links ]
Preston, J. (2009). Epilogue: Transport policy and social exclusion - Some reflections. Transport Policy, 16, 140-142. [ Links ]
Salgueiro, T. (2005). Transformação urbana [Urban Transformation]. In T. Salgueiro, & J. Ferrão (Eds.), Geografia de Portugal: Sociedade, Paisagem e Cidades [Geography of Portugal: Society, Landscape and Cities], (pp. 244-258). Lisboa: Círculo de Leitores. [ Links ]
Salgueiro, T. (2001). Lisboa, Periferia e Centralidades [Lisbon, Periphery and Centralities]. Oeiras: Celta Editora. [ Links ]
Santos, S. (2016). Who are you calling sub/urban? Socio-spatial inequality and mobility in the Lisbon Metropolitan Area. Portuguese Journal of Social Science, 15(3), 387-407. [ Links ]
Souche, S., Mercier, A., & Ovtracht, N. (2015). The impacts of urban pricing on social and spatial inequalities: The case study of Lyon (France). Urban Studies, 53(2), 373-399. [ Links ]
Sheller M. (2008). Mobility, Freedom and Public Space. In S. Bergmann, & T. Sager (Eds.), The ethics of mobility. Rethinking place, exclusion, freedom and environment (pp. 25-38). Aldershot: Ashgate. [ Links ]
Sheller, M. (2005). Automotive Emotions. Feeling the car. In M. Featherstone, N. Thrift, & J. Urry (Eds.), Automobilities (pp. 221-242). London: Sage Publications. [ Links ]
Sheller, M., & Urry, J. (2006). The new mobilities paradigm. Environment and Planning A, 38, 207-226. [ Links ]
Soja, E. (2010). Seeking spatial justice. Minneapolis: University of Minnesota Press. [ Links ]
Tonkiss, F. (2005). Space, the city and social theory. Social relations and urban forms. Cambridge: Polity Press. [ Links ]
Therborn, G. (Ed.) (2006). Inequalities of the World. New Theoretical Frameworks, Multiple Empirical Approaches. London: Verso. [ Links ]
Urry, J. (2005). The ‘system’ of automobility. In M. Featherstone, N. Thrift, & J. Urry (Eds.), Automobilities (pp. 25-39). London: Sage Publications. [ Links ]
Urry, J. (2000). Sociology beyond societies. Mobilities for the twenty-first century. London: Routledge. [ Links ]
Viegas, J. M. (2004). Desafios da Mobilidade Urbana em Lisboa: As Respostas Possíveis para uma Cidade Competitiva e Sustentável [Challenges of Urban Mobility in Lisbon: The Possible Responses for a Competitive and Sustainable City]. Sociedade e Território - Revista de Estudos Urbanos e Regionais, 37/38, 90-95. [ Links ]
Viegas, J. M. (2003). Estratégias Urbanísticas e Governabilidade [Urban Strategies and Governance]. In N. Portas, A. Domingues, & J. Cabral (Eds.), Políticas Urbanas: Tendências, Estratégias e Oportunidades [Urban Policies: Trends, Strategies and Opportunities] (pp. 260-273). Lisboa: Fundação Calouste Gulbenkian. [ Links ]
Vieira, A. (1982). Os Transportes Públicos de Lisboa entre 1830 e 1910 [The Public Transport of Lisbon between 1830 and 1910]. Lisboa: Imprensa Nacional Casa da Moeda. [ Links ]
Vieira J., Moura, F., & Viegas, J. (2007). Transport policy and environmental impacts: the importance of instrumentality in policy integration. Transport Policy, 14, 421-732. [ Links ]
Data source: Instituto Nacional de Estatística - INE, 2001 and 2011 Censuses.
Recebido: outubro 2016. Aceite: setembro 2017
NOTAS
i For a more detailed analysis of the AML’s recent spatial and social trends see Santos (2016).
ii All dichotomous variables coded 1 – Yes, and 0 – Other responses.
iii This amount is basically equal to the poverty threshold in Portugal.
iv The variable education was recoded with a 3-point scale: 1 – up to year 9; 2 – complete secondary; 3 – higher education.
v Landline; mobile phone; television; computer; cable or other paid TV; internet; dishwasher; washing machine; air conditioning; domestic services.
vi Leaking ceiling or water-damaged walls, windows, or floor; lack of exposure to natural light on sunny days; noise inside the house coming from the vicinity or public space (car traffic, stores, factories, airplanes, etc.); pollution, dirt, bad smell, or other traffic- or industry-related environmental problems; difficulty in keeping the house properly warmed.
vii Omnibus Tests of Model Coefficients p<0.001.
viii The model correctly classified 75.4% of the respondents and we encountered no multicollinearity problems with the variables (VIF <5 and Tolerance > 0.2).

