


 Inglês (pdf)
 Artigo em XML
 Referências do artigo
 Enviar este artigo por email
 Citado por SciELO
  Similares em
SciELO
Similares em
SciELO 
 Permalink
I. Introduction
Ecosystem services (ES) are the contributions that ecosystems provide to human well-being (Alcamo et al., 2003; Haines-Young & Potschin, 2018). Water, indispensable for life on Earth, plays a central role in the ecosystems (Fitts, 2002; Hagemann et al., 2011). People rely on ecosystems to provide many water-related services from the supply of water for household use to the mitigation of flood damages. Brauman (2015) described hydrological services as the way terrestrial ecosystems affect freshwater resources. Water is a critical component in maintaining ecosystem functions and determines the characteristics of several ecosystem services (Coates et al., 2013).
Climate change is an alteration of climate generated by direct or indirect human activity that alters the composition of the global atmosphere, which is in addition to natural climate variability observed over a comparable period (Parry et al., 2007). Climate change is anticipated to impact all levels of biodiversity and ecosystem functioning (Bellard et al., 2014), which consequently affects the provision of ES (Brickhill, 2015). Precipitation is expected to increase globally in many river basins but will decrease in many other regions such as in the Mediterranean region. Furthermore, precipitation may increase in one season and decrease in another (Intergovernmental Panel on Climate Change, 2018). Several hydrological ES may be affected such as water supply, flood control and water quality (Veiga da Cunha et al., 2005). In other words, consideration of climate change in planning and management of water resources is crucial. Climate change projections are provided at global and continental spatial scale (Parry et al., 2007). However, these projections do not define the particular needs of sub-national plans (Trzaska & Schnarr, 2014). The effects of climate change lead to challenges for stakeholders in water resources, who need to define and implement strategies from the regional to local level, in order to reduce vulnerability (Campos et al., 2017). On the other hand, decision-makers are increasingly demanding climate information from the national to local scale in order to address the risk posed by projected climate changes and their anticipated impacts (Trzaska & Schnarr, 2014). Hence, it is important to transpose global climate information into regional or local climate information, which can assist in assessing local impacts (Flato et al., 2013). In addition, climate change adaptation may be strongly supported by nature-based solutions mainly based on land-cover adaptation options, such as forests, to support the mitigation efforts on greenhouse gases storage, but also to promote the provision of other important ecosystem services and biodiversity conservation (Folkard‐Tapp et al., 2021).
Mapping ES helps to understand how ecosystems provide services for human well-being (Burkhard & Maes, 2017). In addition, mapping is a fundamental process to understand and visualize the spatial distribution of services at local, regional, and global scale (Häyhä et al., 2015). In the past few decades, different tools and models for mapping water and hydrological services have evolved, and these advances have helped to quantify ES processes (Burkhard & Maes, 2017; Francesconi et al., 2016). These models can evaluate, track, assess and forecast the quantity, timing, and quality of water resources and, therefore, help in the water management and understanding the water cycle interactions with climate and ES (Carvalho-Santos, 2014). Different hydrological tools have been based on river basin scale for better water resource management, such as Soil and Water Assessment Tool (SWAT) (Arnold et al., 1998). SWAT is a hydrological model, developed by the US Department of Agricultural Research, physically based, deterministic and semi-distributed model to assess the impact of management and climate on water supplies and non-point source pollution in the watershed, in small to large river basins. It commonly operates on a daily time step, and it is used for routing runoff and chemicals through a watershed, and routing flows through streams and reservoirs over long periods (Arnold & Fohrer, 2005). Since SWAT was created in the early 1990s, it is being recognized as an integrated tool for multi-disciplinary studies at the regional scale in different physiographic and climatic conditions and is now one of the most widely applied river basin-scale models. For instance, SWAT was applied for multiple topics such as nutrients and conservation analysis, climate change impact, land-use change impact, impoundments and wetlands, irrigation, bioenergy crops, and combined climate and land-use change impacts (Krysanova & White, 2015). Additionally, SWAT has been used as an effective tool for mapping water ES (Francesconi et al., 2016). At the beginning, this model was only being applied in the United States; however, it has been popularized around the world. Portugal is a clear example of SWAT application, and it has been applied for different regions such as in the north (Carvalho-Santos et al., 2016a; 2017), and in the centre and south (Nunes et al., 2008).
The Mediterranean region, particularly Portugal, is highly susceptible to climate change (Bangash et al., 2013; Giorgi, 2006), with already some summers suffering water stress and droughts which results in less water availability (Nunes et al., 2008). The general objective of this research was to evaluate how future climate change may influence the provision of water related ecosystem services in the watershed of the River Homem (northwest Portugal), aiming to support decision-making for knowledge-based watershed management. The water related ES quantified were: i) water supply (provisioning service), ii) water timing, and iii) soil erosion control (regulating services). Two specific objectives were established and addressed in sequence: (a) to assess and map the baseline status of water ES provision at the watershed scale; and (b) to simulate how future climate change will potentially affect the provision of water related ES. The Homem watershed is very valuable for the preservation of water resources and biodiversity conservation. Therefore, it is essential to map, quantify and monitor the current water ecosystem services and to assess the effects of climate change at the local scale.
II. Data and methods
1. Study Area
The Homem watershed, located in the Peneda-Gerês National Park, has an approximate area of 257km2 and is one of the main tributaries of the Cávado River. Average precipitation varies from 1600mm/year (Caldelas station), located in the valley, and 2100mm/year (Portela do Homem station) in the highlands, with heavy precipitations from October to April (autumn-winter) (Sistema Nacional de Informação de Recursos Hídricos [SNIRH], 2019). Topography ranges from 21m to 1508m (fig. 1). Slope ranges in classes from 0-10%, 10-25% and >25% in 20%, 36% and 44% of the watershed territory, respectively. The geological landscape is strongly marked by granites massif and small bands of schist, and five main soil types (fig. 2) characterizing the watershed: Humic Regosols (43%), Eutric Leptosols (26%); and the rest (29%) are Dystric Antrosols, Fluvisols and Urban.
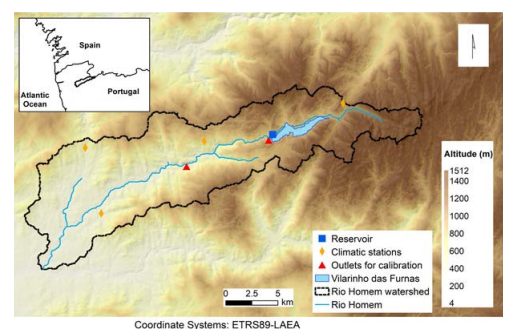
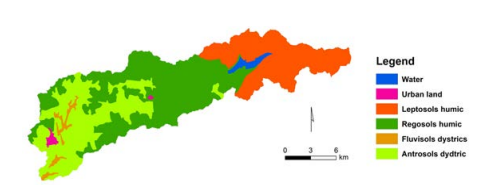
Fig. 2 Soils classification of the Homem watershed. Source: Ministry of Agriculture, performed by Agroconsultores & Geometral (1995)
Concerning land cover/use, the Homem watershed is highly influenced by the Vilarinho das Furnas reservoir, in particular by the presence of the mountainous and natural landscape upstream, the reservoir and the lowlands downstream, the reservoir where urban, forest and agricultural areas prevail. The top of the mountains is associated with open areas of bare rock and sparsel vegetation. Shrublands with scattered woodland areas occupy the medium and high altitudes of the mountains. At lowlands, traditional agricultural land is associated with forest areas of European oak (Quercus robur), Eucalypts (Eucalyptus globulus), and Maritime pine (Pinus pinaster). At the margins of the watershed, urban areas are established mainly in downstream areas, but usually with low density (fig. 3 and table I). The Homem watershed is highly valuable for biodiversity protection. More than 50% is part of the European Union (EU) Natura 2000 network (European Commission, 2000), and is included in the Peneda-Gerês National Park, where there are ecosystems in their natural state, with little or no human influence, integrated into a humanized landscape. The Vilarinho das Furnas dam reservoir is located in the Homem watershed, originating in the Gerês mountains, having taken its name due to the village that today is submerged by its reservoir. The dam of Vilarinho das Furnas is used mainly for the generation of electric power.
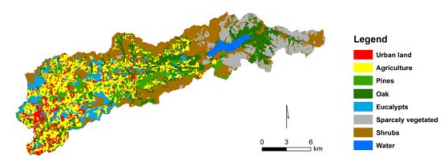
Table I Land cover classes and respective percentage of occupation used in SWAT.
| SWAT Class | Identification | Major vegetation species | % |
|---|---|---|---|
| MIGS | Atlantic grass shrubland & Atlantic forest shrubland | Heath (Erica spp.) and other shrubs | 25.8 |
| CORN | Agriculture - Corn (60%) and Pasture (40%) | Corn and wheat | 20.5 |
| OAK | Oak and other broadleaved trees | Quercus robur, Quercus pyrenaica | 15.7 |
| BSVG | Baren rock and sparsely vegetated | Heath (Erica spp.) and dry perennial grasslands | 12.0 |
| PINE | Pines | Pinus pinaster | 10.0 |
| EUCL | Eucalypts | Eucalyptus globulus | 8.0 |
| URLD | Urban low density | 7.5 | |
| PRAD | Pasture | Grasses and other herbaceous plants | 0.5 |
| TOTAL | 100.0 |
Source: DGT - General Direction of Territory (2007)
2. SWAT Hydrological model and input datasets
2.1. Inputs of SWAT
SWAT is a conceptual, continuous-time (monthly and daily) model that predicts the impact of water management, sediment, and chemical yields in watersheds (Arnold & Fohrer, 2005). The watershed is divided into unique homogeneous areas of slope, soil, and land cover, called Hydrological Response Units (HRU). Each HRU simulates several hydrological processes, including canopy interception, partitioning of precipitation between surface runoff and infiltration, redistribution of water within the soil profile, evapotranspiration, lateral subsurface flow from the soil profile, and return flow from shallow aquifers.
First, a watershed is delimited and divided into multiple sub-basins using a digital elevation model (DEM), which are then further subdivided into HRU. DEM was used with 25 meters of grid resolution provided by the Copernicus Programme (2016). Land cover classes from the original dataset were aggregated into eight major groups, representing the similarities in terms of hydrological traits, e.g., separating different forest types such as pines, eucalypts, and oaks (table I). Five major soil groups were used (fig. 2). The general parameterization of vegetation and soil was based on previous SWAT studies in Portugal (Carvalho-Santos et al., 2016a, 2017; Nunes et al., 2008).
Model setup was done using the ArcSWAT 2012.10.21 interface for ArcGis (Winchell et al., 2013). To delineate the watershed, DEM was used, resulting in 11 sub-basins. Then, slope, land cover and soil data (table II) were applied for model parameterization, resulting in 454 HRUs (threshold not used to maintain the number of combinations and integral HRU). Slope classes were based on previous SWAT studies (Carvalho-Santos et al., 2016a; 2017), so it was divided into three classes, defined in order to represent the differences of this variable in the watershed: 0-10%; 10-25%; and >25%.
Table II Input datasets of SWAT.
| Variables | Source | Description |
|---|---|---|
| DEM | Copernicus Programme (2016) | Version v1.1. with 25m resolution grid |
| Land cover - COS 2007 | DGT - General Direction of Territory (2007) | Divided into 8 main land cover classes |
| Soil | Ministry of Agriculture, performed by Geometral Agroconsultores (1995) | Soil map 1:100 000 Divided in 5 main soil types (Humic Regosols, Humic Leptsols, Dystrics Fluvisols, Antrosols and Urban) |
| Precipitation | Hourly precipitation values (mm) turned into daily values: Calibration period 2002-2009 (4-year initialization period) Validation (1995-2002) | |
| Maximum and minimum temperature | Hourly temperatures values (°C) were converted into maximum and minimum values | |
| Solar radiation Relative humidity Wind speed | SNIRH - National Hydrological Resources Information System (SNIRH, 2019) | Daily values of wind speed (m/s), relative humidity (%) and solar radiation (Watts) |
| Daily river discharge at Covas | Hourly discharge values (m3/s) turned into daily values; Calibration period 2006-2009 (4-year initialization period) Validation (2000-2003) | |
| Monthly reservoir volumes at Albufeira Vilarinho das Furnas | Monthly Reservoir volume (m3) | |
| Monthly discharge at Albufeira Vilarinho das Furnas | EDP | Environmental flow for twelve months |
Subsequently, daily climatic datasets (1995-2009) were used from four precipitation stations inside the watershed (Caldelas, Cibões, Portela do Homem and Portela do Vade), and one climatic station (Ponte da Barca) outside (8km) for other climatic parameters (temperature, solar radiation, relative humidity, and wind speed). Precipitation data were collected from SNIRH in hourly values and then was converted into daily data. Days with less than 20-hour values per day were considered as a gap that was further filled based on a regression analysis method. Regression was chosen because of the high coefficient of determination (R2 above 0.9) among neighbouring stations, such as Bouca, Cabana, Casal, and Leonte.
Moreover, the land cover class MIGS was defined as grass shrubs and forest shrubs (table I). Also, the class CORN was divided into 60% corn and 40% pasture (permanent grassland), according to traditional agricultural practices in the region. In addition, two management operations were applied for corn and pasture based on knowledge and fieldwork on crop management practices in the watershed. For corn, first a tillage operation was applied at the middle of April, followed by a model-managed fertilization, based on soil N deficiency, with 20-20-00 fertilizer (250kg/ha maximum) starting at the end of April. Then, auto-irrigation and auto-fertilization were applied in the first two days of May. Finally, harvest operations were applied in September. In December a tillage operation for winter pasture was applied, which is finally harvested in late March to start again the corn cultivation. For the class PRAD, two management operations were implemented, growing pasture in January, and a harvesting operation on the first day of June.
For reservoir parameters, the total and useful capacity of the reservoir and different water volumes for principal and emergency spillway were based on SNIRH data. Maximum daily outflow for the month (m3/s) was based on the environmental flows stablished by EDP (Portuguese electric company). The beginning of the month of the non-flood season was established in May and the ending month was in October, so the model can realistically simulate major high and low flows periods.
2.2. SWAT calibration and validation
Calibration is the process of changing sensitive parameter values to reduce variation between observed and simulated values (Moriasi et al., 2007). The model was forced with daily climatic parameters (precipitation, maximum and minimum temperature, solar radiation, relative humidity, and wind speed). SWAT calibration was applied for the period 2006-2009, including a four year model warm-up (2002-2005). A warm-up period of four years was used to minimize the impacts of uncertain initial conditions. Manual calibration was made for sensitive parameters against daily and monthly discharge (m 3 /s) at Covas and monthly reservoir volume (m3) at Vilarinho das Furnas. The parameters changed to improve model performance were (table III), being USLE_K parameter for the northwest of Portugal (0.02) based on Panagos et al. (2014).
Table III Modified SWAT general parameters for the Homem watershed.
| Parameters | Description in SWAT | Initial value | Calibration |
|---|---|---|---|
| Groundwater GW_DELAY | Groundwater delay time (days) | 31 | 1 |
| RCHRG_DP | Deep aquifer percolation fraction | 0.5 | 0 |
| Cn2 | Curve number for moisture condition II | Various | -10 |
| Reservoir WURESN | Monthly average of water withdrawn from reservoir for consumptive use (104m3) | 0 | January to February (5), March to April (11), May (20), June to July (50), August (25), September (15), October (25), November (30), December (4) |
| Soil USLE_K | Erodibility factor | 0.23 | 0.02 |
Validation process for discharge and reservoir volume was applied for 1995-2003 using the same parameters from the calibration process. Model performance was measured using statistical methods in hydrological modelling such as the coefficient of determination R2, the percent bias (PBIAS%) and the Nash-Sutcliffe coefficient (NSE). Additional information about the corresponding equations and the scale of goodness can be found in Moriasi et al. (2007).
3. Climate change scenarios
According to Du et al. (2019), several works recommended to include a number of climate models and various greenhouse gas emission scenarios or Representative Concentration Pathways (RCP) to assess climate change impacts on hydrology and water quality. Hence, the future climate projections for this study were obtained from four realizations of the SMHI-RCA4 Regional Climate Model driven by four Global Climate Models (GCMs) providing boundary conditions for regional simulations. Regional simulations were based on the European Coordinated Regional Climate Downscaling Experiment (EURO-CORDEX, http://www.euro-cordex.net/), which is the European branch of the international CORDEX initiative. The four driving GCMs, namely CNRM-CM5, EC-EARTH, IPSL-CM5A-MR and MPI-ESM-LR, belong to the ensemble of models used as a basis in the Fifth Assessment Report of the IPCC and are part of the Coupled Model Intercomparison Project phase 5 (CMIP5). Future projections considered two representative concentration pathway (RCP) scenarios, which are RCP4.5 and RCP8.5 (Leong et al., 2017). The RCP4.5 scenario is the stabilization of the radiative forcing at 4.5W/m2 before 2100 by applying a range of strategies and technologies to reduce the emission of greenhouse gases. In contrast, the RCP8.5 scenario is a very high greenhouse gases emission scenario, with a rising radiative forcing pathway reaching 8.5W/m2 by 2100.
For this study, we considered the following RCA4 model variables extracted over the region in interest: daily maximum and minimum temperature, precipitation, surface downwelling shortwave radiation and relative humidity. The temperature and precipitation data have been bias-adjusted considering as a reference the observed climatology data of E-OBS (Haylock et al., 2008), available for the European domain at 0.25 degrees (~25km) from 1970 up to 2005. The bias adjusted temperature and precipitation data were further downscaled using orographic (lapse-rate) correction for the former and a stochastic downscaling method, RainFARM (D’Onofrio et al., 2014; Terzago et al., 2018) for the latter. We recall that these datasets were produced in the framework of the ECOPOTENTIAL project (http://www.ecopotential-project.eu/).
Data from the four regional climate models have been used to project future changes under the RCP4.5 and RCP8.5 scenarios in the medium time horizon 2020-2050 and to reproduce past conditions as a guideline with input of the “historical” model data over 1970-2000.
III. Results and discussion
1. SWAT model performance
The daily simulated river discharge values at Covas fit well with the observed data in the calibration and validation periods. SWAT was able to capture and reproduce the average flows and seasonal variations in the Homem watershed, except during high flows and extreme conditions, as it was the case for the periods between the end of 2000 to the first months of 2001, and the final months of 2002 to the beginning of 2003 (fig. 4b). During the monthly calibration period (fig. 4a), performance values were: NSE=0.77, R2=0.88, and PBIAS=24%, as shown in table IV. The monthly simulated discharge was considered to be very good for values of NSE>0.75, also considered satisfactory for R2>0.6 values, and for PBIAS<25%, according to Moriasi et al. (2007) standards. For daily simulated discharge, PBIAS daily=24%, which is considered good, but R2=0.64 and NSE=0.32, which was considered only satisfactory (fig. 4c). The same performance repeats for validation period (2000-2003), except for daily validation performance, in which R2=0.47 and it was considered satisfactory (fig. 4d). This variation can be partially explained by the under representation of precipitation, which was collected once per day (9:00 am) before 2003. Since the middle of 2003, climatic parameters, especially precipitation, have been quantified hourly by automatic stations and this may influence the quantity of rain inputted into the model, being more representative. As it was expected, model performance for the validation period was typically lower than calibration, which is a pattern for previous studies (Engel et al., 2007).
For an ideal calibration, Gan et al. (1997) recommended that a calibration period should use three to five years of data that includes average, wet, and dry years. For the current study, the calibration period was between 2006 to 2009 (four years) and had dry years (2007 and 2009), and wet years (2006), so these hydrologic events had activated all model constituent processes during the calibration period.
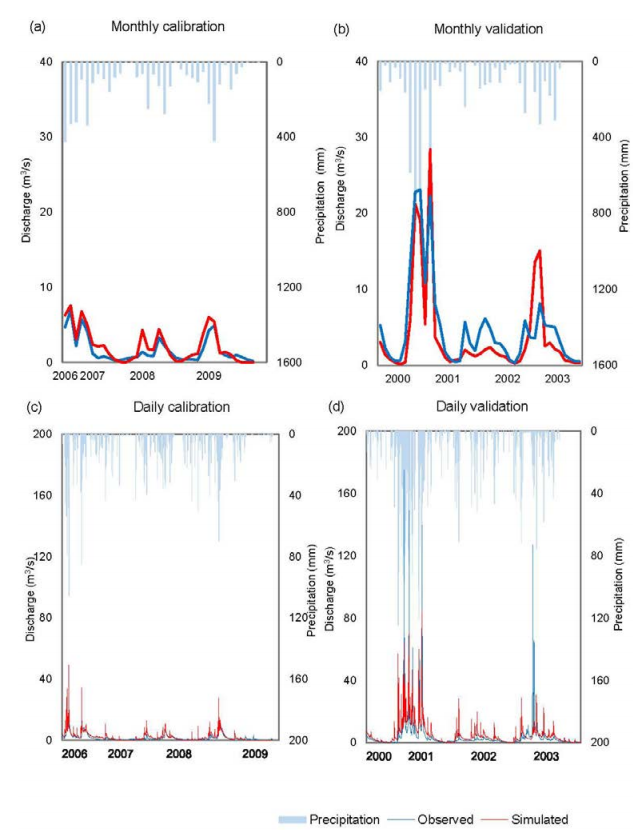
Fig. 4 SWAT calibration (2006-2009) and validation (2000-2003) discharge at Covas: (a) Monthly calibration, (b) Monthly validation, (c) Daily calibration, (d) Daily validation.
The monthly reservoir volume simulated by the SWAT model was in good agreement with observed data. The modelling performance is shown in table IV. For calibration, the R2 was >0.5, and it was considered acceptable. NSE=0.65 was considered as satisfactory, and PBIAS=7% considered very good (Moriasi et al., 2007). The validation period (2000-2003) was considered as unsatisfactory for PBIAS=34%, and acceptable for NSE=0.64 and R2>0.5. Possible reasons for these differences between calibration and validation period can be the lack of data, especially precipitation, and the lower quality of volume data in Vilarinho das Furnas reservoir for the validation period. Besides, extreme precipitation from 2000 to 2001, considered wet years, could possibly affect volume data for the validation period due to bad representation. We assume that observed data may be not representative.
Table IV Calibration and validation goodness-of-fit statistics for discharge and reservoir’s volume SWAT model.
| Discharge | Reservoir | |||||
|---|---|---|---|---|---|---|
| Calibration (2006-2009) | Validation (2000-2003) | Calibration (2006-2009) | Validation (2000-2003) | |||
| Monthly | Daily | Monthly | Daily | Monthly | Monthly | |
| R2 | 0.88 | 0.64 | 0.77 | 0.47 | 0.64 | 0.65 |
| PBIAS (%) | 24 | 24 | 22 | 21 | 7 | 34 |
| NSE | 0.77 | 0.32 | 0.76 | 0.47 | 0.64 | 0.64 |
2. Mapping ES
SWAT results were mapped for ES representation at sub-basin scale. Figure 5a shows the average quantity of surface water yield at sub-basin scale. In highlands, current conditions contribute with more water quantity for the watershed, ranging between 90 to 100mm/year. These results are related to precipitation patterns in this region, with a great amount of precipitation in the highlands approximately 2100mm/year. In addition, highland areas increase surface water yield, because they are protected by the Peneda-Gerês National Park status, where they are occupied by large and dense native shrubland vegetation and deciduous forest of oak and beech, which demands less water for its growth. Moreover, highland areas are associated with bare rock and thin soils. Carvalho-Santos et al. (2016b) found the same patterns for the Vez watershed, with more quantity of water at highlands under shrubs cover (current scenario), and also mentioned that the eucalypt/pine scenario reduces the quantity of water because of its high rate of evapotranspiration throughout the year.
Sediment export values are not homogeneous at sub-basin scale (fig. 5b). This can be related to modification of the natural hydrological flows (construction of the Vilarinho das Furnas reservoir), more steepness of the terrain and more susceptibility of land cover for soil erosion. In the valley, sediments exports are high; this is potentially related to great accumulation of agricultural lands. On the other hand, at the top of the watershed, soil erosion is lower, because of its natural vegetation and type of soil, which is thinner and rockier, not prone to erosion. The spatial distribution of sediment exports (erosion) is in accordance with previous work at the watershed level by Carvalho-Santos et al. (2016b), who showed less erosion at the top of the mountains, where soil is thin and rocks prevail, and more erosion in the valley where agricultural activities prevail. However, values are lower when compared to other agricultural areas, due to the mitigation effect of terraces and traditional agricultural practices (Carvalho-Santos et al., 2016a).
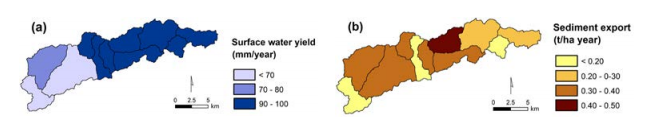
Fig. 5 (a) Average surface water yield (mm/year) and (b) Average sediment exports (t/ha year) at sub-basin scale in the Homem watershed, 2006-2009.
SWAT results have helped to model and map ES at the watershed scale, therefore proving to be an important tool for mapping, particularly water ES (Francesconi et al., 2016).
3. Climate projections (2020-2050)
Figure 6 shows the variability in average precipitation and temperature for the future (2020-2050) relative to the historic period (1970-2000) in the Homem watershed, according to four climate models with two respective climate scenarios (RCP4.5 and RCP8.5). The vertical axis in figure 6 indicates anomaly in precipitation (%), while the horizontal axis represents absolute changes in temperature (°C). The small symbols correspond to four different future scenarios (4GCMs) under two RCP4.5 and RCP8.5. In general, the temperature is expected to increase, and precipitation will decrease, although one climate model forecast more rain compared to the historic period. The average temperature will increase about 1 to 1.5°C under RCP8.5. However, precipitation predictions differ from each model because of the uncertain range in the seasonal variability. The reduction of precipitation and the increase of temperature are similar with previous studies in Portugal (Carvalho-Santos et al., 2017; Lobanova et al., 2016; Nunes et al., 2008; Veiga da Cunha et al., 2005). In addition, seven of eight projections predict a decrease in precipitation approximately to 5 to 20%, except the EC-EARTH RCP4.5 scenario that shows an increase in precipitation patterns of about 5%. This uncertainty between models is inherent in future projections (Trzaska & Schnarr, 2014).
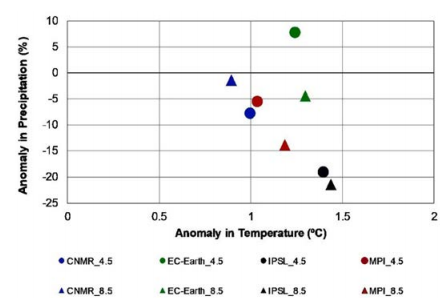
Fig. 6 Variability of the four global climate models (CNRM-CM5; EC-EARTH; IPSL-CM5A and MPI-ESM-LR) under RCP4.5 and RCP8.5 scenarios, related to changes in precipitation (%) and temperature (°C) for 2020-2050 compared with 1970-2000. Source: Carvalho-Santos et al. (2019)
4. Future water ES supply
4.4.1. Water supply quantity
SWAT ran for a monthly and daily time step to simulate water ES under future scenarios. Projections were simulated for each climate model in SWAT (daily runs) separately, but results were presented as ensemble. From this ensemble of model outputs, total annual surface water yield (mm) was calculated to represent the quantity of water available for supply. The quantity of water is expected to decrease by 5% under RCP4.5 and 7% under the RCP8.5 for the period 2020-2050 (table V).
Table V Future climate effects on water ecosystem services under RCP4.5 and RCP8.5 scenarios for 2020-2050, comparing with historic period 1970-2000 (ET - evapotranspiration).
| Water supply quantity | Water timing and flooding | Soil erosion control | ||||
|---|---|---|---|---|---|---|
| ET (mm) | Total annual yield (mm) | % climate change effect | Q5 (m3/s) | Q95 (m3/s) | Average sediment export (ton/ha year) | |
| Historic | 333.60 | 891.88 | 8.85 | 0.18 | 0.13 | |
| RCP4.5 | 327.45 | 853.42 | -5 | 8.31 | 0.09 | 0.19 |
| RCP8.5 | 322.33 | 836.74 | -7 | 7.73 | 0.10 | 0.23 |
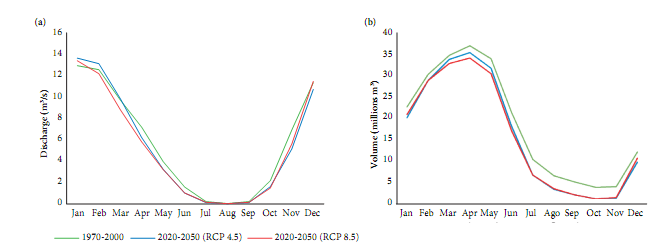
These results are similar with two SWAT studies; the first, in the northwest of Portugal, for the Vez watershed, predicted 2% of reduction for 2021-2040, and 7% for 2041-2060 (Carvalho-Santos et al., 2016a); and the second, in Galicia, predictions showed a decrease in annual discharge of about 6.03% and 12.68% for two scenarios though for another period (2071-2100) (Raposo et al., 2013). These effects are highly influenced by changes in precipitation (fig. 6). According to the patterns presented before, results show a tendency to decrease in discharge under the RCP4.5 and RCP8.5, as shown in figure 7a. However, RCP4.5 barely shows an increase in winter due to more precipitation. In summer, discharge shows a stabilization in all scenarios. In other words, discharge will decrease in spring and autumn in all scenarios. It is important to mention that different climatic models show different projections, namely models CNMR-CM5 and IPSL-CM5A with more negative projections, and the two others with more favourable projections.
The volume in the Vilarinho das Furnas reservoir would be decreased under the two future scenarios, more significantly under RCP8.5 (fig. 7b). Additionally, the reduction in volume is more evident in spring, summer, and autumn for both scenarios. These models show different volume projections, namely models CNMR-CM5, IPSL-CM5A and MPI-ESM-LR with more negative projections, and the EC-EARTH with more positive projections.
These considerable reductions may decrease the hydropower production, especially in summer. Other studies in Portugal using the SWAT model, project a decrease in reservoir volume in Serra Serrada reservoir, more drastic in summer under RCP4.5 for the period 2041-2060 (Carvalho-Santos et al., 2017). Also, projections in the Fratel reservoir show an annual reduction (-10%) of hydropower production for 2021-2050 under RCP4.5 (Lobanova et al., 2016).
4.2. Water timing and flooding
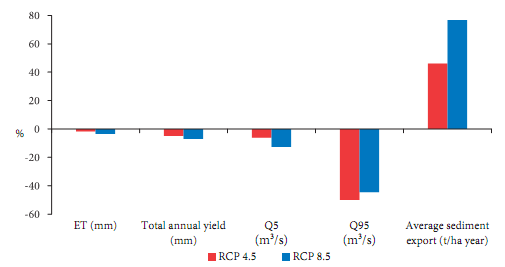
Q5 and Q95 for future climate scenarios were obtained from a flow duration curve (a cumulative frequency curve that shows the percent of time specified discharges were equalled or exceeded during a given period - exceedance probability), in which Q5 represents the high flows, meaning the flow rate that is equalled or exceeded for 5% of the time, and Q95 represents the low flows. Low flows can be a proxy indicator of water timing related to the supply of water for irrigation during the dry period of summer. Climate change will cause a reduction of low flows, of about 50% reduction comparing to the historical value for low flows, particularly in RCP4.5. The consequences of this discharge reduction in the river during summer are unpredictable, with possible constraints on the habitat for freshwater species and habitats. There is also a decreasing trend in high flows discharge compared to the historic scenario (table V). These projections are expected to reduce by 7% and 13% under RCP4.5 and RCP8.5, respectively. This could have a positive effect on the mitigation of flood risk.
4.3. Soil erosion control
Average sediment export is projected to increase, which may be related with increasing precipitation episodes in winter with probably high intensity. In other words, soil erosion is expected to increase by 76% under RCP8.5 (fig. 8). The results are consistent with a previous study (Carvalho-Santos et al., 2016a) that predicted an increase of 34.7% for the period 2021-2040 under RCP4.5, but it was influenced by agriculture/vine scenario for the Vez watershed. Even though, the average values for soil erosion are far below of 1t/ha-1year-1, which is considered the tolerable rate of erosion considered for soil formation (Verheijen et al., 2012).
5. Adaptation strategies to climate change
As shown in our results, discharge and reservoir volume are expected to decrease in the Homem watershed. Some studies have shown that projections of climate change are full of uncertainty and our projections show the same pattern. Therefore, adaptation should involve a portfolio of response options (Zandvoort et al., 2017). Here, some adaptation strategies will be addressed, according to a scheme adapted from Cross et al. (2012), grouped by forests, agriculture, reservoir, and riparian vegetation (fig. 9). In fact, land-cover adaptation is the effective and actual response to adapt for the undeniable effects of climate change.
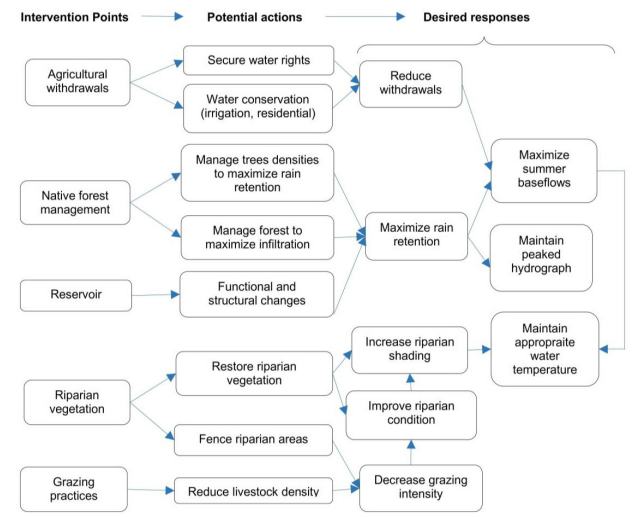
Fig. 9 Adaptation strategies for future climate in the Homem watershed. Source: adapted from The Adaptation for Conservation Targets (ACT) Framework (Cross et al., 2012)
5.1. Native Forest Management
It is widely recognized that forest areas influence water ES such as small reduction in annual water yield; however, a potential forest area increase in the Homem watershed may contribute to a decrease in surface runoff, reduction of sediment loading, an increase in infiltration rates and buffering water-related hazards, particularly floods and potentially a steadier supply of water during summer months (Carvalho-Santos et al., 2016a). Conservation strategies considering incentives for the use of native species, would be a good option to promote biodiversity and water ES. For instance, a previous study demonstrated that the oak scenario showed the best performance for the water supply service (quantity, timing, and quality) (Carvalho-Santos et al., 2016b). This is related to oaks being in a dormant state during winter months (deciduous trees), decreasing rain interception and transpiration fluxes, allowing water to either infiltrate or run to the rivers as surface runoff. Moreover, understanding the dynamics of forest systems such as the long-life span of many tree species, lag times in response under climate change, will be important to integrate into the context of climate change adaptation but considering possible trade-offs (Hagerman & Pelai, 2018).
5.2. Agricultural withdrawals
In the Homem watershed, extensive traditional farming is practiced. Climate change projections for the next decades are expected to bring important challenges to Portuguese agriculture. To face these problems, farmers need to cooperate with other farmers, and they should receive more technical support from the public agencies in charge of water resources and agriculture. If these two changes would be made, the shift from existing crops to other less water-demanding crops would be feasible. Faysse et al. (2018) remarked that Portuguese farmers and the staff from public organizations in charge of agriculture and water resource management had limited history of shared communication (south of Portugal) and mentioned that participatory analyses can be implemented in situations which may initially appear to be unfavourable. The participation of local actors (participatory analyses) in the development of adaptive management to climate change is considered as a cornerstone of its success.
5.3. Reservoir
Adapting to warmer temperatures and drier conditions are the challenges that reservoirs would face in the following decades. Vilarinho das Furnas reservoir is a grey infrastructure; however, the strategies to adapt to climate change can be based on green infrastructures such as improving the infiltration capacity and water retention with native trees to promote water ES around its zone of influence. On the other hand, several studies recommended a grey infrastructure adaptation (e.g., increase dam height to store more water during wet months). It is clear that managers have to implement climate change strategies in their current activities. Furthermore, functional changes need to be implemented to coordinate flood management, update flood criteria and develop operation models that provide flexibility during dry and wet conditions (International Commission on Large Dams, 2018).
5.4. Riparian vegetation
The riparian areas are typically biodiversity hotspots for both plants and animals. They also play a significant role in maintaining functional hydrologic regimes in watersheds and providing cool water and temperatures. In the Homem watershed, those areas have been heavily impacted by land use change and Vilarinho das Furnas reservoir, therefore are also more vulnerable to flooding and wildfire, whereas less degraded areas may be more resilient to climate-related stressors. Including climate change as a consideration in riparian management will mostly refine and prioritize, rather than transform, current practices in riparian areas. Plant communities adjacent to small springs are expected to be among the first areas affected by altered hydrology as the climate continues to warm. Riparian buffer, a current strategy, has been used for many years to reduce soil erosion, protect water from pollution, improve waterways, provide a refuge for wildlife, and provide a connected network of natural areas (Buffler et al., 2005). In fact, forest buffer strips are widely recognized to protect water supplies, especially from diffuse agricultural pollution and used as a base for payments for ecosystem services economic schemes (Valatin et al., 2022). Forest buffers efficiency is on average above 80% with width of 5m for suspended sediments reduction, but for nitrates reduction, the same 80% efficiency should require a 50m buffer width, on general terms and it should be noted that this percentage is very site-dependent (Nisbet et al., 2021).
IV. Conclusions
As shown in the results, SWAT had a good accuracy on the calibration period between observed and calibrated data for monthly volume reservoir, monthly and daily discharge. However, the performance in the validation period reduced slightly, due to the low-quality data on input precipitation data from the extremely wet winter in 2000-2001.
In general, future climate projections predict an increase in temperature in the Homem watershed, and a decrease in precipitation with remarked seasonal patterns. Climate change may influence the reduction of the total annual surface water yield, high and low flows. These effects are notably during spring and autumn. On the other hand, soil erosion is expected to increase.
The Vilarinho das Furnas reservoir water volume is projected to reduce, and the hydropower production can be severely affected by climate change conditions under the two scenarios, particularly during summer.
It is important to emphasize the relevance of our results for building adaptation strategies to mitigate climate change impacts, taking into consideration the current European Union focus on climate change adaptation. Different strategies may reduce climate change effects such as native forest plantation to promote water ES, restore riparian areas to maintain adequate water temperature, and adapt reservoir function with green infrastructures to revitalize degraded environments with native species, especially in the dam borders at the same time improving water infiltration capacity and retention.
Acknowledgments
Cláudia Carvalho-Santos is supported by the “Financiamento Programático” UIDP/04050/2020 funded by national funds through the FCT I.P.
Author contributions
Emanuel Escobar: Methodology; Software; Validation; Formal analysis; Research; Writing - preparation of the original draft; Writing - review and editing. Cláudia Carvalho-Santos: Conceptualization; Methodology; Software; Validation; Formal analysis; Research; Writing - preparation of the original draft; Writing - review and editing; Supervision; Administration.

