


Serviços Personalizados
Journal
Artigo
 Inglês (pdf)
 Artigo em XML
 Referências do artigo
 Enviar este artigo por email
Indicadores
-
 Citado por SciELO
 -
 Acessos
Links relacionados
-
 Similares em
SciELO
Similares em
SciELO
Compartilhar

 Permalink
Silva Lusitana
versão impressa ISSN 0870-6352
Silva Lus. v.18 n.Especial Lisboa dez. 2010
Evolution in Multi-Species High Forest Stands in Serra da Lousã: Diversity Analysis
Ana Cristina Gonçalves*, Ângelo Carvalho Oliveira** e Susana Saraiva Dias***
*Professora Auxiliar; E-mail: acag@uevora.pt
ICAAM. Universidade de Évora. Departamento de Engenharia Rural, Apartado 94, 7002-554 ÉVORA
**Professor Catedrático
Instituto Superior de Agronomia, Departamento de Engenharia Florestal, Tapada da Ajuda, 1349-017, LISBOA
***Equiparada a Professora Adjunta
ICAAM. Instituto Politécnico de Portalegre. Escola Agrária de Elvas, Apartado 254, 7350-903 ELVAS
Abstract
Diversity analysis has an increasing importance in the analysis of forest stands, especially in multi-species ones, as a tool to evaluate stand structure and bring to light the differences in stand development through species interactions. The diversity analysis provides more detail to the traditional stand structure descriptions and enables the approach to stand management more consistent not only with the timber production, but also with other productions and values of the multi-benefit forest stands, and/or transformation processes. In literature many diversity measures can be found. The most commonly used are the diversity indices as they allow the quantification of the diversity features. In this study eight diversity indices were used to characterize the horizontal, vertical and spatial distribution of the individuals in multi-species stands, using a series of permanent plots, located in Serra da Lousã, Central Portugal. Diversity dynamics were evaluated with two successive measurements, in 2001 and 2009. The results revealed a tendency towards more diversity with the reduction of the number of maritime pine individuals and the development of other species, mainly sweet chestnut and English oak.
Key words: Multi-species stands; high forest; diversity; dynamics
Evolução de Povoamentos Multi-Espécies na Serra da Lousã: Análise da Diversidade
Sumário
A análise da diversidade tem adquirido importância crescente na análise dos povoamentos florestais, especialmente nos de multi-espécies, como ferramenta para avaliar a estrutura dos povoamentos e destacar as diferenças de desenvolvimento originadas pelas interacções entre as espécies. A análise da diversidade fornece mais detalhe do que as descrições tradicionais da estrutura e permite uma abordagem à gestão florestal mais consistente não só com a produção de lenho, mas também de outras produções e valores das florestas de multi-benefícios e/ou os processos de transformação. Na bibliografia podem ser encontradas muitas medidas de diversidade, sendo os mais frequentemente usados os índices de diversidade dado que permitem quantificar as suas características. Neste estudo foram usados oito índices de diversidade para caracterizar a distribuição horizontal, vertical e espacial dos indivíduos nos povoamentos, usando uma série de parcelas permanentes, localizadas na Serra da Lousã. A evolução da diversidade foi avaliada a partir de duas medições sucessivas das parcelas, efectuadas em 2001 e 2009. Os resultados revelam uma tendência para o aumento da diversidade da primeira para a segunda medição, pela redução do número de indivíduos de pinheiro bravo e pelo desenvolvimento e ingresso de indivíduos de outras espécies.
Palavras-chave: povoamentos multi-espécies, alto fuste, diversidade, evolução
Évolution des Futaies Multi-Essences dans la Serra da Lousã: Analyse de la Diversité
Résumé
L'analyse de la diversité a pris une importance croissante pour l'analyse de la forêt, surtout dans les peuplements multi-espèces, comme un outil à évaluer la structure des peuplements et à mettre en évidence les différences de développement occasionnées par les interactions entre les essences. L'analyse de la diversité fournit plus de détails que la description de la structure traditionnelle et permet un abord à la gestion forestière plus adéquat, non seulement à la production de bois, mais aussi à d'autres productions et valeurs forestières des forêts multi-avantages et/ou des processus de traitement. Dans la bibliographie se trouvent de nombreuses mesures de la diversité, les plus souvent utilisés étant les indices de diversité qui permettent de quantifier leurs caractéristiques. Cette étude a utilisé huit indices de diversité pour caractériser la distribution horizontale, verticale et spatiale des arbres dans les peuplements, en utilisant une série de parcelles permanentes situées dans la Serra da Lousã. L'évolution de la diversité a été évaluée à partir de deux mesures successives, faites en 2001 et en 2009. Les résultats montrent la tendance à l'accroissement de la diversité de 2001 à 2009, en réduisant le nombre d'individus de pin maritime, le développement et l'apparition de plantes d'autres essences.
Mots clés: Peuplements multi-essences; futaie; diversité; évolution
Introduction
The traditional structure analysis does not take into account diversity. In fact, in pure and evenaged stands its evaluation has little importance. On the contrary, in multi-species and especially in unevenaged stands it is important as it enables the analysis of stand characteristics that are not caught in the traditional stand structure analysis.
According to Oliver and Larson (1996) diversity measures are important to predict the future stand growth, as growth patterns variation are related with the complexity of its structure.
In this study diversity will be evaluated at stand level (a diversity) that is the number of species in the stand, their proportion and distribution.
Species diversity is function of two main factors: number of species and their uniformity or relative abundance (Gaines et al., 1999; Pierrat, 1995). Several methods can be used to describe and evaluate diversity. One of the most used is their quantitative analysis with diversity measures, namely indices. In literature many references can be found to a set of indices (p. e. Kint, 2003; Gilliam, 2002; Nagendo et al., 2002; Neumann and Starlinger, 2001; Staudhammer and Lemay, 2001; Gaines et al., 1999; Brockway, 1998; Pitkänen, 1998; Pierrat, 1995). As they quantify different stand characteristics it is generally agreed that more than one should be used.
According to the attribute quantified diversity indices can be grouped in horizontal, spatial distribution and vertical diversity measures. The first enable the study of the number of species and their proportion in the stand, the second the study of the horizontal plane and the third, specific of stratified stands, their proportion in the vertical layers. A subdivision can also be made according to the target population being stand or species.
Old maritime pine stands, in Serra da Lousã, have regeneration of broadleaved species, namely sweet chestnut and English oak. In these stands diversity has to be considered as they are managed not only for timber production but also for recreation, ecology, diversity, aesthetics, game, etc (Gonçalves, 2003).
The analysis of the density measures in 2001 and 2009 revealed an increase in the number and dimensions of sweet chestnut and English oak. These stands are in a transformation process from pure to mixed formations. The cuttings carried out originated an increase of sweet chestnut and English oak, both due to the removal of maritime pine and the recruitment of individuals of these two species. Thus the number of individuals and basal area have different proportions in 2001 and 2009. In this study diversity evolution will be analysed with eight diversity indices and how the ongoing transformation process is affecting diversity in the stands.
Material and methods
Study area and data
Serra da Lousã is a mountain range about 250 Km northeast of Lisbon. This forest area is composed of several softwood and hardwood species, namely maritime pine (Pinus pinaster Aiton.), Douglas fir (Pseudotsuga menziesii Franco.), Mexican cypress (Cupressus lusitanica Miller.), Lawson cypress (Chamaecyparis lawsoniana Parl.), English oak (Quercus robur L.), red oak (Quercus rubra L.), wild cherry (Prunus avium L.), sweet chestnut (Castanea sativa Miller), beech (Fagus sylvatica L.) and Tasmanian blue gum (Eucalyptus globulus Labill.). It is mainly composed of maritime pine stands, pure (about 12.1% of the area) and mixed with chestnut (about 40.1%). Its altitude ranges from 200 m to 1000 m, 84.6% above 500 m. In about 60% of the area, slopes range from 15% to 35% (Gonçalves, 2003).
The maritime pine and chestnut stands are characterised by old growth maritime pine trees in the superior and intermediate layers and several softwood and broadleaved species of natural regeneration in the intermediate and inferior layer. The experimental trial has 13 plots distributed in the area of maritime pine with regeneration of broadleaved species stands, with the characteristics shown in Table 1.
Table 1 -Plot characterisation
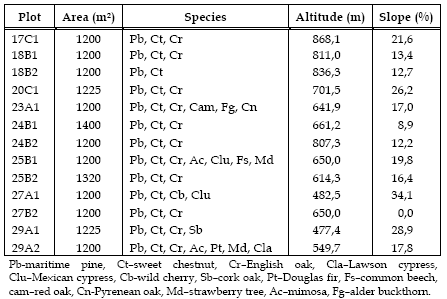
In these plots, dendrometric parameters' (diameter at breast height, total height, height of the beginning of the crown and crown radii in 4 directions, North, South, East and West) were measured for all the trees, in 2001 and 2009 as well as their coordinates in 2001.
The stands are high forest, but some coppices are present, mainly of sweet chestnut. The main stand was defined as all the individuals with diameter at breast height larger than 5 cm.
After the first measurement and in order to promote the transformation process, cuttings were done. The single tree selection cuttings carried out removed mainly maritime pine individuals, and in sweet chestnut coppices the best poles were selected to be maintained, namely for straight stems, vigorous crowns and expected high growth rates. The rate of removal was 25% of the number of individuals in plots 17C1, 18B1, 25B1 and 27B2, 17% in plots 23A1, 24B1, 24B2, 25B2 and 27A1, 10% in 18B2 and 20C1, and 1% in 29A1 and 29A2.
Methods
From the diversity indices described in literature, eight were selected (Table 2), three per stand and five per species, characterising the horizontal measures; namely species richness (RS), Simpson index (D), Shannon and Weaver index (H), relative density (INDD), relative basal area (AB); the spatial distribution two; Clark and Evans aggregation index (R) and Pielou segregation index (S); and the vertical measures one, A index (PA).
Table 2 - Diversity measures
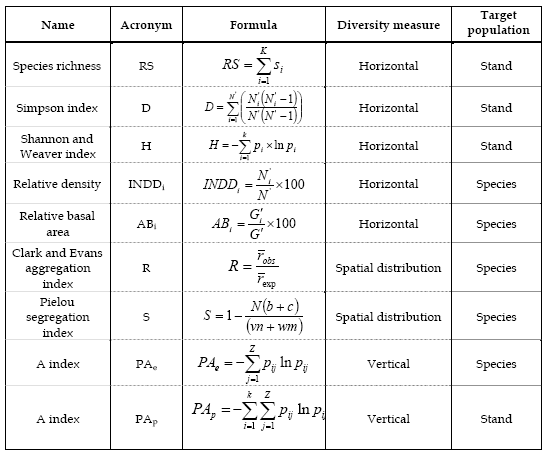
One of the first diversity indices was species richness (RS). This index evaluates the number of species in the stand, increasing with the number of species. Though it enables to distinguish diversity as function of the number of species it does not give any information regarding the weight in the mixture of each species. Thus two stands with the same number of species, but where one has a similar number of individuals per species and another where one of species has a much higher number are classified in the same type (Gonçalves, 2003).
Simpson index (D) is based in the heterogeneity, measuring the probability of two individuals randomly chosen belonging to the same species (Pierrat, 1995; Gaines et al., 1999). It ranges from 0 to 1, decreasing with the increase of the number of species and with the proximity of the species' frequencies. Shannon and Weaver index (H) is found in the information theory and is similar to an entropy measure. Suppose an infinite population of individuals belonging to k species, the probability of an individual belonging to the kth species being  . The introduction of the species logarithm proportion as a multiplying factor originates their disproportional raise when the species is rare while the abundant species originates a small increase in its value (Pretzsch, 1998, Staudhammer and Lamey, 2001). This index increases with the increase of the number of species and with the species' frequencies proximity. In populations with one species the index is zero, indicating the minimum diversity (Biber and Weyerhaeuser, 1998).
Another two indices based in the heterogeneity quantification (Pierrat, 1995) are the relative density (INDD) and the relative basal area (AB), characterising the species' importance in the mixture. The first is defined as the percentage of individuals of the species i in relation to the total number of individuals of the stand. The second is defined as the percentage of the basal area of a species i in relation to the total basal area of the stand.
Both Clark and Evans aggregation index and Pielou segregation index, though by different processes, evaluate the species spatial distribution pattern (Pretzsch, 1997). The first identifies trees horizontal distribution pattern while the second identifies species' intermingling. Thus quantifying different spatial heterogeneity patterns (Pretzsch, 1998).
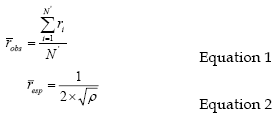
Clark and Evans aggregation index (R) describes the species spatial distribution as the ratio of the average observed distance of a tree to its nearest neighbour (robs) and the average expected distance to its nearest neighbour (resp), considering a random or Poisson distribution. The average observed distance is calculated by the nearest neighbour method, with the calculation of the distance of each tree to all its neighbours, per area unit and then calculating the average distance to the nearest neighbour with equation 1. The average expected distance for a random distribution is calculated as function of the number of trees per area unit (equation 2). Theoretically, R varies between 0 (maximum clustering) and 2.1491 (regular hexagonal pattern) and reveals if the trees in a stand are distributed regularly (R>1), randomly (R≈1) or in clusters (R<1) (Pretzsch, 1997, 1998).
Pielou segregation index (S) describes the intermingling or mixture of two species according to the nearest neighbour method (Pretzsch, 1997, 1998). This index was developed for mixed stands with two species and later adapted to mixed stands with three or more species (BIBER and WEYERHAEUSER, 1998). The nearest neighbour of all N trees in the stand is calculated by an iterative process, calculating the total number of trees pairs of the species 1 and 2 (m,n), the number of pairs whose nearest neighbour is of the same species (a,d) and the number of pairs whose nearest neighbour is of a different species (c,d). Pielou index varies between –1 and 1. When S<0 the observed number of mixed pairs is higher than expected, indicating intermingling or association. When S>0 the observed number of mixed pairs is smaller than expected, indicating segregation. When S=0 the number of observed pairs corresponds to the expected, indicating the independent distribution of species (Pretzsch, 1997).
Shannon and Weaver index can be divided in additive components, thus enabling the formulation of groups as function of each one of its components (Schulte and Boungiorno, 1998). Pretzsch (1996) considered the stand divided in three height classes while Schulte and Boungiorno (1998) and Staudhammer and Lamey (2001) considered diameter classes.
A index was developed by Pretzsch (1996) to characterise the vertical species profile of a stand. This index is based in the Shannon and Weaver index, considering the stand divided in three height zones (Z), as function of the maximum stand height. The first height zone ranges from 0-50% of the maximum height, the second from 50-80% and the third from 80-100%. The tree belongs to the layer where its top is located (Pretzsch, 1998; Biber and Weyerhaeurser, 1998). This index quantifies and resumes the species' vertical distribution in a stand. It ranges from 0, in one layer pure stands (Biber and Weyerhaeurser, 1998), increasing with the increase of the number of species and the number of layers, and reaching its highest value in mixed stands with heterogeneous structures (Pretzsch, 1998). It takes into consideration the biodiversity and the vertical structure of the forest stands (Biber and Weyerhaeurser, 1998).
Results
In 2001, species richness (RS) ranged from 2, in plot 18B2, to 7 in 25B1 and 29A2, being the latter, by definition, richer. Maritime pine and sweet chestnut are present in all plots and English oak in 11. In fact plots with more species have nearby stands of the regenerated species (p. e. 23A1 and 25B1) and plots with fewer species are surrounded by pure maritime pine stands (p. e. 18B2). The species richness in 2009 had no variation in 6 plots (17C1, 18B1, 18B2, 24B2, 27A1 and 27B2), increased in 5 (20C1, 23A1, 24B1, 25B2 and 29A1) and reduced in two (25B1 and 29A2). From the analysis of Table 3 it can be seen that the three main species are present in both measurements. The species' richness increase is due to the recruitment of young trees of natural regeneration and the reduction due to cuttings.
Table 3 - Species richness (RS) and species, Simpson (D) and Shannon and Weaver index (H) per plot
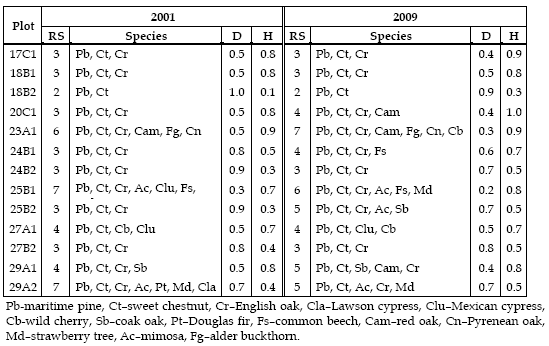
Simpson index (D) has its maximum in 18B2, mainly composed by maritime pine (98.2% and 96.4%, in 2001 and 2009, respectively). The smallest values are found in plots where the number of individuals of the different species is similar (p. e. 18B1 and 25B1). Considering the plots with three species; 17C1, 18B1, 24B2, and 27B2, it can be observed that the smallest value is found in 18B1 (0.5 in 2001 and 2009) where maritime pine represents about 52% and 42% of the individuals and chestnut 44% and 55%, in 2001 and 2009 respectively, and the largest, 0.9, in 24B2 where the proportion of maritime pine is larger than 80% (Table 4).
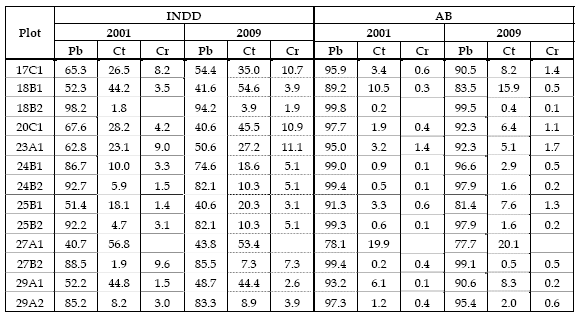
Table 4 - Relative density (INDD) per species and relative basal area (BA) per species
Shannon and Weaver index (H) increases with the increase of the species number and the evenness of individuals per species. In 18B2, with 2 species, the index reaches the minimum while in 23A1 and 25B1, with more than 5 species, the larger values are found. Considering the same 4 plots with 3 species referred above, it can be verified that the larger value is found in 17C1 and 18B1, where the number of individuals of the different species is closer and the smaller values in 24B2 and 27B2 where the inverse is observed (Table 3).
Relative density (INDD) reveals that maritime pine has, for both measurements, the highest weight in the mixture. When comparing the two measurements it can be seen that the relative density decreases for maritime pine and increases for sweet chestnut and English oak in most plots. Cuttings carried out to promote transformation process, removing essentially maritime pine, originated its reduction (Table 4).
Regarding relative basal area it can be observed maritime pine dominance, with values larger than 75% in both measurements, having a slight decrease from the first to the second, accompanied by a small increase of the relative basal area of sweet chestnut and English oak (Table 4), also due to the removal of maritime pine individuals.
In Table 5 it can be seen, for Clark and Evans aggregation index (R), that maritime pine has tendency to regular or random distribution in most plots, in both measurements. In fact, this species was planted at a regular spacing and the thinnings and cuttings maintained this distribution. Sweet chestnut and English oak have tendency to clustering in all plots both in 2001 and 2009. It should be noticed that the tendency of sweet chestnut to develop coppices explains the tendency to clustering; on the other hand being the seed of these two species heavy the dissemination tends to take place in small patches.
Table 5 - Clark and Evans aggregation index (R) and Pielou segregation index (S)
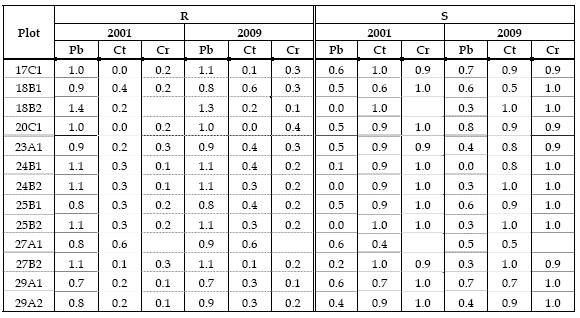
Pielou segregation index (S) shows that maritime pine exhibits tendency to independent distribution in 3 plots in 2001 and 1 plot in 2009 and to segregation in 10 plots in 2001 and 12 plots 2009. Sweet chestnut and English oak have tendency to segregation in all plots in 2001 and 2009.
Clark and Evans aggregation index for maritime pine indicates that distances between its individuals are equal or larger than expected by a Poisson distribution and for sweet chestnut and English oak smaller than expected. Pielou index indicates that the closest neighbours of maritime pine individuals are of a different species, the same occurring with the other two species.
A index (PA) quantifies the vertical diversity, as function of the number of individuals. The larger values of A index for maritime pine indicate their presence in the three layers and the smaller, close to zero, show that the species are found mainly in one height zone, for example the English oak (Table 6). A index values for sweet chestnut indicate that in some plots the individuals are mainly in one layer and on other, for example in plot 27A1, in two layers, namely in the inferior and intermediate. From 2001 to 2009 it can be observed, for sweet chestnut and English oak, an increase of A index in most plots, indicating the height development of these species, with some individuals reaching the intermediate and superior layers. In fact, when height distributions are analysed it can be verified that some individuals of sweet chestnut and English oak have moved from the inferior to the intermediate layer and from the intermediate to the superior layer.
Table 6 - A index (PA)
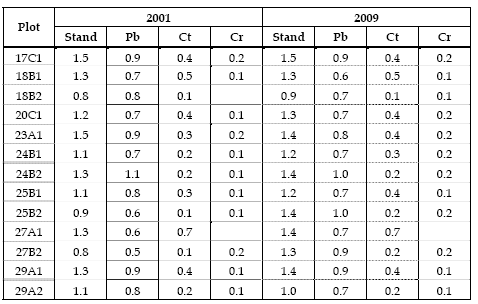
It should also be noted that cuttings affected the maritime pine A index, decreasing in the plots with less individuals in the inferior layer and increasing in those with recruitment of regeneration individuals to the inferior layer.
Discussion
The analysed stands were originally pure even-aged maritime pine stands that developed to multi-species structures. The evolution of these stands originated different structures that can be already noticed in terms of diversity. The species richness varies from 2 to 7, probably due to ecological variations, namely site and seed source. In fact, plots with more species have nearby stands of the regenerated species (p. e. 23A1 and 25B1), and the plots with fewer species are surrounded by pure maritime pine stands (p. e. 18B2).
From 2001 to 2009 the reduction of the number of maritime pine individuals originated a trend towards the decrease of Simpson index and the increase of Shannon and Weaver index, enhancing diversity.
Regarding relative basal area it can be noticed that maritime pine has the highest weight, but when relative density is analysed it can be noticed that sweet chestnut and English oak, have already a large proportion in the mixture.
As to Clark and Evans aggregation index it can be said that maritime pine has a tendency to regular distribution and sweet chestnut and English oak to clustering. The clustering tendency of the latter species can be due to one main factor, the proximity of those trees. This can be explained by the fact that the sweet chestnut and English oak seed is heavy and consequently falls near the seed trees and by the natural tendency of the chestnut to produce sprouts.
Pielou segregation index shows that maritime pine, sweet chestnut and English oak have tendency to segregation.
In A index it can be noticed that maritime pine is present in the three layers and sweet chestnut is found in one or two layers and English oak in one. In fact, when height distributions are analysed it can be verified that English oak is mainly in the inferior layer and sweet chestnut can be found in the inferior and intermediate layers in 2001 but in 2009 more individuals of the latter species reached in intermediate and superior layers and thus increasing A index value.
From the results it can be said that the diversity analysis, as function of the horizontal and vertical spatial distribution measures are complementary. The first give indication of the proportion of the species present in the stand, the second the way they are arranged in the horizontal plane and the third the way they are distributed in the vertical plane.
The evolution from 2001 and 2009 shows a trend to the increase of diversity with the gradual removal of the mature maritime pine individuals, the development of the main stand and the recruitment of natural regeneration.
Acknowledgments
The authors would like to thank Autoridade Florestal Nacional the permission to settle and measure the plots in Serra da Lousã. To Eng. Carla Gonçalves the help with programming. To Eng. Carla Ramos, Eng. Pedro Antunes and David Gomes their help in the data collection. The field data in 2001 and 2009 was collected in the scope of the projects "Forest ecosystem management: an integrated stand-to-landscape approach to biodiversity and to ecological, economic and social sustainability" (POCTI/36332/AGR/ 2000) and "Florestas mistas. Modelação, dinâmica e distribuição geográfica da produtividade e da fixação de carbono nos ecossistemas florestais mistos em Portugal" (FCOMP-01-0124-FEDER-007010), respectively.
References
Biber, P., Weyerhaeuser, H., 1998. Numerical methods for characterizing structure and diversity applied to a natural tropical forest and an even aged teak stand. In Erich Mies (Ed.). Natural and socio-economic analysis and modelling of forest and agroforestry systems in Southeast Asia. German Foundation for Development. Food and Agriculture Development Centre, pp. 83-104.
Brockway, D.G., 1998. Forest plant diversity at local and landscape scales in the Cascade Mountains of southwestern Washington. Forest Ecology and Management 109: 323-341. [ Links ]
Gaines, W.L., Harrod, R.J., Lehmkuhl, J.F., 1999. Monitoring biodiversity: quantification and interpretation. Pacific Northwest Research Station. General Technical Report. PNW-GTR-443. 27 pp.
Gilliam, F.S., 2002. Effects of harvesting on herbaceous layer diversity of a central Appalachian hardwood forest in West Virginia, USA. Forest Ecology and Management 155: 33-43.
Gonçalves, A.C., 2003. Modelação de povoamentos adultos de pinheiro bravo com regeneração de folhosas na Serra da Lousã. PhD thesis. Universidade Técnica de Lisboa. Instituto Superior de Agronomia. Lisboa, Portugal, 232 pp.
Kint, V., 2003. Structural development in ageing scots pine (Pinus sylvestris L.) stands in Western Europe. PhD thesis. Gent University. Gent, Belgium. 194 pp.
Lawesson, J.E., Blust, G. de, Grashof, C., Firbank, L., Honnay, O., Hermy, M., Hobitz, P., Jensen, L.M., 1998. Species diversity and area-relationship in Danish beech forests. Forest Ecology and Management 106: 235-245.
Nagendo, G., Stein, A., Gelens, M., Gier, A de, Albricht, 2002. Quantifying differences in biodiversity between a tropical forest area and a grassland area subject to traditional burning. Forest Ecology and Management 164: 109-120.
Neumann, M., Starlinger, F., 2001. The significance of different indices for stand structure and diversity in forests. Forest ecology and Management 145: 91-106.
Oliver, C.D., Larson, B.C., 1996. Forest stand dynamics. Update editions. John Wiley & sons, Inc. 519 pp.
Pierrat, R., 1995. La typologie de peuplement: un outil pour l'évaluation de la biodiversité en forêt. In Foresterie et Développement Durable. Actes des Deuxiémes Rencontres Forestières de L'ENGREF. Nancy 17-18 Novembre 1995. France. 209-219 pp.
Pitkänen, S., 1998. The use of diversity indices to assess the diversity of vegetation in managed boreal forests. Forest Ecology and Management 112: 121-137.
Pretzsch, H., 1996. The effect of various thinning regimes on the spatial stand structure. In: Proceedings of the Conference on Effects of environment factors on tree and stand growth.IUFRO S4.01 Conference. Dresden. 183-191 pp.
Pretzsch, H., 1997. Analysis and modelling of spatial stand structures. Methodological considerations on mixed beech-larch stands in Lower Saxony. Forest ecology and Management 97: 237-253.
Pretzsch, H., 1998. Structural diversity as a result of silvicultural operations. Lesnictví-Forestry 44: 429-439.
Schulte, B.J., Buongiorno, J., 1998. Effects of uneven-aged silviculture on the stand structure, species composition, and economic returns of loblolly pine stands. Forest Ecology and Management 111: 83-101.
Staudhammer, C.L., Lamey, V.M., 2001. Introduction and evaluation of possible indices of stand and structural diversity. Canadian Journal of Forestry Science 31: 1105-1115.
