


Serviços Personalizados
Journal

Artigo
 Inglês (pdf)
 Artigo em XML
 Referências do artigo
 Enviar este artigo por email
Indicadores
 Citado por SciELO
 Links relacionados
 Similares em
SciELO
Similares em
SciELO Compartilhar

 Permalink
Silva Lusitana
versão impressa ISSN 0870-6352
Silva Lus. vol.21 no.2 Lisboa dez. 2013
The Total Biomass of Self-Thinned Mixed Forests. A Theoretical and Simulative Inquiry
Biomassa total de povoamentos mistos auto-desbastados. Uma inquirição teórica e simulada
Biomasse totale des peuplements mixtes auto éclaircis. Une enquête théorique et simulatrice
*Luis Soares Barreto
*Jubilee Professor of Forestry, Instituto Superior de Agronomia, Lisboa Av. do Movimento das Forças Armadas, 41-3D, 2825-372 COSTA DE CAPARICA, Portugal
ABSTRACT
The author uses his theory for mixed stands, and his model BACO2 for tree competition to sustain the following statement: the total biomass of self-thinned even-aged mixed stands is simultaneously determined by a) the competitive hierarchy associated to the species present, b) the initial proportions of the species, and c) the relative sizes of the trees of the competitors. The author presents empirical evidence that corroborates his theory, and models for tree competition.
Key words: competitive hierarchy, self-thinned even-aged mixed stands, total stand biomass
SUMÁRIO
O autorrecorre à sua teoria para os povoamentos mistos e ao seu modelo BACO2 para sustentar que a biomassa total dos povoamentos auto-desbastados mistos e regulares é determinada simultaneamente pela a) hierarquia competitiva presente, b) proporções iniciais das populações e c) tamanhos relativos das árvores médias de cada espécie. O autor apresenta dados empíricos que corroboram a sua teoria e modelos para a competição entre árvores.
Palavras-chave: biomassa total, hierarquia competitiva, povoamentos auto-desbastados regulares mistos
RÉSUMÉ
L'auteur utilise sa théorie pour les peuplements mixtes et son modèle BACO2 pour démontrer que la biomasse totale des peuplements auto éclaircis mixtes et réguliers est déterminé pour a) la hiérarchie compétitive, b) les proportions initiales des populations, c) les dimensions relatives des arbres de chaque espèce. Il présente des donnés empiriques que soutiennent sa théorie et ses modèles pour la compétition entre les populations d'arbres.
Mots clés: biomasse totale, hiérarchie compétitive, peuplements auto éclaircis mixtes et réguliers
Introduction
This paper continues my previous theoretical and simulative inquiry on tree competition, the structure, and dynamics of mixed stands (BARRETO, 1997, 1999, 2001, 2003a,b 2004a,b, 2007). I already accomplished a first incursion on the effect of the species mixture on the total biomass of the self-thinned even-aged mixed stands (sems) of maritime pine (Pinus pinaster), and Corsican pine (Pinus nigra ssp. laricio). For the stands I simulated, I verified that there are proportions of this two Mediterranean pines that maximize the total production of biomass, at a given age (BARRETO, 2007: Table 9). Also, in this same paper, I depicted the conditions when the total biomass of a population of a given species, in a sems, is increasing more or less then in a pure stand, and it is declining (BARRETO, 2007:121, 126).
In the present paper, I will attempt to sustain, and illustrate the following hypothesis: the total biomass of self-thinned even-aged mixed stands is simultaneously determined by: a) The competitive hierarchy associated to the species present; b) The initial proportions of the species; c) The relative sizes of the trees of the competitors.
From here on, I consider sems with 2 species, and the initial proportions of the species are defined at age 10, and are relative to the number of trees of each species, unless a change is stated.
After introducing the underpinning concepts, the model for competition, and characterize the species whose growth is here simulated, I will accomplish my task by the following order: 1) The clarification of the effect of the relative size of the trees and initial proportions; 2) The scrutinizing of the impact of the competitive hierarchy; 3) The effect of the initial proportions of the biomasses of the species; 4) Looking for empirical corroboration.
The paucity of embracing and lasting experimental studies on the biomass of mixed stands (PRETZSCH, 2009:350) reinforces the interest of my endeavor.
Tree competition: basic concepts and model BACO2
Although my theory for pure and mixed stands is described elsewhere (e.g., BARRETO, 2004a, b), I present a brief description of my model for tree competition, for the sake of completeness and clarity.
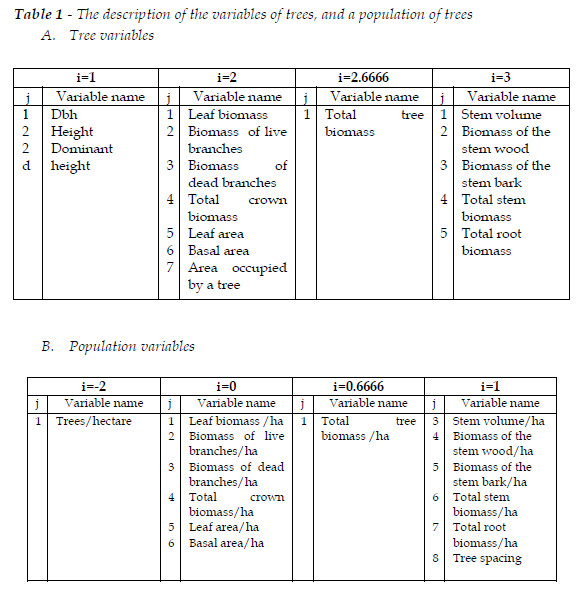
First let me introduce the notation for the forest variables in pure and mixed stands. The variables in pure and mixed stands are, respectively, mentioned by yijt, and ysijt, where i is the power of the linear dimension associated to the variable; j is the identifier of the variable; t is age, as usual; s, in mixed stands, refers to a given species. In Table 1, I describe the variables.
In pure stands and mixed stands, tree variables abide the Gompertz equation (GPZ) that can be written as:

where yijf is the final or asymptotic value of yij. Ri =yij0/yijf. yij0 is the value of the variable at age t0, when the competition among trees is dominant, and the variables start their Gompertzian trajectories. Ri and c are real positive numbers, characteristic of each species. Population variables follow the GPZ only in pure stands, and are very close to this pattern of growth if the stand species had experienced a process of coevolution. Implicit to this statement is the following one: tree competition directly affects the population variables, namely tree mortality, but the tree variables are affected indirectly through the impact of the species upon the site quality related to the target species. This is reflected, ab initio, on the regeneration and recruitment of the species, and on the size of the individuals. From here on, t0=10 years.
It is verified


Under the perspective of the competitive pressure the trees of species i are suffering, the total density of the stand for this species is measured as:
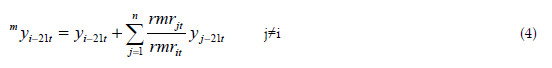
where rmrit(=-ci ln(Ri-2) exp(-ci(t-t0))) is the relative mortality of species i, at age t, in a pure stand. The relative mortality in mixed stand with n species is defined as:
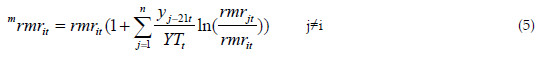
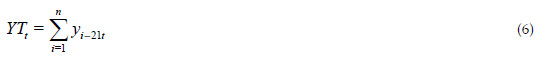
Where
I can write my model BACO2 for tree competition as:
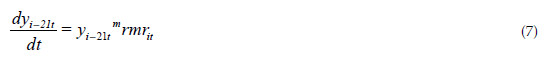
Eq. (7) is underpinned by the following conceptual model for tree competition: in a mixed stand, the competitive ability of a species is determined by its growth rate (Grime's hypothesis) and its proportion in the stand. Thus, as R-2 decreases from K-strategists to r-strategists, the former species have higher competitive ability than the later. The dominant species transfers a fraction of its inherent mortality to the dominated species (mrmr<rmr), which see its mortality accrued (mrmr>rmr).
In BARRETO (2003b) I introduced other models for tree competition.
I successfully applied model BACO2 to the classical experiments of Gause, with species of Paramecium (BARRETO, 2005).
Now, let me define

For a species in pure stand tb(t) is constant and equal to 1.333333. Let us analyze the situation in sems. If tb(t)>1.333333 then the total biomass per unit area is growing more in the sems then in pure stand. If 1<tb(t)<1.3333 then the total biomass per unit area is growing less in the sems then in pure stand. When tb(t)<1 the total biomass per unit area is declining. When tb(t)=1.333333, the the growth of the total biomass per unit area of the species is the same in pure, and mixed stand.
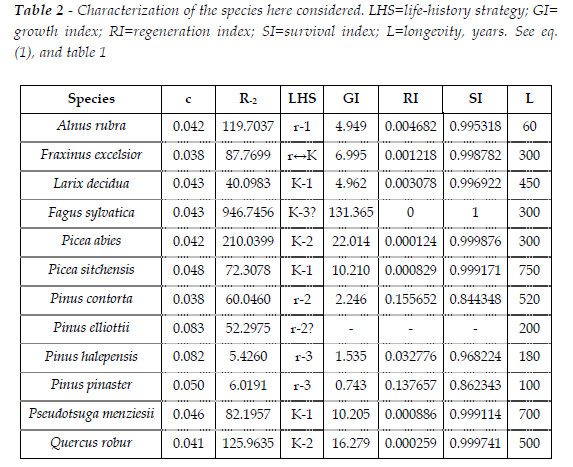
The characterization of the species
As the elaborations here presented are integrated in a conceptual and nomological system that embraces in its wholeness trees and forests, for the benefit of the intelligibility of my exposition, given my conception of competition, in consonance with both model r-K for life-history strategy, and the patterns of growth of the species, it is indispensable that I characterize the species here simulated. This information is presented in Table 2. I had already characterized the growth patterns of all species here simulated, but Pinus elliottii. To complement the displayed information see BARRETO (2008, 2009).
The effect of the relative size of the trees
To approach this issue I will use a mixture with pattern of competition of Type VI (BARRETO, 1999). The species present have very similar competitive ability, which minimizes its effect on the total biomass of the sems. The elected species are Picea sitchensis (Psi) and Pseudotsuga menziesii (Pme) that had coevolved, and are present in natural mixed stands of North-America.
To characterize the relative size of the trees of the two populations, let me define the following ratio:
R(Psi/Pme)= total final biomass of the mean tree of Psi/total final biomass of the mean tree of Pme.
The competitive hierarchy of this species is characterized by the dominance of Psi till age 14. After, the dominance is reversed. The ratio of the relative mortality rates, from age 10 to 90, Psi/Pme, varies from 1.0132 to 0.8635.
To bring more intelligibility to the competitive situation I present Figure 1 that shed some clarity on the effect of the initial proportions on the competitors.
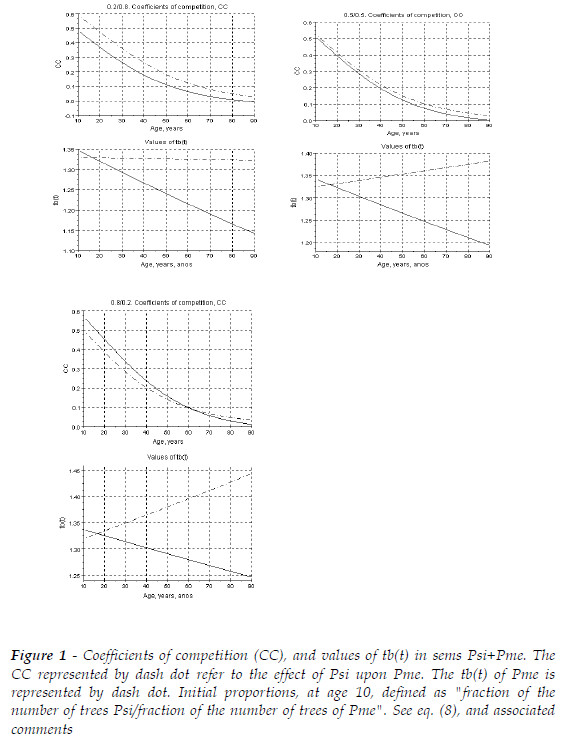
In Figure 1, Pme virtually acts as the slightly dominant species. The association is not deleterious for any species, and as expected the increasing fraction of Psi improves tb(t) that clearly reflects the competitive hierarchy, when the two species have the same number of trees at age 10 (0.5/0.5).
The effect of R can be scrutinized under two perspectives, as I illustrate ahead. In Figure 2, I show the effect of R(Psi/Pme) on the pattern of variation of the total biomass of the sems under analysis, when the proportions of the initial numbers of trees change. These results confirm my hypothesis and evince the sensitivity of the same pattern to small variations of the defined ratio.
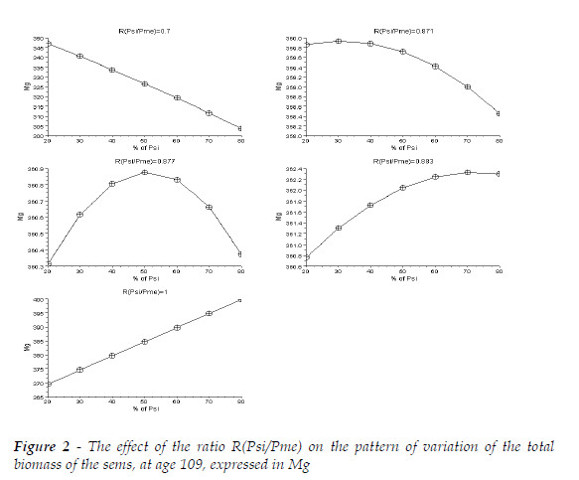
Coherently, as the ratio increases, the maximum values of the total biomass of the stand increases with the initial proportion of Psi. The species with the largest mean tree has the determined effect on the proportion that maximizes the total biomass, given the comparable competitive ability of both species.
Finally, I exhibit the sole effect of the tree size. Let assume two sems with equal number of trees at age 10 (5000), and R=[0.25, 0.4286, 0.6667, 1, 1.5, 2.3333, 4]. The first is the one we are dealing with (Psi+Pme), the second is a sems with Quercus robur, and Pinus pinaster (see type I in Figure 4).
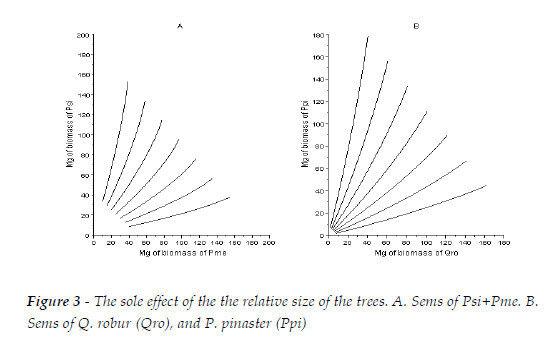
The simulations for the first sems are in Figure 3A, and for the second in Figure 3B. The impact of R on the butterfly effect is weaker when the competitive abilities of the species are closer (A) then when they are very distinct (B). It is presumable, that in the second situation (B), small errors in the measurement of the trees can have more impressive influence upon the standing biomass predicted, then in case A. See SCHMID et al. (2006), and Puettman, Coates, MESSIER (2009:112) for empirical corroboration.
In mixed stands, the relevance of the relative size of the trees of the competitors can be made more understandable, and summarized as follows: a) When the dominant species has the larger trees, the self-thinning tendentiously approaches a low thinning; b) Self-thinning tendentiously moves towards a neutral thinning when the two species have the same or very close competitive abilities, as in natural stands, with species that had coevolved (BARRETO, 1994:234-235); c) When the dominated species has the larger trees the self-thinning tendentiously converges to a crown thinning.
A formal analysis of the effects of the attributes of the thinnings can be found in BARRETO (1994).
When the species have clearly differentiated competitive abilities, the relative size of the trees conspicuously varies during the life of the sems.
The effect of the competitive hierarchy
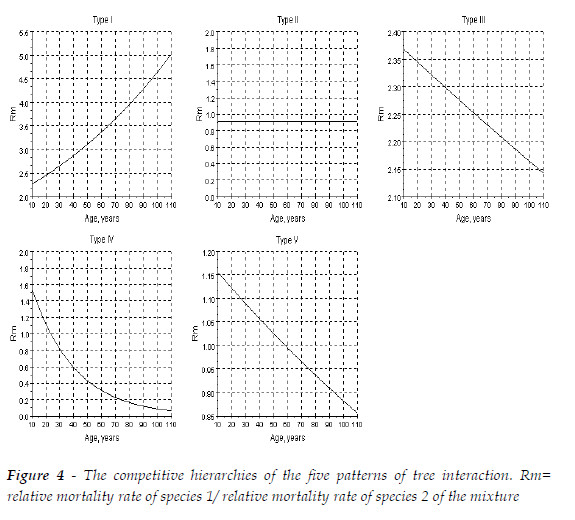
To depict the impact of the competitive hierarchies on the variation of the total biomass of sems, I consider five patterns I already described in BARRETO (1999, 2004a). I established equal final tree sizes for both species (R(Species 1/Species 2)=1), and equal proportions at age 10, of the number of trees (0.5/0.5).
The five patterns of tree interaction considered are represented by the following sems:
Type I: Quercus robur + Pinus pinaster; Type II: Pinus contorta + Fraxinus excelsior; Type III: Pinus elliottii + Pinus halepensis; Type IV: Pinus halepensis + Pinus pinaster; Type V: Alnus rubra + Pseudotsuga menziesii. In Figure 3, I exhibit the ratios Rm= relative mortality rate of species 1/ relative mortality rate of species 2 of the mixture, to characterize the respective competitive hierarchies. See Figure 4.
Now let me introduce the variation of the total tree biomass of the sems of the five mentioned sems, in Figure 5.
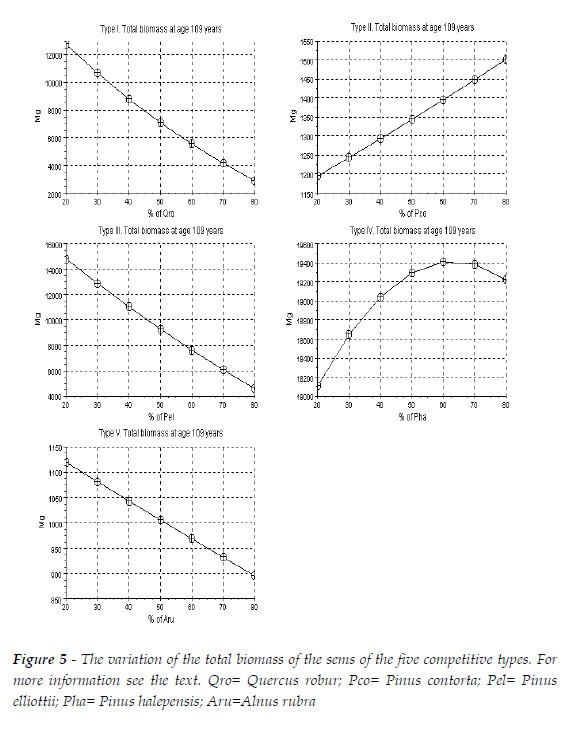
As Figure 5 evinces three different patterns of variation of the total biomass of the sems, I admit that my conjecture is sustained, this is, the competitive hierarchy in a sems affects its total biomass.
The effect of the initial proportions of the biomasses
Now, I attempt to clarify the effects of the initial proportion of the total biomasses of the two species. I assume R(sp.1/sp.2)=1. I consider two competitive hierarchies. The forest Psi+Pme (close competitiveness) and the sems with Fagus sylvatica (Fsy) + Picea abies (Pab).
The initial total biomasses, at age 10, sum 100 Mg. The biomass of each species has the proportions 20, 50, 80%.
In Figure 6, I exhibit the simulation for the North-American stands.
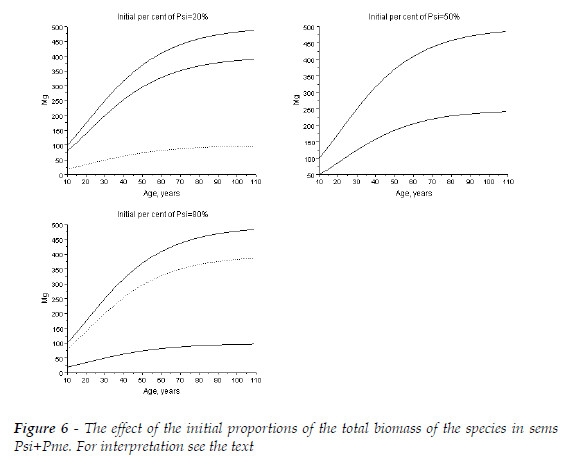
In Figure 6, as both species has comparable competitive ability, the effects of the initial proportions on the final total biomass are negligible. To the initial proportions of Psi equal to 20, 50, and 80%, at age 109, the sum of the biomasses are, respectively, 486.2, 484.1, 482.1 Mg. Psi is slightly dominated by Pme, thus when its proportion of biomass increases, the total biomass has a minute decreasing.
Now I approach the sems with Fagus sylvatica (Fsy) + Picea abies (Pab).
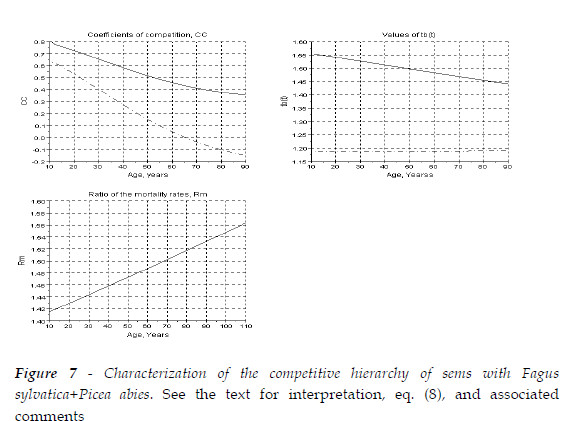
This mixture is characterized in Figure 7. The European beech is the dominant species, as Rm(Pab/Lde) is always greater then one. For a mixture with initial equal proportions of the number of the two species, tb(t)>1.333 for Fsy, and steadly arround 1.18, for Pab. The hardwood is growing more biomass then in pure stand, and Pab less biomass. The larger CC are the positive effect of Pab upon the beech. The impact of the beech upon the spruce is negative only after an age close to 65 years.
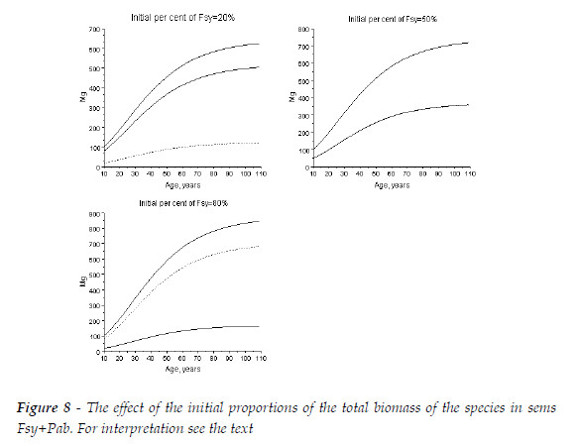
In Figure 8, as the beech is the dominant species the increasing of its initial proportion also increases the final total biomass. To the initial proportions of Fsy equal to 20, 50, and 80%, at age 109, the sum of the biomasses are, respectively, 625.0, 718.4, 845.0 Mg.
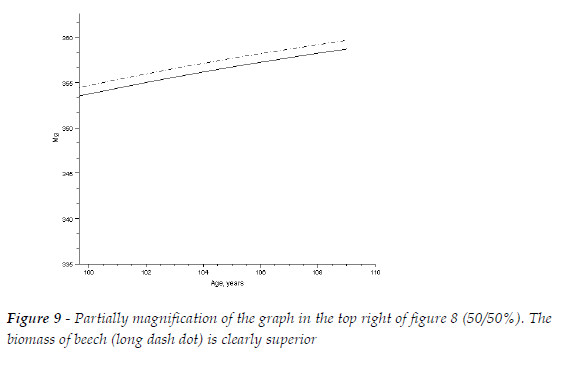
In Figure 9, I present a magnification of the lines associated to the biomasses of each species, when the initial biomasses are equal (50%). The biomass of the hardwood is clearly larger then the biomass of the softwood.
I conclude that the initial biomasses of the species affect the final total biomass of the sems, and this impact is conditioned by the competitive hierarchy.
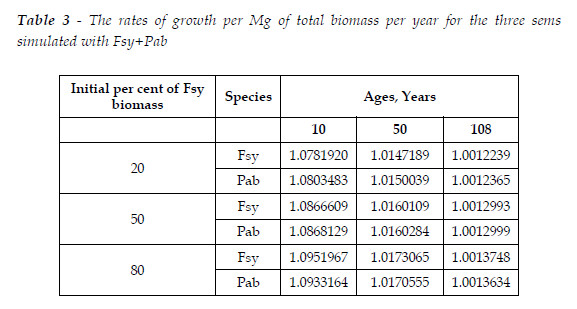
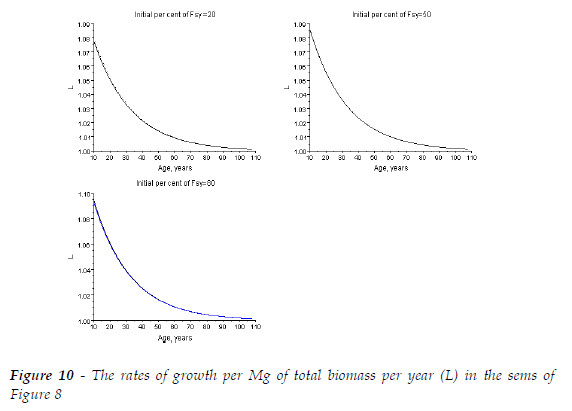
Model BACO2 let me easily obtain the complementary information I wish, about the dynamics of a sems. To illustrate this assertion, for the three simulated sems, at ages 10, 50, and 108, I calculated the rate of growth per Mg of total biomass per year (L=y0.67t+1/y0.67t), as displayed in Table 3, and Figure 10
Looking for empirical support
As I already stated, the experimental information about the issue here approached is scarce, then, inevitably, the possible empirical corroboration of my conjecture is limited to only two sets of data mentioned in PRETZSH (2009:351-352, Figure 10.9), and also restricted to few aspects. Both studies refer to above ground biomass (AGB).
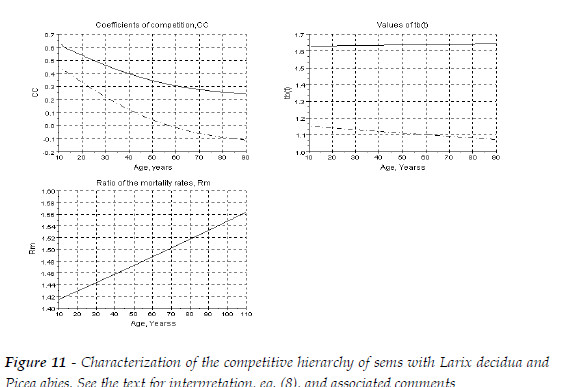
Let me approach first the sems with Larix decidua (Lde) + Picea abies (Pab). According to this author, it was observed that the total AGB of these sems attains a maximum when the proportion of Norway spruce is 40%, without reference to the age, or to the relative size of the trees.
This mixture is characterized in Figure 11. It is a situation similar to the sems Qro+Ppi (Type I). The Norway spruce is the dominant species, as Rm(Pab/Lde) is always greater then one. For a mixture with initial equal proportions of the number of the trees of the two species, tb(t)>1.333 for Pab, and 1.06<tb(t)<1.15, for Lde. Pab is growing more biomass then in pure stand, and Lde less biomass. The larger CC are the positive effect of Lde upon the spruce. The impact of the spruce upon the larch is negative only after an age close to 60 years.
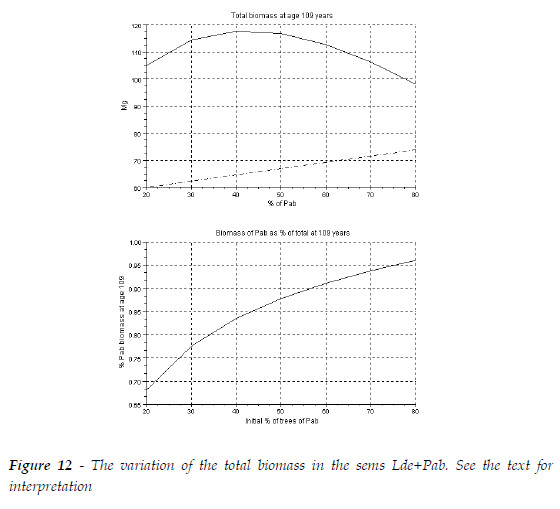
At age 109, the pattern in Figure 10.9b, of PRETZSCH (2009:351) can be obtained for R(Pab/Lde)=7.4, as exhibited in Figure 12. The total biomass of the sems (continuous line) is more then the sum of the biomasses of each species growing in pure stand (dashed with points), as the CC are positive, and the species that has less mortality (Pab) in mixed stand than in pure stand has much larger trees. The overyielding of the AGB was also observed in the measured stands (PRETZSCH, 2009:352). As the larger mean tree is the one of the spruce, and the tree mortality of Pab is less then in pure stand, in the second graphic, the percentage of its biomass in the final sems is superior to its initial percentage of its trees.
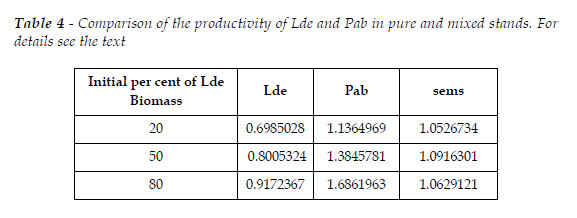
As in the previous section, I also simulated three stands with initial total biomasses, at age 10, with sum equal to 100 Mg. The biomass of each species has the proportions 20, 50, 80%. The comparisons of the mixed and pure stand are exhibited in Table 4. The figures represent the ratio species in mixed stand/species in pure stand, total biomass of the sems/sum of the biomasses of each species in pure stand. All figures refer to age 109. As the proportion of the dominated species (Lde) increases the ratios of the species also increase. The overyielding of Pab overpass the loss of the biomass of Lde, and the mixture is more productive then the sum of the two pure stands. There is a critical proportion that maximizes the overyielding of the sems, as exhibited in Figure 13.
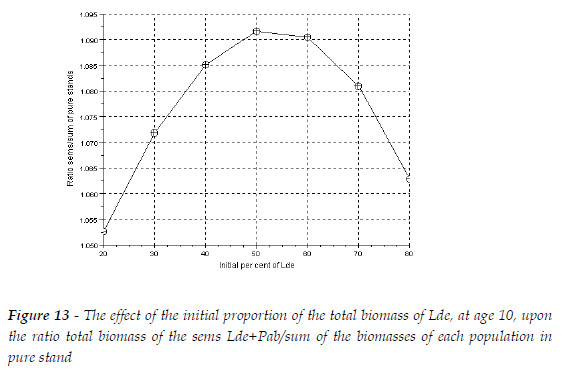
In the measurements referred by PRETZSCH (2009:352) it was observed overyielding of both Pab (22-28%), and Lde (2-13%). Probably, in fact, there was a difference in site quality for Lde (soil?). The per cent of the overyielding of Pab is within the range displayed in Table 4.
Now I approach the sems with Fagus sylvatica (Fsy) + Picea abies (Pab), already characterized (Figure 7).
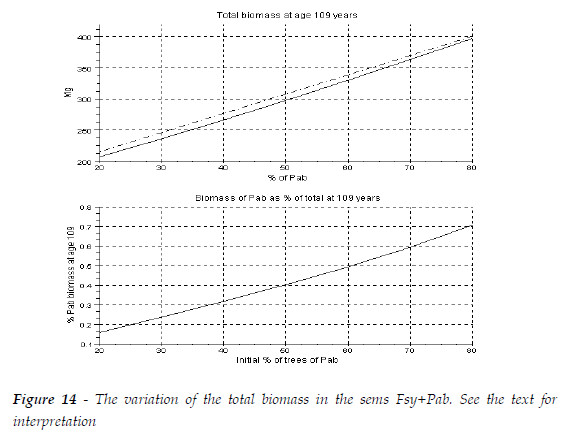
The pattern in Figure 10.9a, of PRETZSCH (2009:351) can be obtained, at age 109, for R(Fsy/Pab)=1.5, as exhibited in Figure 14. The total biomass of the sems (continuous line) is less then the sum of the biomasses of each species growing in pure stand (dashed with points). The value of R(Fsy/Pab) is not enough large to reverse this situation. As the larger mean tree is the one of beech, and the tree mortality of Pab is greater then in pure stand, in the second graphic, the percentage of its biomass in the final sems is inferior to its initial percentage of trees.
Now, for the sake of completeness, I simulate a stand that at age 10 years has 50 Mg of total biomass area unit (au)-1 of Pba, and 60 Mg of total biomass au-1 of Fsy. The mean trees of the two species have the same size. In Figure 15, I present the biomasses of each specie and total, the values of L, the new biomass added to the stand, this is, the current annual increments of the species and the sems, Mg au-1 year-1. The net productivity that encompasses not only new biomass created but also replacements of lost biomass, root secretions, and volatile emissions is also estimated, assuming a situation of average stress for both species (Chapin III, MATSON and MOONEY, 2002:126-128, 132,136; SCHULZE, BECK, MULLER-HOENSTEIN, 2005:348).
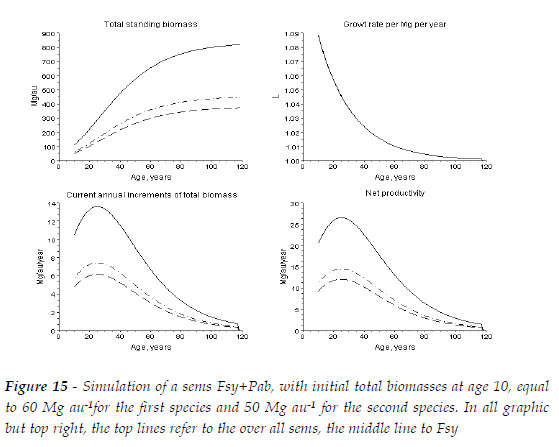
Obviously, in a given sems, the ages of maximum current annual increments of the species and the sems depend on the competitive hierarchy, proportions of the species, and relative size of the trees.
My analysis of this sems, does not preclude the existence of an initial proportions of the species associated to the adequate R(Fsy/Pab) that reproduce the results measured in these stands, as described in PRETZSCH (2009:351).
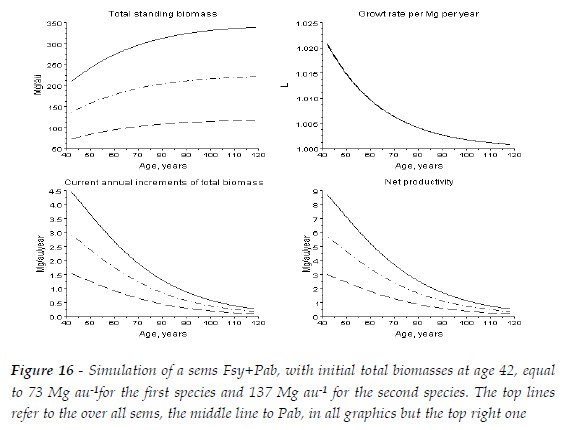
In Figure 16, I simulated an hypothetical sems with Fsy+Pab, measured at at age 42, with R(Fsy/Pab)=1, and 73 Mg au-1 of Fsy, and 137 Mg au-1 of Pab. In this sems, at age 109, the ratio total biomass sems/sum of biomasses of Fsy, and Pab in pure stands is equal to 0.964 (335.64562/348.06329).
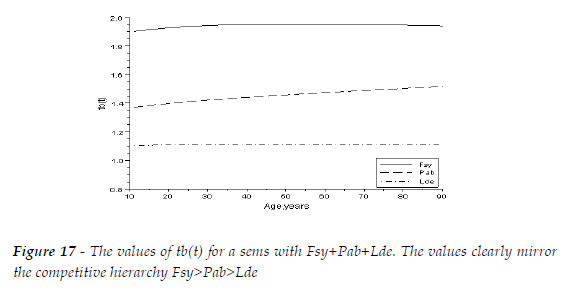
Coherently, the competitive hierarchy of the three species, Fsy (K-3)>Pab (K-2)>Lde (K-1), mirror the ordination of the growth indices (131.365>22.014> 4.962), as exhibited in Table 2. In Figure 17, for a sems with these three species, with mean trees with the same size, and equal initial total biomass per area unit, I exhibit the values of tb(t). The competitive hierarchy is conspicuous. The biomasses of Fsy, and Pba are growing more than in pure stand (tb(t)>1.3), while Lde has its growth depressed (tb(t)<1.3). Fsy is the more beneficiated species because dominates the other two species. The benefit Pab takes from the presence of Lde overpass the negative impact it suffers from the competition with Fsy. Obviously, the values of tb(t) change with the relative size of the mean trees, and the fraction of the total initial biomasses of the species, but the general pattern is maintained. The same initial population of Fsy, in pure stand and in the simulated sems, at age 90, converges, respectively, to 13 and 102 trees au-1. The same figures for the Pab are 57, 77 trees au-1. Finally, for the Lde the same figures are 280, 135 trees au-1.
Tree competitive hierarchies (competitive asymmetry) had already been depicted in empirical studies. See, for instance, CANHAM, LePAGE, and COATES (2004).
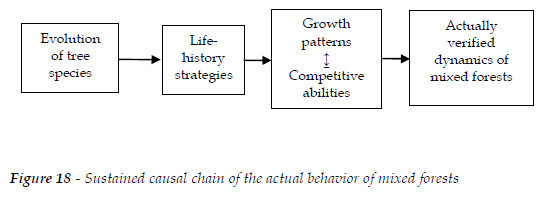
If we accept that to explain is to attribute a cause (causal realism), the verified patterns of variation on mixed stands are caused by the different life-history strategies of the species, mirrored by their competitive abilities. The ultimate cause is the coevolution of the species. See Figure 18.
Conclusive remarks
Again, the elaborations here presented evince the conceptual and practical advantages that can be obtained from an integrated theory for pure and mixed forests that also generates adequate models.
The empirical evidence available strengthens the truthlikeness of: a) my conceptual model for tree competition; b) model BACO2, and related models; c) the embracing coherence of my theory for tree competition, the growth indices I established, and my revised version of the r-K model for life-history strategy.
Implicitly, given the elaborations presented, it is highly probable that the total biomass of self-thinned even-aged mixed stands is simultaneously determined by the relative sizes of the trees of the competitors, the competitive hierarchy associated to the species present, and the initial proportions of the species. For other aspects of the mutability of the geometry of mixed stands see BARRETO (2003a, 2007).
Assuming the time-space symmetry between even-aged and uneven-aged stands, the results here presented are extensible to the space continuum, in the latter forests.
The elaborations here presented can hardly be obtained with empirical and regressive models.
Also, I have serious doubts about the correctness, and fecundity of ad hoc, and simplistic approaches to the dynamics of the biomass of mixed stands.
References
BARRETO, L.S., 1994. The Clarification of Self-Thinning and Thinning. A Simulation Approach. Silva Lusitana 2(2): 233-238. [ Links ]
BARRETO, L.S., 1997. Coexistence and Competitive Ability of Tree Species. Elaborations on Grime's Theory. Silva Lusitana 5(1): 79-93. [ Links ]
BARRETO, L.S., 1999. A tentative typification of the patterns interaction with models BACO2 and BACO3. Silva Lusitana 7(1): 117-125. [ Links ]
BARRETO, L.S., 2001. O Modelo BACO3 para a Competição entre Plantas. Research Paper SB-02/01. Departamento de Engenharia Florestal, Instituto Superior de Agronomia. [ Links ]
BARRETO, L.S., 2003a. The Blended Geometry of Self-Thinned Uneven-Aged Mixed Stands.Research Paper SB-04/03. Departamento de Engenharia Florestal, Instituto Superior de Agronomia. Revised version submitted to Silva Lusitana. [ Links ]
BARRETO, L.S., 2003b. SB-BACO 4. A Gompertzian Discrete Model for Tree Competition. Silva Lusitana 11(1): 77-89. [ Links ]
BARRETO, L.S., 2004a. Tree Competition:Concepts, Models, and Patterns.Research Paper SB-01/04. Departamento de Engenharia Florestal, Instituto Superior de Agronomia. [ Links ]
BARRETO, L.S., 2004b. A Unified Theory for Self-Thinned Mixed Stands. A Synoptic Presentation.Research Paper SB-02/04. Departamento de Engenharia Florestal, Instituto Superior de Agronomia. Revised version submitted to Silva Lusitana. [ Links ]
BARRETO, L.S., 2005. Gause's Competition Experiments with Paramecium sps. Revisited. Research Paper SB-01/05. Departamento de Engenharia Florestal, Instituto Superior de Agronomia. Revised version submitted to Silva Lusitana. [ Links ]
BARRETO, L.S., 2007.The Changing Geometry of Self-Thinned Mixed Stands. A Simulative Quest. Silva Lusitana 15(1): 119-132. [ Links ]
BARRETO, L.S., 2008.The Reconciliation of the r-K, and C-S-R Models for Life-History Strategies. Silva Lusitana 16(1): 97-103. [ Links ]
BARRETO, L.S., 2009.Growth, Regeneration, and Survival Indices for Tree Species. Silva Lusitana 17(1): 83-95. [ Links ]
BRZEZIECKI, B., KIENAST, F., 1994. Classifying the Life-History Strategies of trees on the Basis of the Grimean Model. Forest Ecology and Management 69: 167-187. [ Links ]
CANHAM, C.P., LePAGE, P.T., COATES, K.D., 2004. A Neighbourhood Analysis of Canopy Tree Competition: Effects of Shading versus Crowding. Can. J. For. Res. 38: 778-787. [ Links ]
CHAPIN III, F.S., MATSON, P.A., MOONEY, H.A., 2002. Principles of Terrestrial Ecosystem Ecology. Springer, New York. [ Links ]
FOWELLS, H.A., 1965. Silvics of Forest Trees of the United States. Agriculture Handbook Nº 271. U.S. Department of Agriculture, Washington, D.C., U.S.A. [ Links ]
HOCKER, Jr., H.W., 1979. Introduction to Forest Biology. John Wiley & Sons, New York, U.S.A. [ Links ]
KIMMINS, J.P., 1997. Forest Ecology. A Foundation for Sustainable Management. Prentice Hall, Upper Saddle River, New Jersey, U.S.A. [ Links ]
PRETZSCH, H., 2009. Forest Dynamics, Growth and Yield. From Measurements to Model. Springer, Berlin. [ Links ]
PUETTMAN, K.J., COATES, K.D., MESSIER, C., 2009. A Critique to Silviculture. Managing for Complexity. Island Press, Washington. [ Links ]
SCHMID, S., ZINGG, A., BIBER,P., BUGMANN, H., 2006. Evaluation of the Forest Growth Model SILVA Along an Elevational Gradient in Switzerland. European Journal of Forest Research 125(1): 43-55. [ Links ]
SCHULZE, E-D, BECK, E., MULLER-HOENSTEIN, K., 2005. Plant Ecology. Springer, Berlin. [ Links ]
Entregue para publicação em fevereiro de 2010
Aceite para publicação em agosto de 2012
