


 English (pdf)
 Article in xml format
 Article references
 Send this article by e-mail
 Cited by SciELO
  Similars in
SciELO
Similars in
SciELO 
 Permalink
Since the beginning of Psychology as a science, knowledge has been guided by the medic model that considers health to be the absence of pathology (Millon, 1996). This notion has been challenged (Wade & Halligan, 2004). In fact, an absence of psychopathology is not a guarantee of a good quality of life or optimal functioning (Seligman & Csikszentmihalyi, 2014; World Health Organization [WHO], 2014). The focus on sanity aspects addresses a long due necessity of a sanity nosology.
The Positive Personality Model (PPM; de la Iglesia & Castro Solano, 2018) was introduced as a new proposal for assessing five positive personality traits: Serenity, Humanity, Integrity, Moderation, and Sprightliness. The major strengths of the model include (1) its focus on sanity aspects; (2) its link to the latest edition of the Diagnostic and Statistical Manual of Mental Disorders (DSM-5, American Psychiatric Association [APA], 2013); and (3) its dimensional structure. Thus, focusing on sanity aspects means looking at factors that contribute to health. In fact, over the last couple of decades have seen an increased interest in studying other aspects such as the positive strengths and virtues (Morales-Vives et al., 2014; Park & Peterson, 2009b; Seligman et al., 2005) mainly because of their links to desirable outcomes, such as increments in work productivity (Lavy & Littman-Ovadia, 2017), academic achievement (Wagner & Ruch, 2015) and well-being (Martínez Martí & Ruch, 2014). This interest can be seen in the postulation of the PPM and other sanity nosologies of positive traits that have been proposed over the last years (e.g., courage, humanity, peace, integrity; Cosentino & Castro Solano, 2017; De Raad et al., 2010; Huppert & So, 2013; Peterson & Seligman, 2004).
Regarding its link to DSM-5, the PPM was designed to mirror to the five-trait pathological model (Krueger et al., 2013) included in section III of DSM-5. This strategy was based on the conceptualization of a continuum between pathology and health. Thus, health and sickness are not divided by a clear line and are thought to be arbitrary points (Gunderson, 1979; Leary, 1957; Strack & Lorr, 1994). Millon’s (2011) use of spectrums to assess personality is a clear example of this postulate. In the last few years, the idea that normality and pathology should be systematized in a single conceptual framework has gained greater support (e.g., Huppert & So, 2013; Leising et al., 2009; Millon, 2011). Thus, the link between the PPM and DSM-5 model provides a common language for describing personality in such a manner.
Finally, the dimensional aspect is also a key characteristic of the model since it makes it possible to assess the presence of traits in terms of degrees for overcoming common difficulties found in categorical diagnosis (Clark et al., 1997; Cloninger, 2000; Trull & Durrett, 2005; Widiger & Samuel, 2005). A dimensional approach is thought to represent degrees of severity and comorbidity more accurately and to have greater empirical support (Widiger et al., 2006). The PPM replicates this approach since the five positive traits are assessed dimensionally.
The traits included in the PPM have already been studied in several investigations. For example, when compared to Five Factor Model normal traits - neuroticism, extraversion, consciousness, agreeableness and openness to experience - (FFM; Costa & McCrae, 1985), the PPM positive traits are better predictors of positive mental health in the general population, job performance and satisfaction, academic adjustment and achievement and complete mental health (de la Iglesia & Castro Solano, 2018, 2019a,b; de la Iglesia et al., 2019).
To operationalize the PPM, de la Iglesia and Castro Solano (2018) developed the Positive Traits Inventory-5 (PTI-5), a 60-item psychometric measure that operationalizes the five positive traits with five scales (no total score is calculated): Serenity, Humanity, Integrity, Moderation and Sprightliness. Serenity involves an outstanding management of negative emotions, both personal and external, and the ability to maintain an almost unshakeable peace. Humanity implies high sensitivity to the context and to other people with a natural inclination towards helping others, and solidarity. Integrity refers to being trustworthy, honest and humble. Moderation implies caution and reflection before action. And sprightliness involves a tendency to having self-confidence, clear goals, being active and feeling satisfied with one self. The psychometric studies conducted during its development included expert judgment, pilot studies, exploratory and confirmatory factor analyses, convergent validity studies and the analysis of internal consistency. For example, adjustment indexes obtained by CFA were CFI=0.931, SRMR=0.062, RMSEA=0.065 and Conbrach’s alphas were Serenity=.88, Humanity=.80, Integrity=.86, Moderation=.82 and Sprightliness=.90. PTI-5 has also been used to study psychotherapy progress in clinical population and its psychometric properties have been proved to be appropriate in that particular group of people (Eidman & de la Iglesia, 2021a,b).
While the PTI-5 is an appropriate measure for a detailed diagnosis of positive personality traits, the measurement may lack versatility for some diagnostic surveys or research protocols, its length could impact on attrition rates or attention levels. The use of shorter measures has been recommended for large-scale surveys and longitudinal studies, among others (Robins et al., 2001); this has been suggested mostly for research purposes and not for clinical assessments (Kemper et al., 2018). Tambs and Røysamb (2014), for example, highlight the inadequacy of long surveys for assessing health in general population-based studies remarking that these measures are usually too lengthy and space-consuming. However, they state that despite the fact that shortenings can affect reliability, this aspect usually remains sufficiently appropriate and values obtained maintain their quality since the best items are usually the ones selected and redundancy is reduced. In fact, many personality inventories have developed shorter versions to meet this need (e.g., Donnellan et al., 2006; Gosling et al., 2003).
According to Stanton et al. (2002) three main aspects need to be accounted for when developing a shorter version of an instrument: (1) the properties of the items that can be assessed by studying their relation with each other - internal item qualities; (2) the associations of the new scale with other constructs or indicators - external item qualities; and (3) the characteristics that exceed statistical analyses, such as clarity, redundancy, invasiveness and “face” validity - judgmental item qualities. If these three quality requirements are met, the new shorter version can be proposed as an adequate substitution of the original measure.
To this day, no other study has attempt to develop a short version of PTI-5. Thus, the aims of this research were to develop a short form of the PTI-5 and study its psychometric properties. To do this, the research was conducted in three sequential studies. Study 1 focused on developing the shorter version of the instrument and analysing its psychometric properties: the Positive Traits Inventory for DSM-5 - Short Form (PTI-5-SF). Study 2 replicated the analyses of PPM traits with job satisfaction, performance and well-being, in a sample of workers, using PTI-5-SF. Finally, Study 3 was performed to analyse the positive traits of the shorter version in a sample of college students and determine whether PPM traits explained academic achievement. Based on previous studies that developed shorter versions of personality scales, it is hypothesized that a shorter version of PTI-5 will show similar psychometric properties to the larger version.
Study 1
In this study, the PTI-5 was psychometrically studied to generate a shorter form. Psychometric analyses included confirmatory studies and internal consistency, convergent validity and incremental validity.
Method
Participants
The sample consisted of 1061 Argentinian adults from the general population (51% male, 40% female). Mean age was 39.8 years (SD=14.68, Min=18, Max=95). Most participants (66.8%) were living Buenos Aires Autonomous City, 28.2% in the Greater Buenos Aires, and 5% in other provinces of Argentina. As for their marital status, 30.6% of the participants were single, 24.48% married, 12.3% dating someone, 18.1% living with a partner, 10.7% divorced and 3.8% widowed. Regarding their education, 22.7% informed they had obtained a secondary school diploma, 34.4% were undergraduates and 42.9 % had finished graduate studies. Besides, most participants (77.4%) had paid jobs. In terms of socioeconomic status (SES), 64% reported middle SES, 19.9% upper- middle SES, 13.3% lower-middle SES, 1.9% high SES, and 0.9% low SES.
Measures
Positive Traits Inventory - 5 (PTI-5; de la Iglesia & Castro Solano, 2018). This is a 60-item test that measures five positive personality traits by means of five scales (no total score is addressed): Serenity (13 items), Humanity (8 items), Integrity (13 items), Moderation (9 items) and Sprightliness (17 items). The items are answered on a six-point Likert-type scale ranging from 0 (completely false) to 6 (completely true). This test is a positive reverse version of the Personality Inventory for DSM-5 - Adult (PID-5-BF; Krueger et al., 2013), a scale of pathological traits included in DSM-5 (APA, 2013). In this sample, Cronbach’s alpha for the positive traits were >.79.
Big Five Inventory (BFI; John et al., 1991). This is a measure of the five-factor model traits: extraversion, agreeableness, conscientiousness, neuroticism and openness to experience. Here we employed a 44-item Argentinian version with items answered on a 5-point Likert-type scale (Castro Solano & Casullo, 2001). The psychometric studies indicated that the measure had the expected internal consistency as well as evidence of construct and external validity. In the sample used in this study, the internal consistency of each subscale was good (Cronbach’s alphas>.70).
The Personality Inventory for DSM-5-Brief Form Adult (PID-5-BF; Krueger et al., 2013). This is a 25-item measure that assesses five pathological personality traits: antagonism, detachment, disinhibition, negative affect and psychoticism. The local version (Góngora & Castro Solano, 2017) confirmed the five-factor structure and also provided evidence of divergent validity and good internal consistency. Cronbach’s alphas for this sample were all greater than .70.
Mental Health Continuum-Short Form (MHC-SF; Keyes, 2005). This is a measure of well-being. It has 14 items grouped in three subscales - emotional, psychological and social - and a global measure. The items are answered on a 6-point Likert-type scale (0=never to 5=every day). Its factorial structure has been confirmed and it has evidence of convergent validity (Lupano Perugini et al., 2017). In this sample, Cronbach’s alpha for the total score was .88.
Procedures
This study had a cross-sectional design. Data were collected by snowball sampling technique in Buenos Aires City in 2018. Participation was anonymous and voluntary. Participants were informed about the main objective of the research and the possibility to refuse or to suspend their participation at any moment. They were asked to give their informed and written consent. No incentives were given either to data collector or to participants. Inclusion criteria were being Argentinean, being older than 18 years of age. Adults undergoing psychiatric treatment were not included in the assessment (exclusion criteria). This research followed the ethical guidelines and was approved by the National Council for Scientific and Technical Research (CONICET), the University of Palermo and the University of Buenos Aires.
Data analysis
Item selection for the shorter version of PTI-5 was guided by Stanton et al. (2002). First, five items were selected to represent each trait. In order to be eligible, the item had to be clear and represent an aspect of the trait not represented by the other items (non-redundant) as well as item-total correlation had to be greater than .30. Sample size exceeded the minimum recommended of n>600, considering the ratio of subjects to free model parameters (10:1) as suggested by Kline (2011). Once the 25 items were selected and since a confirmatory factor analysis was conducted to confirm the five-factor structure adequacy. Software employed was EQS 6.2. Model fit would be considered adequate in case CFI index is higher than .90 and, RMSEA and SRMR inferior to .08. As for χ 2 , it is expected not to be statistically significant, but this generally occurs in samples con n>200 (Schumaker & Lomax, 2016).
Afterwards, Cronbach’s alphas for each trait and correlations with the composite scores of the larger measure were assessed. The shorter version was expected to replicate the pattern of the positive and negative correlations that the larger version had with FFM and PID-5-BF measures (de la Iglesia & Castro Solano, 2018). Finally, the PTI-5-SF was expected to replicate increment validity findings regarding well-being (de la Iglesia & Castro Solano, 2018).
Results and discussion
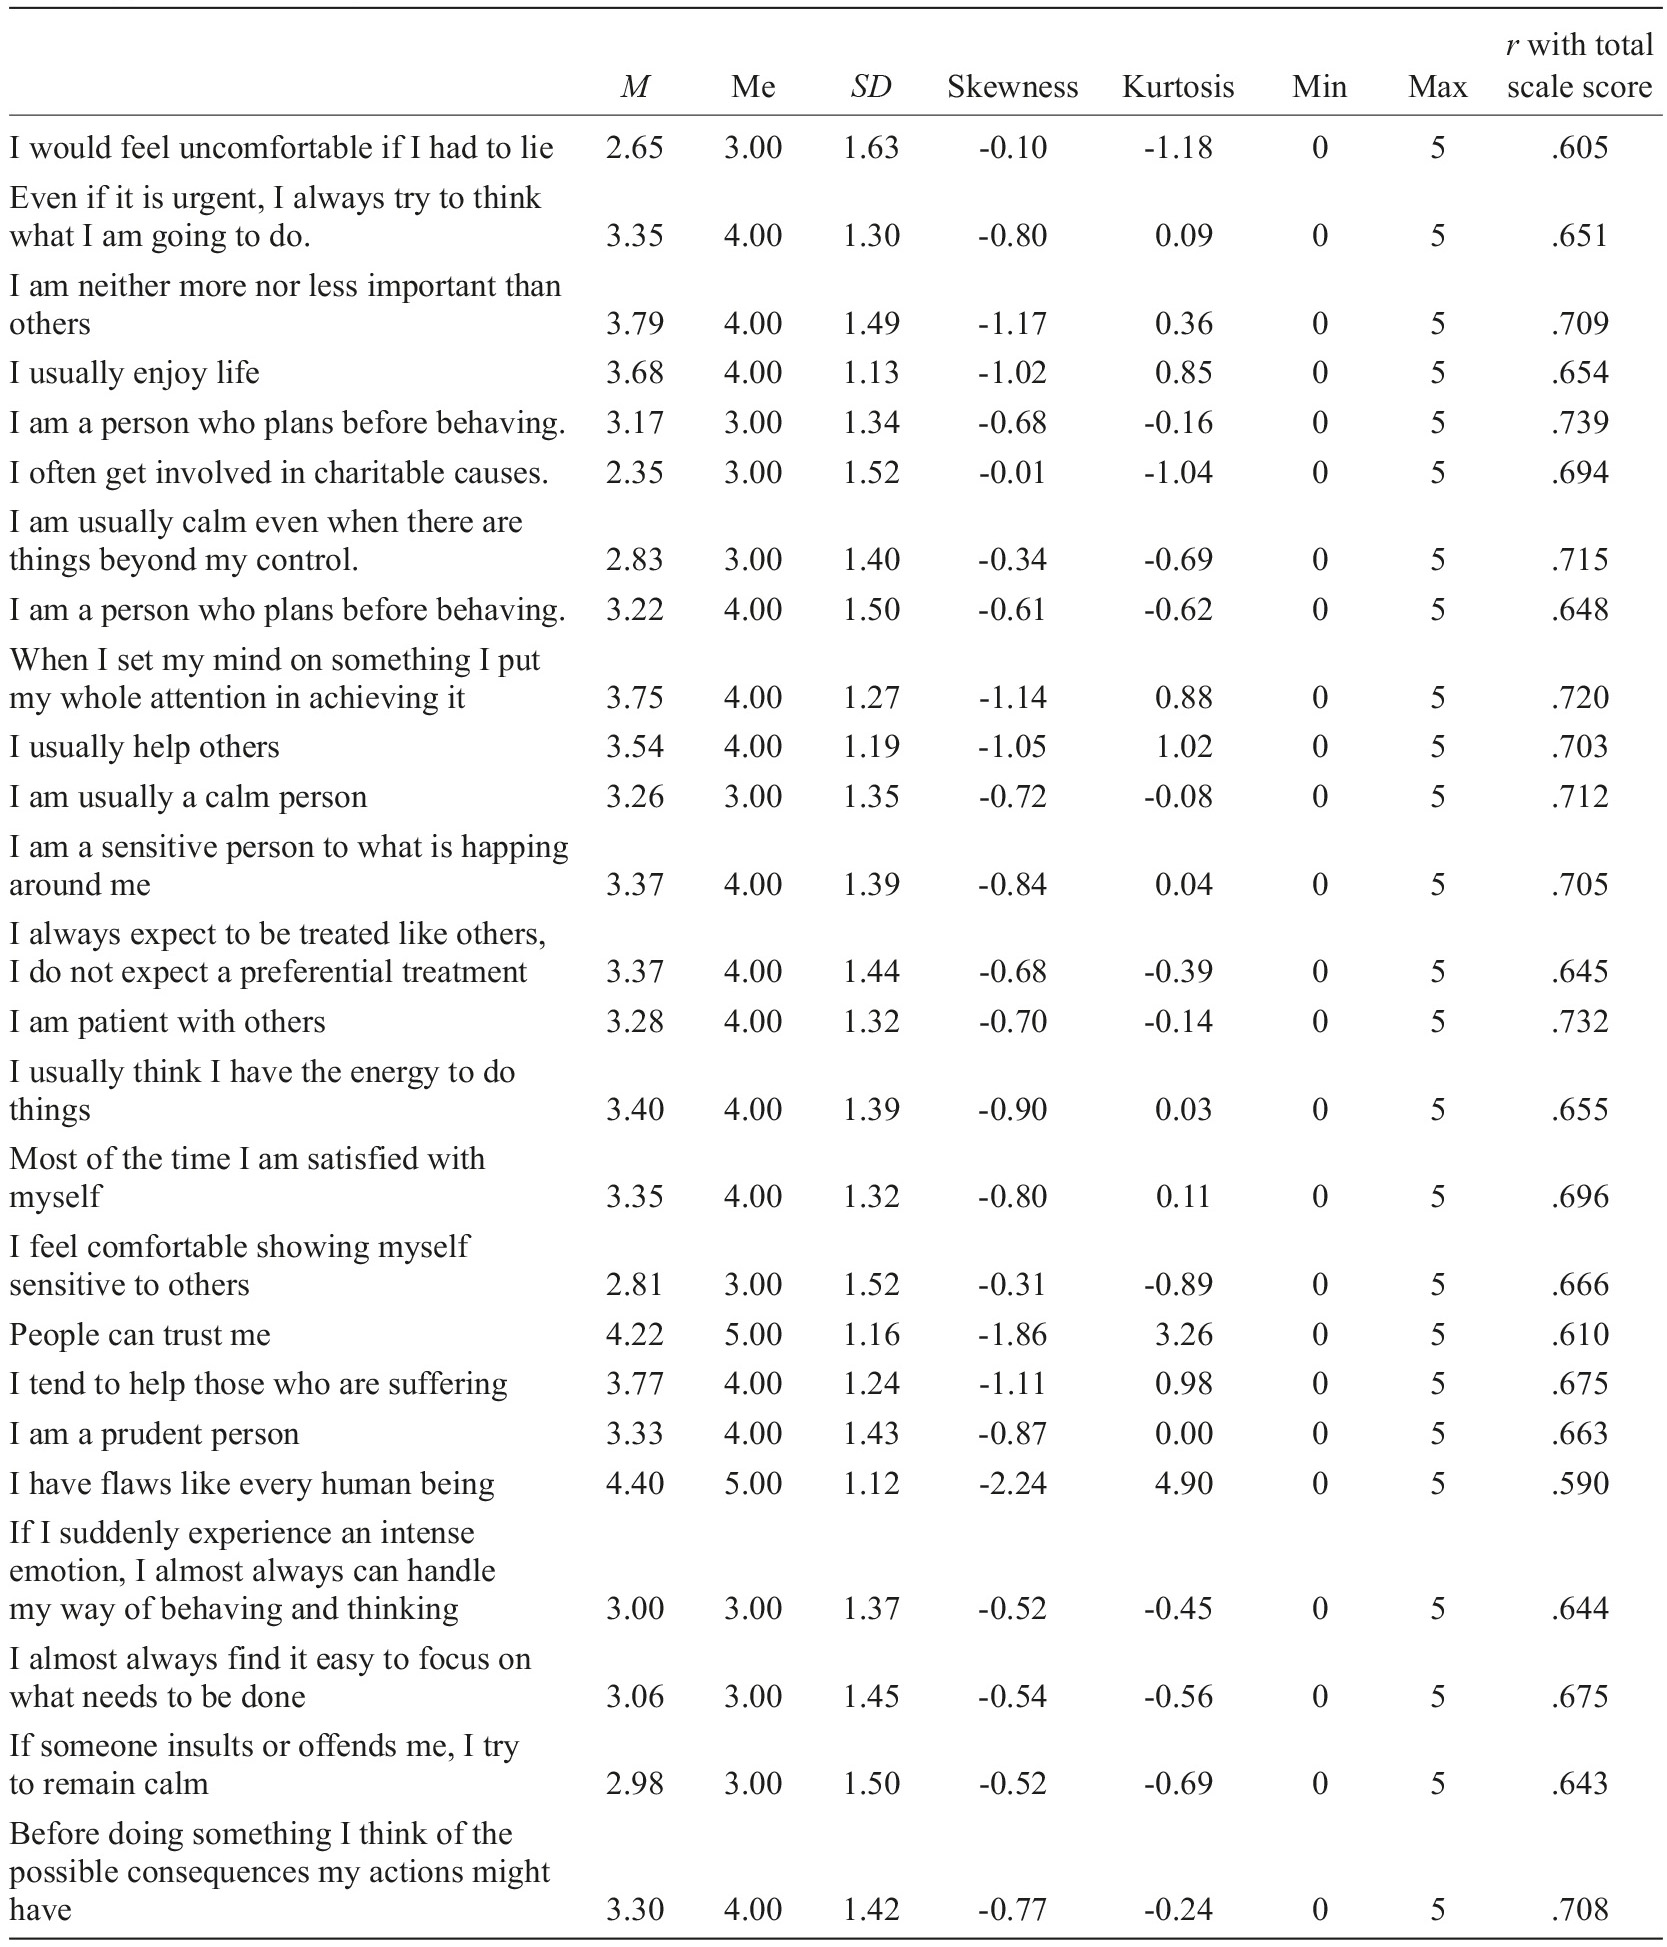
The original PTI-5 is composed by 60 elements, to obtain a shorter version of the instrument, five items were selected for each positive trait. To do this, traits’ characteristics were listed and items that represented them were selected. For example, the item “If someone insults or offends me, I try to remain calm” represented the management of negative emotions in the Serenity trait, and “I am a sensitive person to what is happing around me” the high sensitivity to the context of the Humanity trait. It was also important that they had high correlations with the total score. The 25 selected items for the shorter version of the PTI-5 contained clear statements and covered the traits to be measured in a non-redundant manner. All of them had item-total correlations greater than .55 and were statistically significant (p<.05). Items not selected for the short form were discard because of redundancy (e.g., “If I have differences with someone, I prefer to talk calmly” and “I get sensitive with certain images or situations” were similar to the items mentioned before) and because, compared to the selected items, they had lower associations with the total score. Item statements, descriptive values and correlations with total trait score of the 25 items are presented in Table 1.
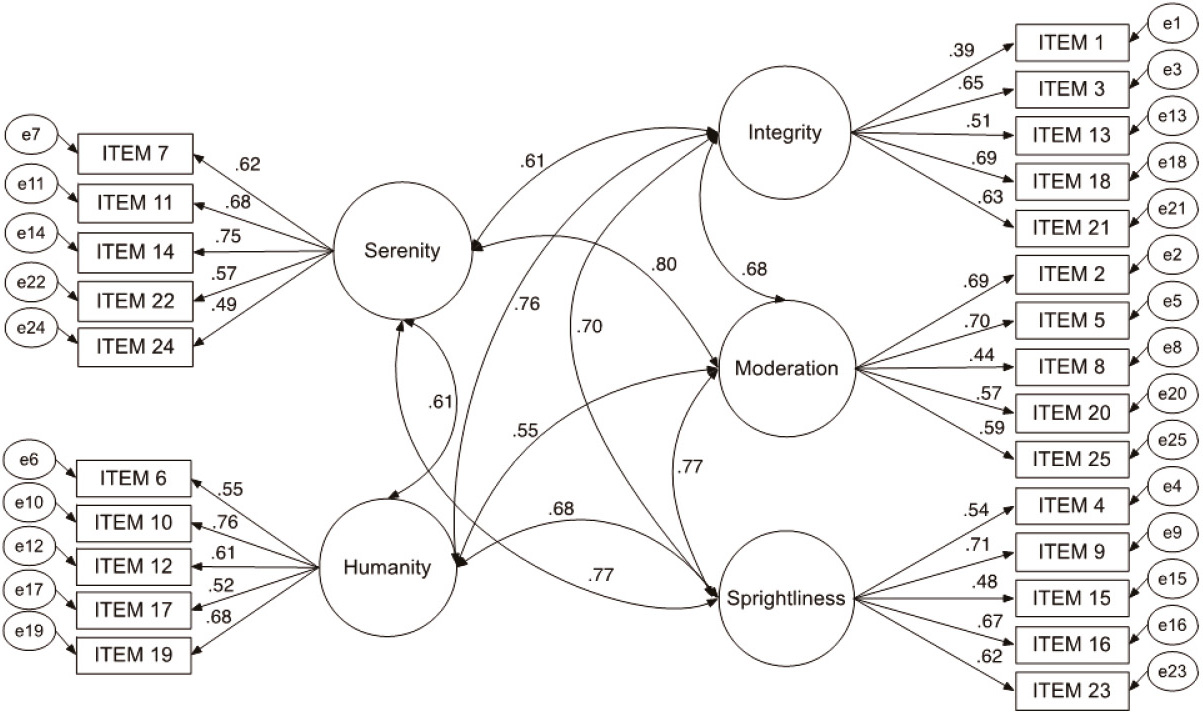
Then, a confirmatory factor analysis was calculated in order to test the adequacy of the five-factor structure. The method of estimation for the confirmatory factor analysis was robust maximum likelihood, and the matrix used was polychoric due to its better performance and adequacy when the variables are studied in a Likert-type measurement. Indexes showed that the factor structure had an excellent fit, χ 2 (300)=18991.01, p<.01, CFI=.969, RMSEA=.046 (90% CI=.042-.049), SRMR=.057 (this last value was obtained by common maximum likelihood). CFI, RMSEA and SRMR values were as expected. χ 2 was statistically significant but, as mentioned, this is common in large samples. SMRS was not assess since the software used does not provide it. Regression weights were all higher than .40 (except for item 1’s regression weight that was slightly smaller). Correlations among factors were positive and statistically significant (see Figure 1). Considering all of this information, it was concluded that the five-factor structure of the shorter version was appropriate (Schumaker & Lomax, 2016).
Besides, product-moment Pearson correlations with the longer measure traits were all statistically significant and strong: r SERENITY=.904, r HUMANITY=.922, r INTEGRITY=.887, r MODERATION=.902 and r SPRIGHTLINESS=.919. These results indicate that the scores obtained by the reduced version of the scales were highly related to those obtained by the larger version and that it would be sensible to propose them as an adequate measure. Composite reliability for each factor was Serenity=.76, Humanity=.76, Integrity=.71, Moderation=.73, and Sprightliness=.74. Both Cronbach’s alphas and McDonald’s Omegas indicated excellent internal consistency for the new shorter scales, Serenity a=.72 and w=.76, Humanity a=.71 and w=.77, Integrity a=.62 and w=.7, Moderation a=.71 and w=.74, and Sprightliness a=.71 and w=.74. These values reflect good reliability for each traits’ scores. PTI-5 do not include the assessment of a total score, and therefore, the appropriateness of a total score was not studied for and PTI-5-SF.
Additionally, to test for convergent validity, the pattern of correlations with FFM (BFI) and pathological traits (PID-5-BF) were in the directions expected: positive and moderate associations with BFI scales (except for neuroticism) and negative and moderate associations with PID-5-BF scales. The cells highlighted in Table 2 represent the traits corresponding theoretically to the trait-continuum. This results place PTI-5-SF traits in the positive pole of the sickness-health continuum of personality traits and replicates the results of the longer PTI-5 form.
Table 2 Correlations among PTI-5-SF, PID-5-BF and BFI scales (n=1601)
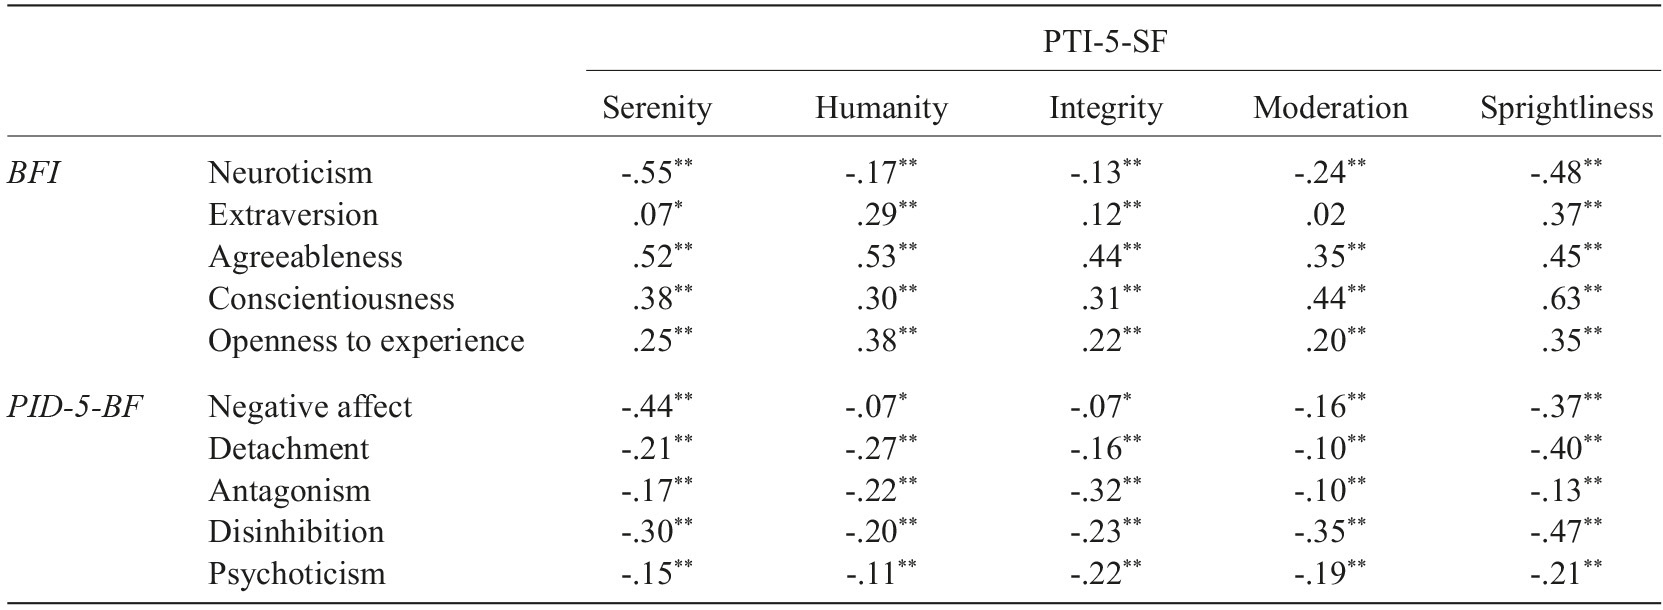
Note. *p<.05; **p<.01. PTI-5-SF=Positive Trait Inventory for DSM-5, Short-Form; PID-5-BF=Personality Inventory for DSM-5, Brief-Form; BFI=Big Five Inventory; Grey highlights for theoretically stronger associations.
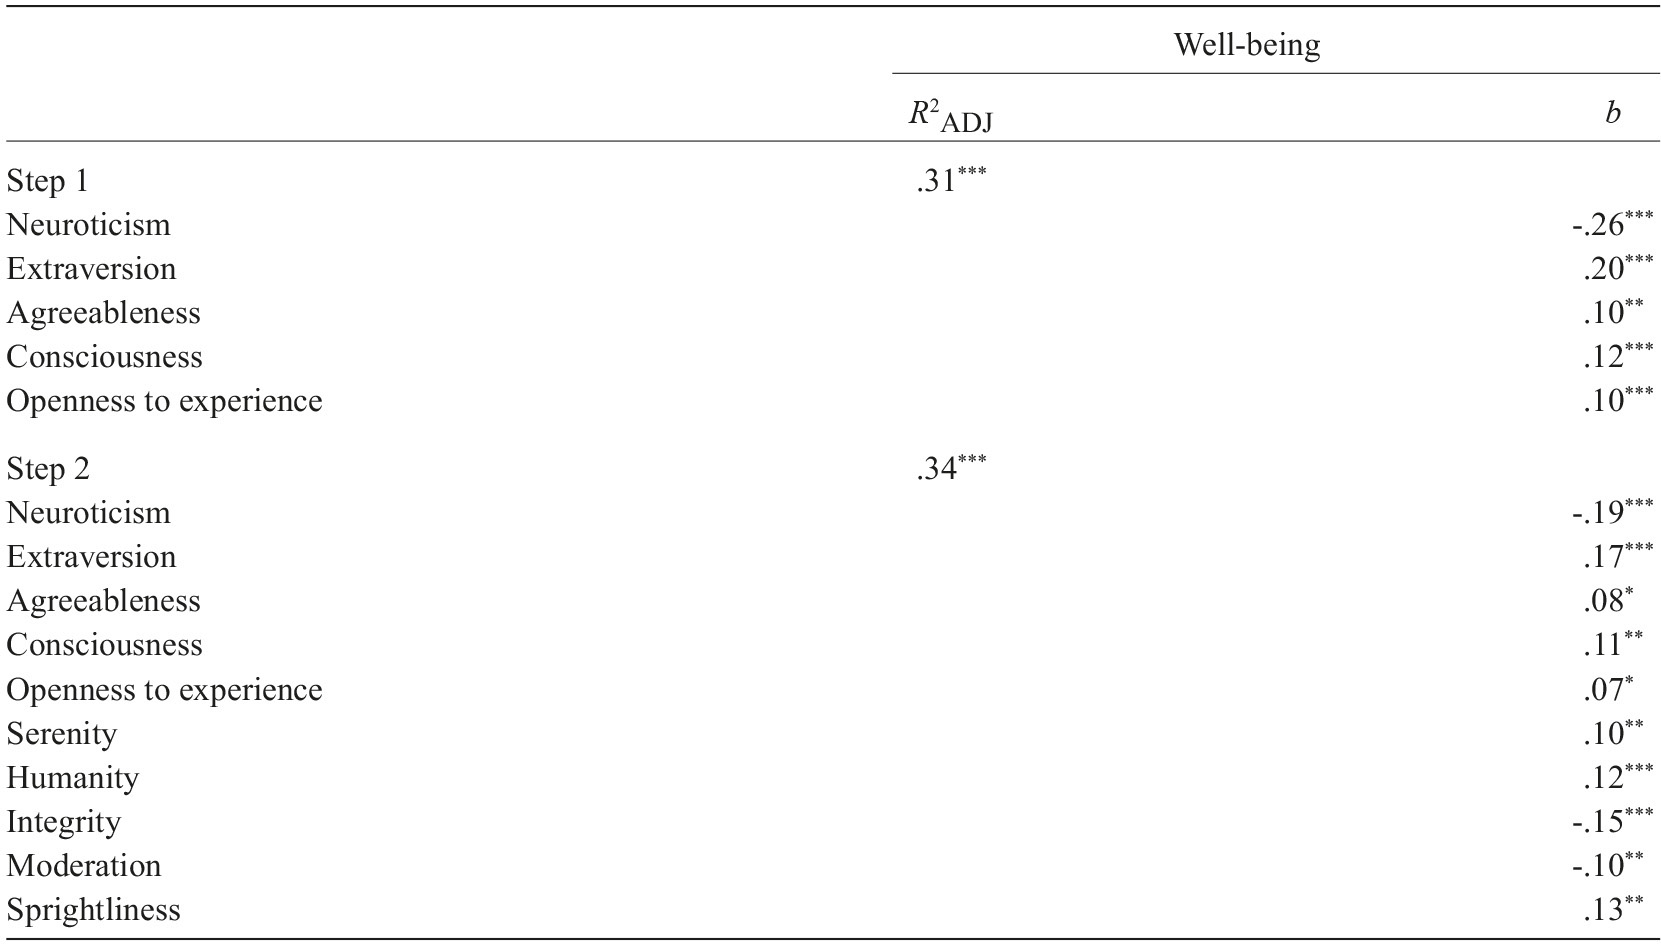
Finally, hierarchical multiple regression analyses were performed to test for PTI-5-SF incremental validity over psychological well-being beyond the variance explained by FFM traits. The Step 1 model included only FFM traits and was statistically significant (R 2 ADJ=.31, p<.001), The Step 2 model included FFM and PPM traits and was also statistically significant (R 2 ADJ=.34, p<.001). The change in R 2 was statistically significant (ΔR 2 =.033, p<.001), indicating a significant increment in the proportion of explained variance. As shown in Table 3, all traits in both models were statistically significant (p<.001). This result differs from the findings of de la Iglesia and Castro Solano (2018) where, when the five positive traits were tested as predictors of a well-being measure, Humanity, Integrity and Sprightliness were statistically significant predictors of well- being, but Moderation and Serenity resulted to be non-significant predictors of well-being. It is possible that this shorter version, which retains the most representative and psychometrically sound items, provides a purer measurement of the traits. Therefore, it may have less measurement error and perform as a more accurate predictor than the longer version.
Study 2
The aim of Study 2 was to replicate the findings of de la Iglesia et al. (2019) regarding PPM traits and job-related variables. In the mentioned study, the authors used the long PTI-5 measure to determine whether the positive traits explained similar or greater variance of different job variables - performance, satisfaction and well-being - above those explained by normal traits as measured by the FFM. Here, we aimed to replicate this analysis using the shorter version of the test.
Method
Participants
The sample was composed of 400 active workers employed in Argentina. Mean age was 36.5 (SD=11.81, Min=18, Max=66) and 50.5% were female. Regarding their education, most of them had finished graduate studies (45.5%), 27.5% were still doing their undergraduate/ had not finished their undergraduate, 17.5% had obtained a secondary school diploma and 9.75% had not finished secondary school. As for their socioeconomic status (SES), 67.8% reported middle SES, 18.5% lower-middle SES, 12.3% upper-middle SES, 1% low SES and 0.5% high SES. Concerning organizational aspects, 58.25% were working in private companies and the rest in public organizations.
Measures
Positive Traits Inventory - 5-SF (PTI-5-SF). As developed in Study 1.
Mental Health Continuum - Short Form (MHC-SF). As in Study 1.
Job Satisfaction Survey (Lupano Perugini et al., 2017). This is a six-item scale that assesses how satisfied the participants were in relation to different aspects of their jobs (e.g., payment, boss, co-workers). In this sample, Cronbach’s alpha was .79.
Performance Survey (Lupano Perugini et al., 2017). This survey consists of six items that assess self-perceived employee performance (e.g., “To what extent do you think you have accomplished the established goals”). The items are answered on a 6-point Likert scale (1=A little to 6=A lot). Cronbach’s alpha for this scale in this sample was .85.
Procedures
This study had a cross-sectional design. Data were collected by snowball sampling technique in Buenos Aires City in 2018. Participation was anonymous and voluntary. Participants were informed about the main objective of the research and the possibility to refuse or to suspend their participation at any moment. They were asked to give their informed and written consent. No incentives were given either to data collector or to participants. Inclusion criteria were being Argentinean, being older than 18 years of age, and being active workers. Adults undergoing psychiatric treatment were not included in the assessment (exclusion criteria). This research followed the ethical guidelines and was approved by the National Council for Scientific and Technical Research (CONICET), the University of Palermo and the University of Buenos Aires.
Data analysis
To replicate the findings by de la Iglesia et al. (2019) regarding PPM’s and job variables, three hierarchical multiple regressions were conducted using PTI-5-SF. The dependent variables for each regression were job performance, job satisfaction and well-being. In all cases, the model of step 1 included FFM traits and PPM traits were added to the model of step 2.
Results and discussion
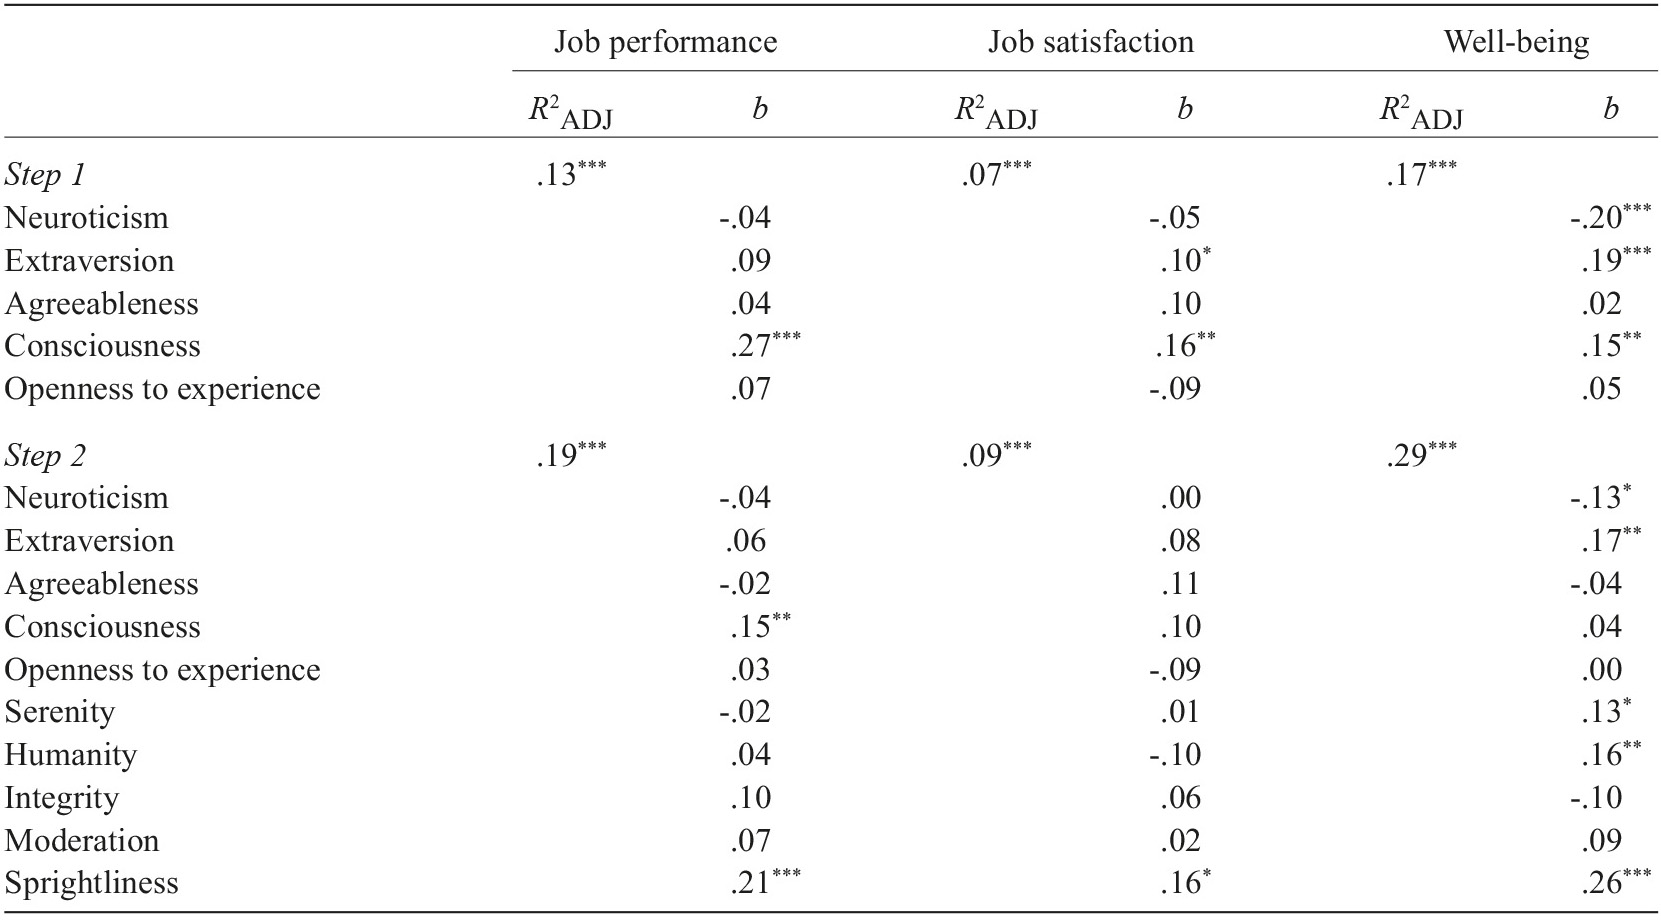
Results of the hierarchical multiple regression indicated that PPM traits showed a significant increase in the explained variance of job performance (ΔR 2 =.07, p<.001), job satisfaction (ΔR 2 =.03, p=.026) and well-being (ΔR 2 =.12, p<.001). As can be seen in Table 4, showing all PPM traits, Sprightliness was the most significant predictor of job performance, job satisfaction and well-being.
Study 3
The main objective of this study was to replicate the explicative model of academic achievement and PPM traits as measured by the long version of the test (de la Iglesia & Castro Solano, 2019a). This is based on the notion that the model postulates that PPM traits have direct effects on the presence of well-being and psychological symptoms and that this psychological state affects academic adjustment which, in turn, has a direct effect on the grade point average (Ayyash-Abdo & Sánchez-Ruiz, 2012; Bailey & Phillips, 2015; Berger et al., 2011; Kamphorst et al., 2012; Kerr et al., 2004; Lounsbury et al., 2009; Park & Peterson, 2008, 2009a; Perera & DiGiacomo, 2015; Perera et al., 2015; Petersen et al., 2009; Rinties et al., 2012; van Rooij et al., 2018; Wagner & Ruch, 2015; Zychinski & Polo, 2011).
Method
Participants
The sample was composed of 256 college students of private (49.6%) and state-run Universities (50.4%) in Argentina. Their mean age was 27.6 (SD=3.39; 51.2% female; Min=18, Max=56). Forty-four point five percent of them were doing majors in humanities/social sciences, 23.4% in natural/exact mathematical sciences, 12.5% in art, 11.7% in technical disciplines, 5.1% in teaching and 2.7% in agriculture. Regarding their socio-economic status (SES), 87.5% of the participants reported middle SES, 19.9% middle-high/high SES and 12.5% middle-low/low SES. Most of them were employed (60.9%).
Measures
Positive Traits Inventory - 5-SF (PTI-5-SF). As developed in Study 1.
Mental Health Continuum - Short Form (MHC-SF). As in Study 1.
Symptom Checklist-90 Revised (SCL-90-R; Derogatis, 1975). This test assesses the presence of psychological symptoms in the last seven days. It is composed of 90 items that are answered on a five-point Likert scale from 1 (not at all) to 5 (extremely). With this measure, it is possible to compute several composite scores. In this study, the Global Severity Index, which captures information about the general psychological distress of the individual, was used. In Argentina, SCL-90-R’s psychometric properties were appropriate (Casullo & Castro Solano, 1999; Sánchez & Ledesma, 2009). The internal consistency measured by Cronbach’s alpha in this sample was .97.
Academic Adjustment Scale (Anderson et al., 2016). This scale measures students’ self-perception of their adjustment to university life. The Argentinean version is composed of five items that are answered on a 6-point Likert scale (0=almost never to 5=always). Cronbach’s alpha for the total score in this sample was .78.
Procedures
This study had a cross-sectional design. Data were collected by snowball sampling technique in Buenos Aires City in 2018. Participation was anonymous and voluntary. Participants were informed about the main objective of the research and the possibility to refuse or to suspend their participation at any moment. They were asked to give their informed and written consent. No incentives were given either to data collector or to participants. Inclusion criteria were being Argentinean, being older than 18 years of age, and being college students. Adults undergoing psychiatric treatment were not included in the assessment (exclusion criteria). This research followed the ethical guidelines and was approved by the National Council for Scientific and Technical Research (CONICET), the University of Palermo and the University of Buenos Aires.
Data analysis
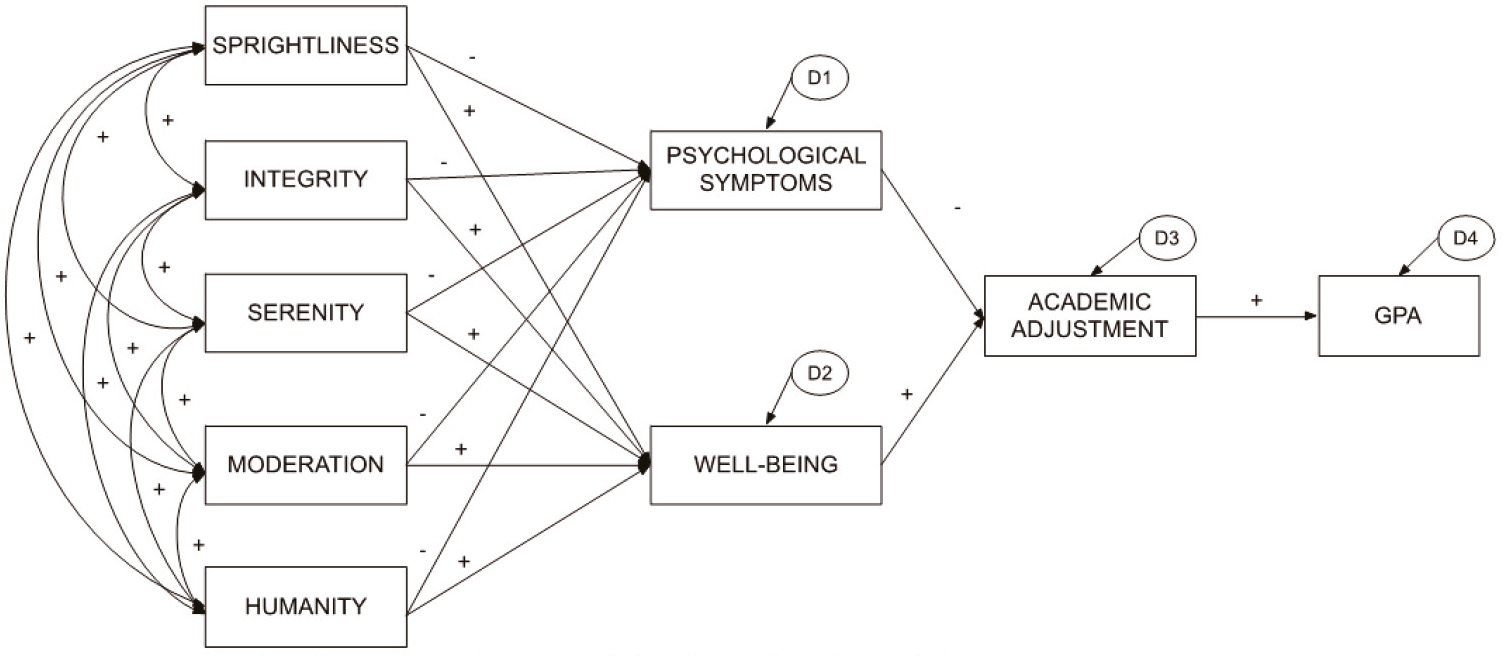
To test the explicative model of academic achievement structural equation modelling was calculated using EQS 6.2. Sample size did not meet the minimum recommended of n>320, considering the ratio of subjects to free model parameters (10:1) as suggested by Kline (2011). Method of estimation was robust maximum likelihood. Model fit would be considered adequate in case CFI and IFI indexes are higher than .90, and RMSEA and SRMR inferior to .08. As for χ 2 , it is expected not to be statistically significant, but this generally occurs in samples con n>200 (Schumaker & Lomax, 2016). The hypothesized model is shown in Figure 2. Direct effects on the endogenous variables were interpreted by their standardized beta weights. Indirect effects were estimated as the product of the standardized beta weights of the direct effects that comprised them (Kline, 2011). They were considered to be statistically significant when p<.05.
Results and discussion
Fit indexes showed an excellent fit of the model [χ 2 (36)=509.97, CFI=.929, IFI=.932, RMSEA=.101, 90% CI=.070-.133, SRMR=.053]. The model explained 10.6% of the variance in the grade point average and 13.4% of the variance in academic adjustment. Sprightliness, Serenity and Humanity positive traits were found to have positive direct effects on well-being. In contrast, Moderation had a negative direct effect on well-being, and Integrity had no effect on well-being. Additionally, Sprightliness and Serenity were negative predictors of the presence of psychological symptoms, and Moderation was positive predictor of psychological symptoms (Figure 3).
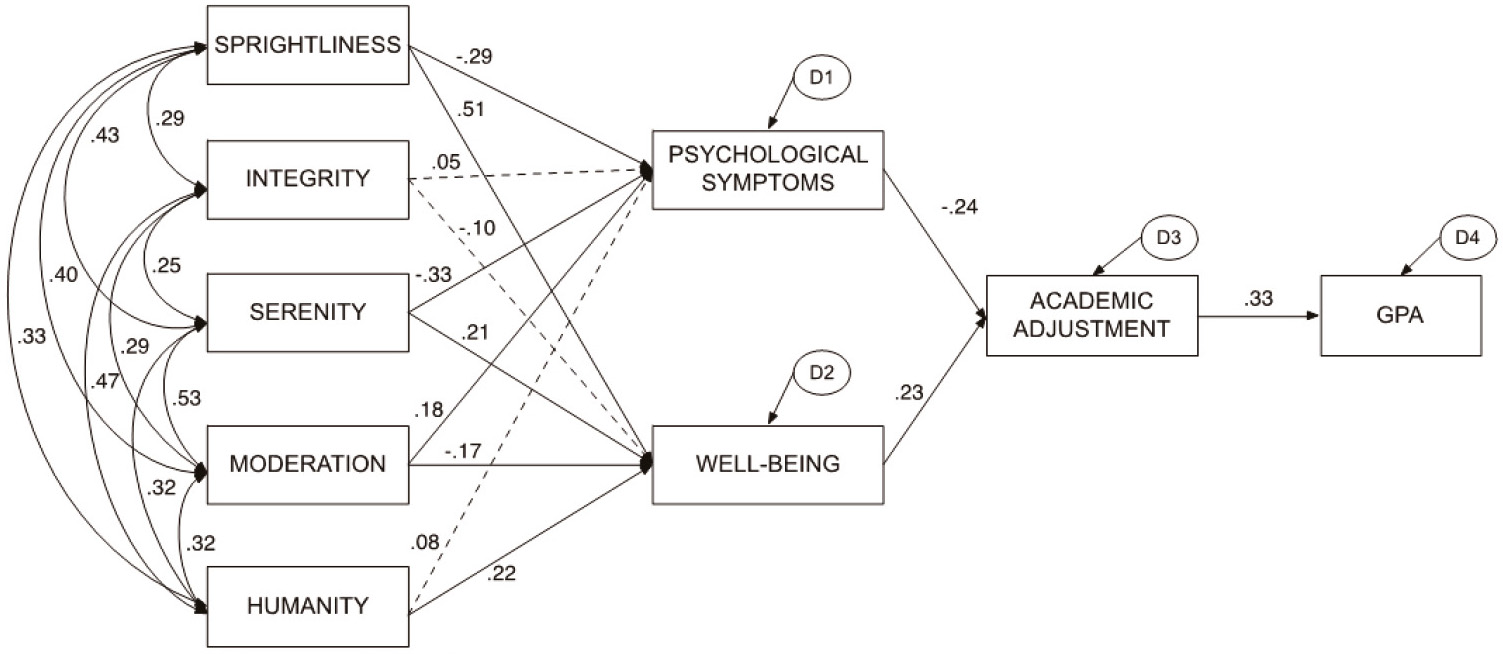
PPM indirect effects on GPA were statistically significant (p<.05) for Sprightliness=.06, Serenity=.04 and Moderation=-.03. Integrity and Humanity had no significant indirect effects on achievement (p>.05). Well-being also had a positive direct effect on AA, and the presence of psychological symptoms had a negative direct effect on AA. Finally, AA had a positive direct effect on GPA.
General discussion
The main objective of this research was to develop a short version of the Positive Traits Inventory for DSM-5 (PTI-5-SF) by conducting three studies. In Study 1 we selected 25-item of the long version of the test. This shorter version proved to be characterized by adequate coverage of the positive traits and also had excellent empirical psychometric properties in terms of validity and reliability. In Studies 2 and 3, the PPM traits measured by the SF were analysed in a sample of workers and in another of college students. They were done in order to replicate the results found with the long version of the test (de la Iglesia & Castro Solano, 2019a; de la Iglesia et al., 2019). In both cases, the replications were successful. PPM traits increased the explained variance of job performance, job satisfaction and well-being over the variance explained by FFM traits. Further, in the case of Study 3, PPM traits, as measured by the shorter version, were found to be significant background variables in the prediction of academic achievement.
As in previous findings, in all cases, Sprightliness stood out as the most important PPM trait in explaining different outcomes. It is evident that this trait, which entails the clarity of mind needed to identify personal goals and pursue them in an invigorating and joyful manner, is an important characteristic for human beings. As expected, PPM traits in general increased the explained variance of different outcomes beyond that of FFM traits. This evidences the importance of exploring and studying sanity nosologies that cover positive aspects beyond those valued as expected or normal. It also goes in line with previous findings that positive traits are better predictors of optimal functioning than normal traits (Drozd et al., 2014; Duan et al., 2012; Elston & Boniwell, 2011; Gander et al., 2012; Meyers & van Woerkom, 2014; Mongrain & Anselmo-Matthews, 2012; Wood et al., 2011; Young et al., 2014). The shorter scale here developed can be used more widely due to its brevity which maintains the psychometric characteristic of its longer version and replicates the results previously found it.
As for the limitations of this research, it is important to mention same probable sources of method bias. Firstly, sample was non-probabilistic and therefore, no complete generalization of the results obtained can be made. Regarding the college students’ sample of Study 2, it is important to mention that most of them were employed (60.9%). This may have affected the results obtained since working students may present higher stress levels than non-working students (Mukherjee et al., 2016). Being exposed to a more stressful everyday environment due to work obligations could increase psychological symptoms and reduce academic adjustment and performance. However, it is important to highlight that positive traits, as the ones studied here, have been shown to play an important role in reducing the negative outcomes of stress in working college students (Chang et al., 2020). In the case of Study 3, minimum sample size as suggested by Kline (2011) was not reached. This may have affected the estimated parameters. Additionally, subjects under study were mostly from middle SES and educated which represents a part of the Argentinean population and not all population. Also, many relevant variables such as psychiatric precedents, psychotherapy treatment and cognitive characteristics were left out due to viability issues. It may be possible that those variables play relevant roles in the associations studied here. Besides, the cross-sectional character of the design prevented us from establishing causal relations and effects. Related to this, results of Study 3 should be considered carefully since the model tested relies on cross-sectional data. Future studies could overcome these limitations and conduct longitudinal designs as well as cross-cultural validation studies as these were Argentine samples.
The development of PTI-5-SF was guided by the recommendations of Stanton et al. (2002). Our findings make it possible to state that the internal, external and judgmental qualities of the short form are appropriate. Therefore, this short form is recommended for research or screening assessments. To conclude, PTI-5-SF is an appropriate measure mainly for research purposes since it may be included in long surveys without running the risk of increasing attrition or jeopardizing attention. It can also be used in applied settings with caution since it should not be used as a diagnostic tool but as a screening measure. This psychometric instrument can be used as an accurate measure of the PPM (de la Iglesia & Castro, 2018) because it has greater versatility due to its reduced length.

