SciELO - Scientific Electronic Library Online

 
vol.40 issue2Positive Traits Inventory: Psychometric analyses of a short formAdaptation of the Phubbing Scale and of the Generic Scale of Being Phubbed for the Portuguese population author indexsubject indexarticles search
Home Pagealphabetic serial listing  

Services on Demand

Journal

Article

Indicators

Related links

  • Have no similar articlesSimilars in SciELO

Share


Análise Psicológica

Print version ISSN 0870-8231On-line version ISSN 1646-6020

Aná. Psicológica vol.40 no.2 Lisboa Dec. 2022  Epub Dec 31, 2022

https://doi.org/10.14417/ap.1885 

Métodos e Instrumentos de Investigação

Examination of a bifactor model of the Obsessive-Compulsive Inventory-Revised

Adequação dum modelo bifatorial ao Obsessive Compulsive Inventory-Revised

Miguel Faria1  2  , Conceptualization, Methodology, Writing - Original draft preparation, Writing - Review and editing
http://orcid.org/0000-0002-6142-0506

Paulo Sargento1  2  3  , Formal analysis, Writing - Original draft preparation, Writing - Review and editing
http://orcid.org/0000-0002-8952-426X

Marta Branco1  , Data analysis, Data curation
http://orcid.org/0000-0003-4350-3452

Mónica Teixeira1  4  , Formal analysis, Writing - Review and editing
http://orcid.org/0000-0003-0038-1168

1 NICiTeS - Núcleo de Investigação em Ciências e Tecnologias da Saúde, IPLUSO - Instituto Politécnico da Lusofonia, Lisboa, Portugal

2 Clínica São João de Deus, Lisboa, Portugal

3 CEAD - Centro de Estudos Avançados em Direito “Francisco Suarez”, Lisboa, Portugal

4 REQUIMTE/LAQV, Instituto Superior de Engenharia, Instituto Politécnico do Porto, Porto, Portugal


Abstract

The current study evaluated a bifactor model for the Obsessive-Compulsive Inventory Revised (OCI-R) in two samples, with (n=188) and without (n=408) obsessive-compulsive disorder (OCD). Since the OCI-R has been traditionally conceptualized as a correlated six-factor instrument, our goal was to evaluate the fit of a bifactor model against three competing models (one general factor, six correlated factors and a hierarchical model). Results revealed that the bifactor model presented the best fit and that all OCI-R items were influenced by a general factor and by one of the six dimensions. Model-based reliability estimated via Omega hierarchical for the total score suggested that OCI-R items are multidimensional, with the general obsessive-compulsive (OC) factor accounting for little more than half of the variability in the items of the total score, with the remaining variability accounted for by the specific OC domains and other sources of variance. Measurement invariance of the bifactor model was also supported among those with and without OCD. Implications for better understanding the structure and further use of the OCI-R are discussed.

Keywords: Obsessive compulsive disorder; Bifactor model; OCI-R.

Resumo

Este trabalho avaliou a adequação dum modelo bifatorial ao Obsessive-Compulsive Inventory Revised (OCI-R) em duas amostras, com (n=188) e sem (n=408) perturbação obsessivo-compulsiva (POC). Dado que o OCI-R tem sido tradicionalmente conceptualizado como um instrumento de seis fatores correlacionados, o nosso objetivo foi o de avaliar o ajustamento dum modelo bifatorial, testado contra três modelos concorrentes (um fator geral, seis fatores correlacionados e um modelo hierárquico). Os resultados revelaram que o modelo bifatorial apresentou o melhor ajuste, e que todos os itens do OCI-R foram influenciados por um fator geral e por uma das seis dimensões. A fidelidade deste modelo, estimada através do Ómega hierárquico para a pontuação total, sugere que os itens do OCI-R são multidimensionais, com o fator obsessivo-compulsivo geral (OC) a representar pouco mais de metade da variabilidade nos itens da pontuação total, com a variabilidade restante atribuível às dimensões específicas de OC e a outras fontes de variação. A invariância do modelo bifatorial foi também verificada nos grupos com e sem POC. São discutidas implicações para uma melhor compreensão da estrutura e posterior utilização do OCI-R.

Palavras-chave: Perturbação obsessivo-compulsiva; Modelo bifatorial; OCI-R.

Introduction

According to the Diagnostic and Statistical Manual of Mental Disorders (DSM-5; American Psychiatric Association [APA], 2013), the obsessive-compulsive disorder (OCD) is characterized by the presence of recurrent obsessions and/or compulsions that severely interfere with the daily functioning. Obsessions can be described as intruding thoughts, images or impulses that pervade the person’s stream of consciousness, without the subject being able to control them, while compulsions consist in repetitive behaviors, mental acts or rituals that the person feels compelled to perform, even if there is a desire to resist them. Compulsions may be performed in response to an obsession, like saying “magical” words to avoid certain things to happen, or they may consist in a set of rigidly performed actions, like washing and drying one’s hands exactly four times before leaving a washroom, or repeating six times a certain phrase to prevent a certain situation. In general, compulsions are usually intended to avert some feared event or to reduce distress, and most of the time they are not realistically connected with the things they try to prevent.

Measures

Several measures were developed to assess OCD, namely the Padua Inventory (PI; Sanavio, 1988) and its revisions, the Padua Inventory-Washington State University Revision (PI-WSUR; Burns et al., 1996) and the Padua Inventory-Revised (PI-R; Van Oppen et al., 1995), the Yale-Brown Obsessive-Compulsive Scale (Y-BOCS; Goodman et al., 1989) and the Y-BOCS-II; Storch et al., 2010), the Dimensional Obsessive-Compulsive Scale (DOCS; Abramowitz et al., 2010), the Vancouver Obsessive Compulsive Inventory (VOCI; Thordarson et al., 2004), the Inventory Obsessive-Compulsive - Revised (Rosa et al., 2005), the Schedule of Obsessions, Compulsions, and Pathological Impulses (SCOPI; Watson & Wu, 2005), the Obsessive-Compulsive Inventory (OCI; Foa et al., 1998) and the Obsessive-Compulsive Inventory Revised (OCI-R; Foa et al., 2002). Of the above, the Y-BOCS and Y-BOCS-II, which are clinician-rated instruments and mainly the OCI-R, a self-report instrument, are the most widely used (Angelakis et al., 2017; Hon et al., 2019; Koike et al., 2020; Overduin & Furnham, 2012; Wootton et al., 2015).

One commonly referred limitation of some of these measures is the fact that they often assess obsessions and compulsions separately, but several symptom dimensions include obsessions as well as compulsions (Anholt, 2010; Deacon & Abramowitz, 2005; Mataix-Cols et al., 2005). Another limitation of some of the above measures is the fact that their scores depend on the number and types of obsessive-compulsive (OC) symptoms, and this approach may not take symptom severity into appropriate account (Olatunji et al., 2017).

Several studies using factor analytic procedures have grouped OC symptoms into a small number of factors (Taylor et al., 2010), which include (a) checking compulsions, (b) washing rituals, (c) hoarding, (d) ordering and symmetry compulsions, (e) cognitive neutralizing rituals (i.e., mental acts of “undoing” the anticipated effects of a “bad” thought), and (f) obsessions characterized by aggressive, sexual, or religious themes (Foa et al., 2002; McKay et al., 2004). These six factors, apart from contributing to a total score, are assessed as individual dimensions in the OCI-R.

According to the Obsessive Compulsive Cognitions Working Group (OCCWG), normal and OCD individuals do not differ in the thoughts they have, but in the cognitive contents and processes, with the OC individuals evaluating the occurrence and content of their thoughts as personally important, highly unacceptable or immoral (Abramowitz et al., 2010). Therefore, the transition from normality to obsessive pathology is linked to the process that attaches dysfunctional appraisals or misinterpretations to the individual’s intrusive thoughts. Empirical research has shown that over 80% of non-clinical individuals reported the presence of intrusive thoughts, images or impulses in a similar manner of those with OCD, indicating that clinical conditions may be seen as an extreme variant of the above (Bouvard et al., 2017; Olatunji et al., 2008). In this scenario, the use of a cutoff score cannot be seen as a definitive threshold between OC and non-clinical groups. Also, the fact that most of the non-clinical individuals present in a mild form the symptoms of people with OCD, may be seen as an indicator in favor of a general factor, and thus a bifactor model, which could be present both in non-clinical and clinical groups.

In the original article the OCI-R was presented as a self-rating scale designed to assess the severity and type of symptoms of those potentially dealing with OCD (Foa et al., 2002), and a cutoff score of 21 was suggested to distinguish individuals with OCD from those without it, and the same value was recommended by others (Abramowitz & Deacon, 2006; Belloch et al., 2013; Kilicaslan et al., 2020), although different cut scores, ranging from 14 to 36 have been used in various populations (Abramowitz & Deacon, 2006; Gönner et al., 2008; Williams et al., 2013), but these discrepant values were probably due to heterogeneity of the samples used (Wootton et al., 2015). In our opinion, the use of a cutoff score, although necessary to distinguish NC and OC individuals, is limited in its interpretation, because of the continuous nature of these symptoms. In this perspective, anyone with 22 or more in the total score is classified in an OC group, but large differences exist in the range from 22 to 72, in terms of the symptom severity.

As mentioned above, the OCI-R is commonly used as the screening instrument for OCD in a large number of studies, which assess OCD symptoms and its relation with a wide variety of situations, namely alexithymia (Khosravani et al., 2017), epilepsy (Kilicaslan et al., 2020; Kim et al., 2020), suicidal experiences (Angelakis & Gooding, 2020), sexual functioning (Ghassemzadeh et al., 2017; Raisi et al., 2015), psychotic disorders (Schirmbeck et al., 2019), therapy outcome (Cludius et al., 2020; Külz et al., 2019; van Passel et al., 2016), neuropsychological performance (Winkworth & Thomas, 2019) or brain morphology and neurophysiological correlates of OCD (Hirose et al., 2017; Wagner et al., 2019; Wang et al., 2020; Yagi et al., 2017).

The bifactor model

In many situations, psychological instruments assess constructs that are comprised of a general factor and several related domains, which may be represented in one of two ways, through hierarchical models or bifactor models. Hierarchic or second-order models are used when specific lower-order factors are substantially correlated with each other, and a higher-order factor is hypothesized to account for the relationship among the lower-order factors (Mansolf & Reise, 2017).

Bifactor models can be used when there is a general factor that is hypothesized to account for the commonality of the items, as well as multiple domain specific factors, each of which is responsible for the unique influence of the specific domain over and above the general factor (Chen et al., 2006; Reise, 2012). The hierarchical and bifactor models differ essentially in the fact that in the hierarchical models, second-order factors explain the primary factors, which in turn explain item variation, while in the bifactor models, the general factor influences item variation directly, what means that in the bifactor models, the general factor and group factors compete equally to explain item variance and are set to be independent to each other (Chen et al., 2006; Mansolf & Reise, 2017). Thus, the bifactor model allows for the indicators to simultaneously load on an overall primary dimension and secondarily on distinct factors or domains, with specific factors modelling the residual association between the items once the contribution of the primary factor has been accounted for (Gibbons et al., 2007). The bifactor model provides an alternative to other non-hierarchical multidimensional representations of psychological concepts (Reise et al., 2007). In the typical specification of the bifactor model there are at least three indicators for each specific/group factor, which is the present case for the OCI-R, with one general factor and the six (uncorrelated) dimensions. Although the bifactor model may not be appropriate for all data and psychological phenomena, the bifactor model has been found to fit psychological data well across different problem areas, sample types, and ages (e.g., Ebesutani et al., 2014; Olatunji et al., 2019; Reise, 2012; Reise et al., 2007).

One notable advantage of the bifactor model is that it allows for easier interpretation and understanding of how specific content domains relate to external variables above and beyond the general factor. Therefore, the bifactor model may prove to be a useful approach to the OCD, since we can think of a structure with several dimensions being influenced by a general OC factor (Olatunji et al., 2017; Reise, Bonifay et al., 2013).

Although the bifactor model may be a valuable approach to better understand the structure of OC symptoms, no studies have examined the utility of this model in the OCI-R, with the vast majority of the studies so far mainly considering the six-factor correlated structure both in clinical (Abramowitz & Deacon, 2006; Belloch et al., 2013), non-clinical (Faria & Cardoso, 2017; Fullana et al., 2005; Hajcak et al., 2004; Malpica et al., 2009; Ólafsson et al., 2013; Roberts & Wilson, 2008; Zermatten et al., 2006) and both types of samples (Sica et al., 2009; Solem et al., 2010; Souza et al., 2011; Williams et al., 2013).

The present study aims to evaluate how the bifactor model fits the OCI-R, compared with three competing models - a general single factor model, a hierarchical second order model and the traditional correlated factors model.

Method

Participants

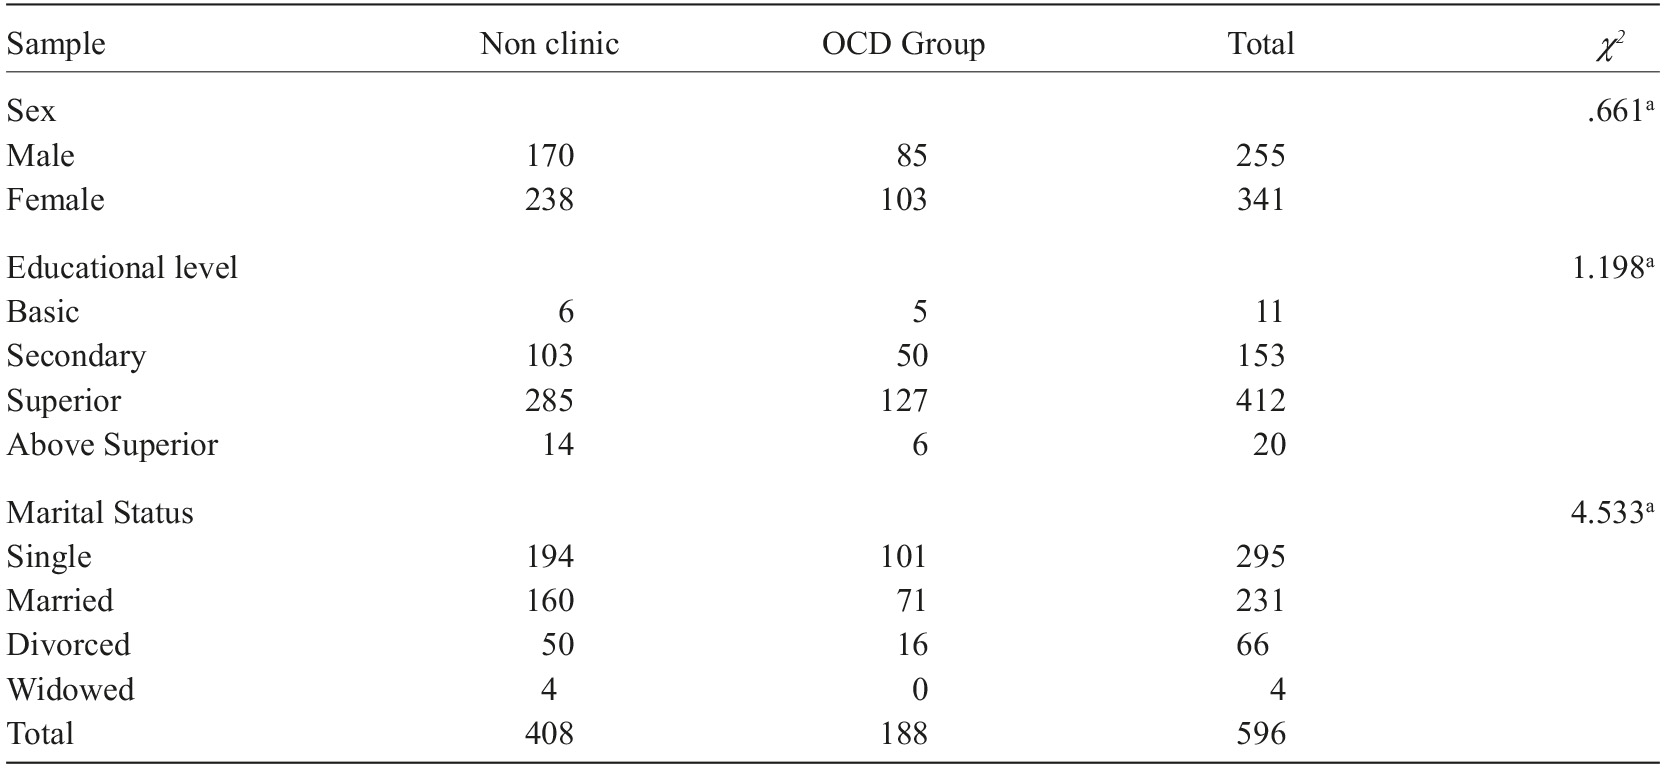
A total of 596 Portuguese adults participated in this study, 188 diagnosed with OCD and 408 without OCD from general population. In the OCD group (85 males, 103 females) ages ranged from 18 to 50 years old (M=33.8, SD=8.3), while in the non-clinical (NC) group (170 males and 238 females) ages ranged from 18 to 45 years old (M=32.5, SD=7.7). The clinical group was recruited in two private institutions and two central hospitals. Patients were diagnosed with OCD in accordance with DSM-V criteria in psychiatric consultation. Diagnosis times ranged from 4 months to 12 years, with a mean value of 2.5 years (SD=2.5). No differences were found for OCD and NC groups for age [t (594)=-1.78, n.s.], gender, educational level or marital status, p>.05 (see Table 1).

Table 1 Sociodemographic characteristics of the sample 

Note. aAll χ 2 non-significant (p>.05).

Measures

Participants answered a sociodemographic questionnaire, where information about age, gender, educational level and marital status were collected. For the clinical group, diagnosis time was also asked.

Obsessive-compulsive disorder was assessed by the Obsessive-Compulsive Inventory - Revised (OCI-R; Foa et al., 2002), an 18-item self-assessment questionnaire that evaluates the degree of disturbance regarding obsessive-compulsive symptoms during the last month. Responses are given on a five-point scale, from 0 (Not at all) to 4 (Extremely). The OCI-R includes six dimensions, (a) Hoarding, (b) Checking, (c) Ordering, (d) Neutralizing, (e) Washing, and (f) Obsessing, with three items each. The results for each subscale range from 0 to 12 and a total score is calculated by the sum of the 18 items, ranging from 0 to 72. The higher the total score on the scale, the higher the prevalence of symptoms.

The OCI-R showed good psychometric properties in several studies (Abramowitz & Deacon, 2006; Faria & Cardoso, 2017; Fullana et al., 2005; Malpica et al., 2009; Solem et al., 2010). In our study, the Portuguese version of the OCI-R (Faria & Cardoso, 2017) was used, which exhibited good convergent and divergent validity and Cronbach’s alpha values ranging from .61 to .90 for the six subscales and .89 for the 18-item scale (Faria & Cardoso, 2017).

Procedure

After approval of the ethical committee, clinical data were collected in four clinical institutions that specifically attend OCD patients, in two large Portuguese cities. Participants were assessed through a self-report protocol in an individual context, after their informed consent and explanation of all ethical issues. The whole protocol took about 15-20 min to complete (this study was part of a larger one, which also included the Beck Depression Inventory, the Beck Anxiety Inventory and the Yale-Brown Obsessive Compulsive Scale-II).

Data analytic approach

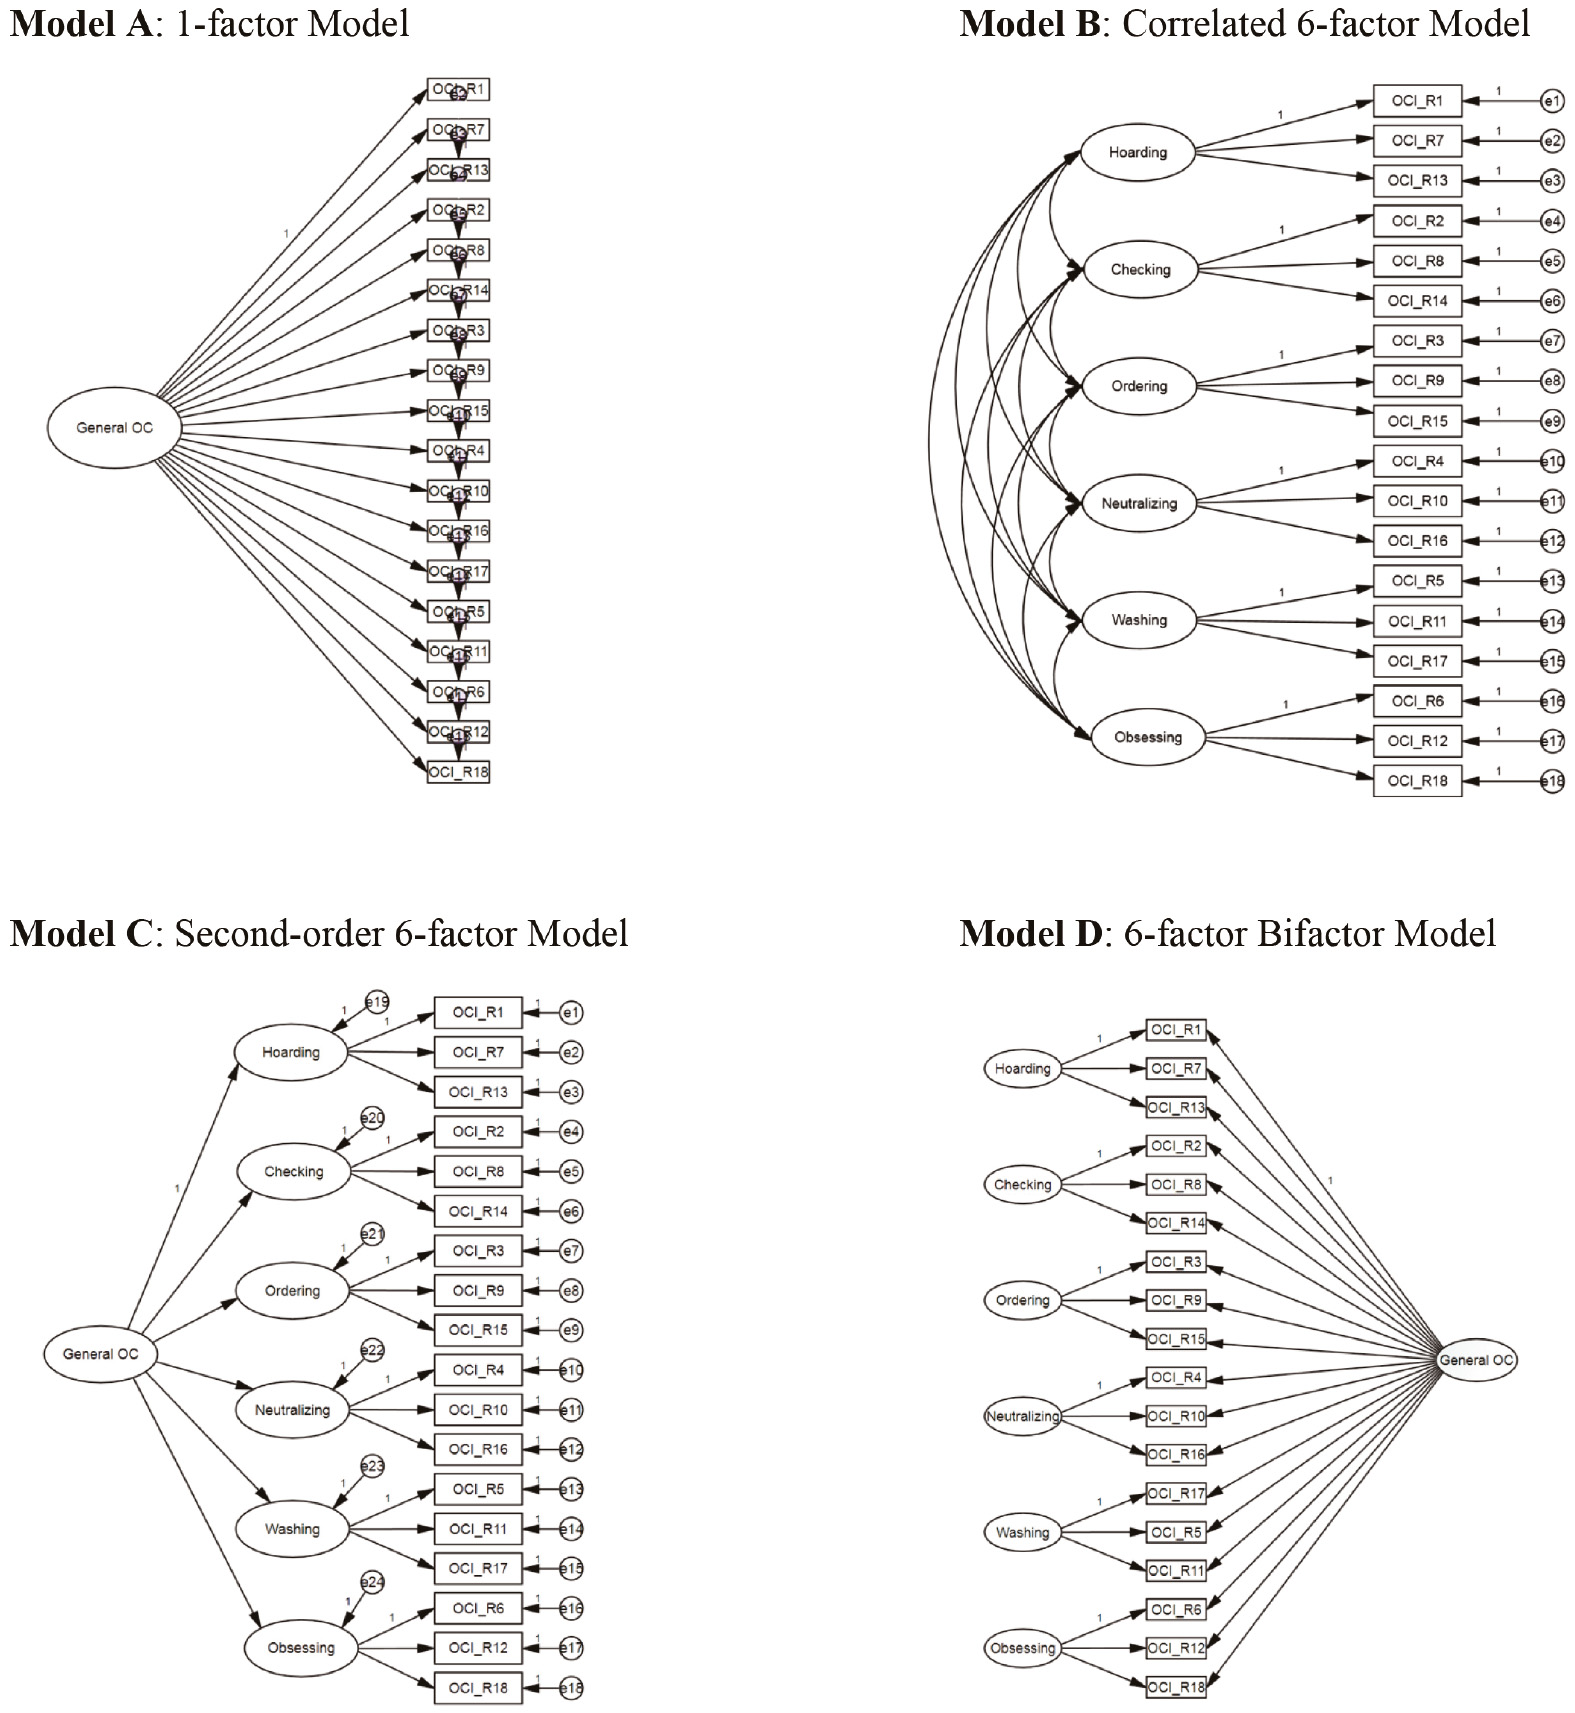
Confirmatory Factor Analyses. A confirmatory factor analysis (CFA) was conducted on the OCI-R using maximum likelihood method with robust estimators in EQS 6.3 (Bentler, 2006). Four models were tested (see Figure 1). The first (Model A) was a single-factor model with all items loading on one factor representing the general obsessive-compulsive dimension; the second (Model B), was a correlated 6-factor model (corresponding to the checking, ordering, neutralizing, washing and obsessing dimensions); the third (Model C), was a second order-model, where a general factor loads on the six dimensions and finally, a bi-factor model (Model D) with the six dimensions and a general factor loading in every single item.

To evaluate which model fits better the data, we used four approximate model fit indices and two information criteria, which make different assumptions and measure fit in different ways (Kline, 2015). The Comparative Fit Index (CFI; Bentler, 1990) and the Tucker-Lewis Index (TLI; Tucker & Lewis, 1973) were used because they reflect the improvement in fit relative to a baseline model, while the Standardized Root Mean Square Residual (sRMR; Jöreskog, 1978) and Root Mean Square Error of Approximation (RMSEA; Steiger, 1990) measure the absolute fit of the data to the model. Finally, the Akaike Information Criterion (AIC; Akaike, 1992) and the Bayesian Information Criterion (BIC; Neath & Cavanaugh, 2012) were used because they allow comparison of non-nested models. AIC is similar to the chi-square statistic, but it adjusts for the number of model parameters, thereby including a “penalty” function for model complexity. Similar to the AIC, BIC is another recommended fit statistic due to the importance it places on parsimony. Models can be compared with respect to the AIC and BIC values, and the model presenting the lower values is associated with a better model fit (Kline, 2015). The following recommended cut-points were used: CFI and TLI (≥.90, good, and ≥.95, desirable), RMSEA (≤.05, good fit; ≤.08, acceptable fit; ≥.10, poor fit) and sRMR (≤.06, good fit; ≤.08, acceptable fit) (Hu & Bentler, 1999).

Figure 1 Competing OCI-R models 

Explained Common Variance and Percentage of Uncontaminated Correlations. The explained common variance (ECV) and percentage of uncontaminated correlations (PUC) are recommended indices that inform the consequences of forcing multidimensional data into a unidimensional structure when a particular set of data has a multidimensional structure that takes a bifactor form (Reise, Widaman et al., 2013).

The ECV statistic represents the percent of common variance attributable to the general factor (Reise, Widaman et al., 2013), and can be interpreted as the degree of “unidimensionality” when dealing with potential multidimensional data. High values of ECV (above .70) indicate that the general factor accounts for the majority of all common variance, whereas a low ECV means that item variance can be more accounted for by factors beyond the general factor (Reise, Widaman et al., 2013).

The PUC statistic indicates how much the factor strength will be biased due to forcing a bifactor structure into a unidimensional model (Reise, Widaman et al., 2013). With a bifactor structure, correlations among the items within group factors tend to be inflated due to both general factor and group factor variance, while correlations among items in different group factors only reflect variance from the general dimension and are thus uncontaminated by multidimensionality (Bonifay et al., 2015). As PUC increases, the average level of structural coefficient bias lessens, and a value above .80 is considered to represent negligible bias (Rodriguez et al., 2016).

Reliability. When we analyze multidimensionality and hierarchically structured constructs, the Cronbach’s α is misleading in how well a measure reflects a single construct (Cortina, 1993). As we apply bifactor structures, model-based reliability estimates should be computed that denote how precisely a certain scale score assesses the combination of general and specific constructs, and a certain target construct (Brunner et al., 2012).

Bifactor models offer the ability to use alternative statistics to better estimate reliability. Such statistics include the omega indices, which are “model-based” statistics based on confirmatory bifactor model results and are considered to be better able to yield more accurate estimates of reliability (Graham, 2006).

Omega. We computed Omega Total (which represents the reliability of the total score based on all sources of reliable variance across all the items) and Omega Subscale (which represents the reliability of a particular subscale based on all sources of reliable variance across the items from that subscale).

Omega Hierarchical. We also computed the omega hierarchical statistic (OmegaH; Zinbarg et al., 1997, 2005). a recommended statistic for evaluating the dimensionality of bifactor models, which can be applied to both the total score and subscale dimensions (Revelle & Zinbarg, 2009). The Omega hierarchical for the total score (OmegaH Total ) estimates the amount of total composite score variance explained by only the general dimension. This index reflects the degree to which the total score reflects a single latent construct. The Omega hierarchical for each subscale (OmegaH Subscale ) provides an estimate of subscale reliability, controlling for the general factor. As a consequence, Omega hierarchical statistics for the general factor are expected to be much higher than the Omega hierarchical statistics for each subscale.

Measurement Invariance analysis. We evaluated measurement invariance (MI) of the bifactor model across OCD and NC groups. First, we examined the fit of the single-group bifactor solutions in the OCD and NC samples separately. Next, we examined configural invariance across both groups, and if configural invariance was supported, then metric (weak) and scalar (strong) invariance were tested. Since our group sizes violated the assumption of equality (the NC group comprised around 70% of the sample), the assessment of both metric and scalar MI followed Chen’s (2007) recommendations. We used the ΔCFI test (difference between the CFI values of both models) because it has been recommended over the χ 2 difference test and the ΔRMSEA and ΔsRMR test, since it is not influenced by sample size or model complexity (Chen, 2007).

Results

Confirmatory Factor Analyses

Results of the goodness-of-fit indexes are shown in Table 2. The 1-factor model inadequately fit the data, considering the criteria proposed for the fit indices (Hooper et al., 2008; Hu & Bentler, 1999).

Table 2 Fit statistics for the confirmatory factor analytic models 

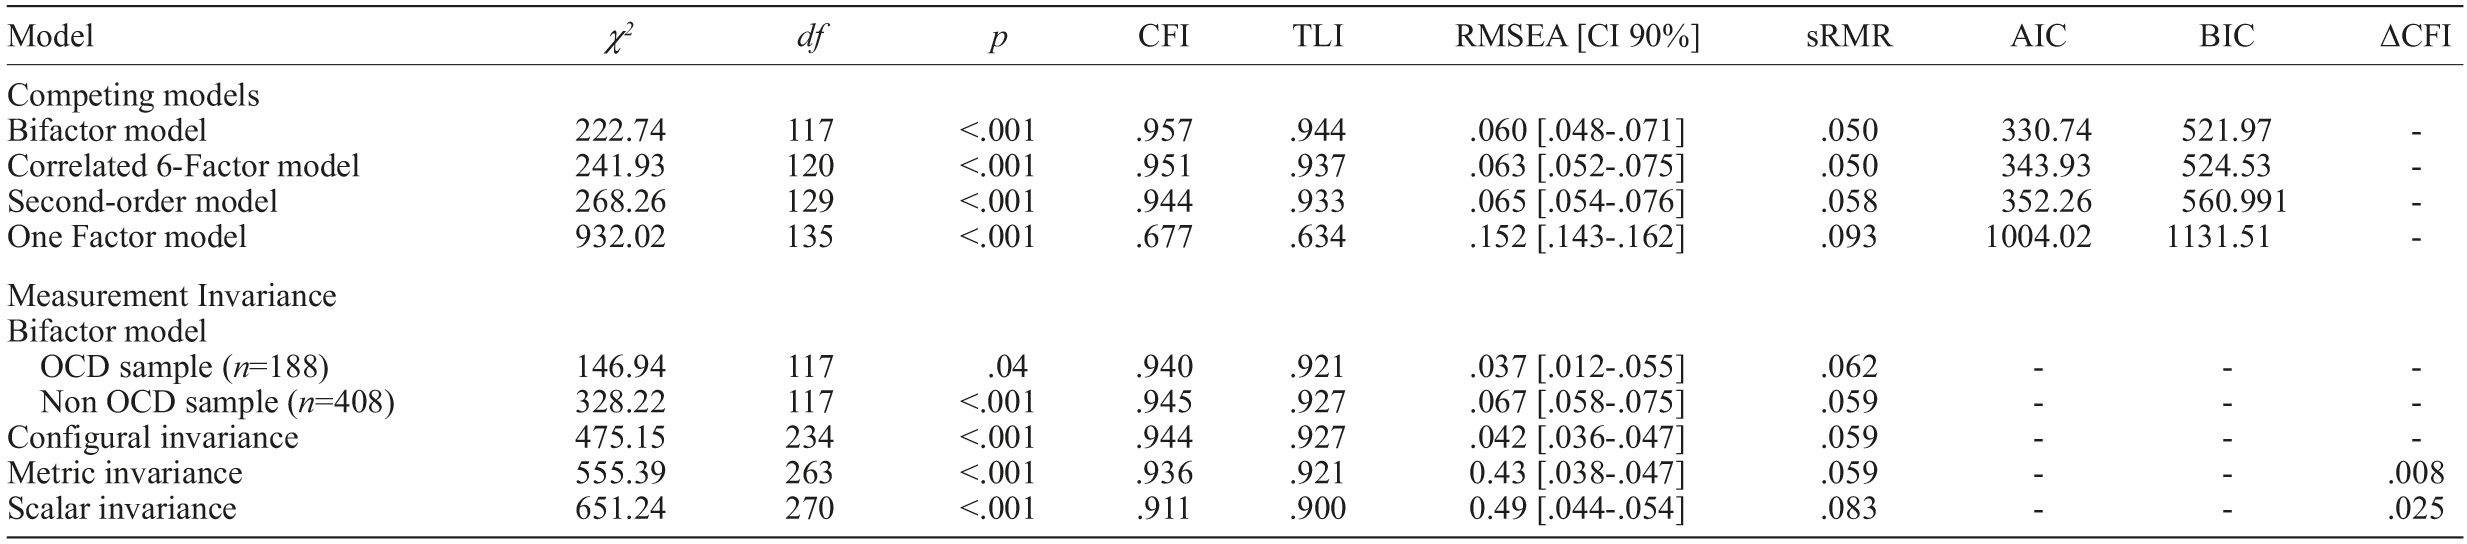
Note. χ 2 =Satorra-Bentler scaled chi-square; df=degrees of freedom; CFI=Comparative fit index; TLI=Tucker-Lewis index; RMSEA=root mean square error of approximation; sRMR=standardized root-mean-square residual; AIC=Akaike information Criterion; BIC=Bayesian information criterion; DCFI=change in CFI.

Evidence obtained in our study demonstrated that models with six factors showed a significant improvement of the fit indices, particularly the bifactor model, with six dimensions and a general factor, which presented the best fit of all models tested, with a value of Satorra-Bentler’s χ 2 =222.74, df=117, p<.001, χ 2 /df=1.903, CFI=.957, TLI=.944, RMSEA=.060, sRMR=.050, and regarding comparative values, AIC=330.74 and BIC=521.97, the lowest of the four models tested.

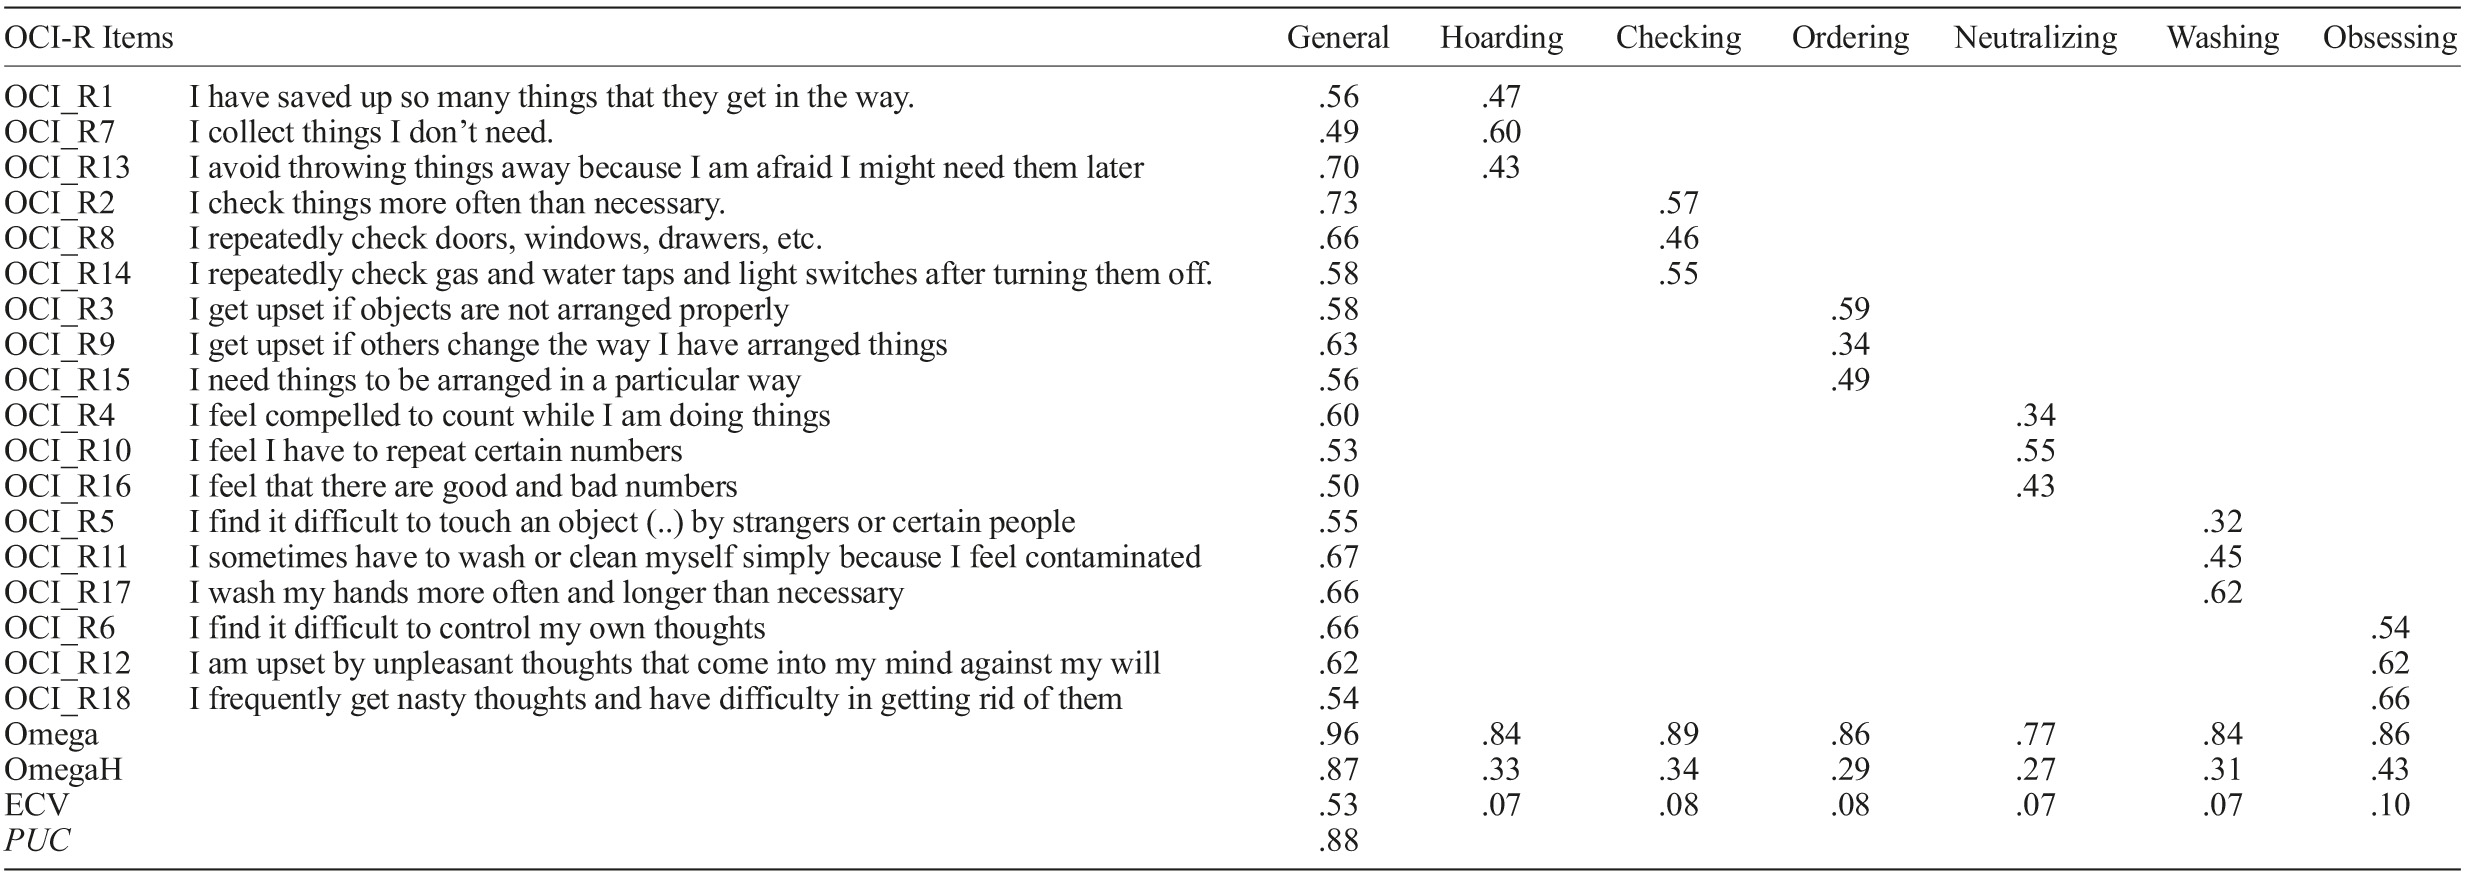
The bifactor model differentiates significantly from the model with the second best fit (χ 2 (3)=19.19, p<.001), using the chi-square change criterion (Hooper et al., 2008; Hu & Bentler, 1999). All items also loaded significantly on the general OC factor (with loadings ranging from .49 to .73) as well as on each of the six domains, ranging from .32 to .66 (see Table 3 for all factor loadings).

Table 3 Confirmatory factor analysis factor loadings of the Obsessive-Compulsive Inventory Revised (OCI-R) bifactor model and reliability statistics 

Note. OmegaH=Omega hierarchical; ECV=Explained Common Variance; PUC=Percentage of Uncontaminated Correlations. Factor loadings under .40 were omitted.

Explained Common Variance and Percentage of Uncontaminated Correlations

In our study, the ECV statistic associated with the confirmatory bifactor model presented a value of .53, indicating similar importance of both the general and particular factors. The value of the PUC statistic associated with the confirmatory bifactor model was .88, which suggests that fitting OCI-R items into a unidimensional structure (the bifactor model with a general factor) will not introduce a significant degree of bias on structural coefficients.

Reliability

In Table 3 are represented the reliability statistics for the total score and the six dimensions. The Omega General for the total score had a value of .96, indicating high reliability, while the Omega Subscale values for the six dimensions were .84 (Hoarding) .89 (Checking), .86 (Ordering), .77 (Neutralizing), .84 (Washing) and .86 (Obsessing).

The value of the OmegaH Total was high, .87, supporting the presence of a strong general OC dimension, while the values of the OmegaH Subscales , aried from .27 (Neutralizing) to .43 (Obsessing). These values were naturally lower since they represent the reliability of the subscales after accounting for the reliability due to the general factor.

Measurement Invariance Analysis

Two separate CFA’s were conducted, one for the OCD group [χ 2 (117)=146.94, p=.04; CFI=.940; TLI=.921; RMSEA=.037; sRMR=.062], and the other for the NC group [χ 2 (117)=328.22, p<.001; CFI=.945; TLI=.927; RMSEA=.067; sRMR=.059]. Since the results indicated an adequate fit for both samples, we then tested for MI. Configural invariance in OCD and NC groups was supported, with good fit values [χ 2 (234)=475.15, p<.01; CFI=.944; TLI=.927; RMSEA=.042; sRMR=.059]. Metric invariance was also supported, with adequate fit values (see Table 2) and a value of ΔCFI (0.008) below the recommended threshold of 0.01. We finally tested for scalar invariance, but although the fit indices were within the boundaries of acceptable fit (see Table 3), the change in CFI (0.046) was well above the recommended value of .01, so scalar invariance was not supported.

Discussion

Although the vast majority of studies in which the OCI-R was used consider a correlated six- factor structure (e.g., Abramowitz & Deacon, 2006; Faria & Cardoso, 2017; Olafsson et al., 2013; Solem et al., 2010), the present study examined the bifactor structure of the OCI-R, which was tested against three other models, a single factor model, a correlated six-factor model and a second order model with a general factor loading on the six domains.

Our results showed that the single factor model presented a very poor fit, with all the indices well below the acceptable values. On the other hand, although the correlated six factor model and the hierarchical second order model presented good fit values, the bifactor model was the one with the better fit, what supports the presence of a bifactor model for the OCI-R, with both the six dimensions and general factor loading on the items of the scale.

The present study also found that the general OC factor and the six specific OC symptom dimensions showed good reliability, estimated by the Omega indices since they generally provide better estimates than coefficient alpha (Dunn et al., 2014; Peters, 2014), and because they evaluate adequately the reliability of the specific OC symptom dimensions as well as the reliability attributed to the general OC factor.

The OmegaH Total for the general factor, corresponding to the amount of total score variance associated with variation on the general OC factor common to all the items was high (.80), thus suggesting the presence of a strong and reliable general factor, while the OmegaH Subscale for each of the six dimensions, corresponding to the degree to which the six specific OCI-R dimension scores provide reliable variance after accounting for the general OC factor were lower, as expected under the condition of a valid general factor. Also, the OmegaH Subscale values being similar, indicate that the six dimensions have the same importance.

With regard to dimensionality, the ECV value (.53) evidentiates a general factor responsible for about a half of the total variance, suggesting that some multidimensionality exists, while the value of PUC (.86) is above the threshold of .80 (Rodriguez et al., 2016), therefore no significant bias is introduced by considering a bifactor structure.

Regarding measurement invariance, our results showed that configural and metric invariance were supported across clinical and NC groups, while scalar invariance was not. This invariance of the bifactor model shows that this structure of a general factor and six dimensions is adequate for both clinical and non-clinical groups, suggesting that the symptom structure is similar in those with and without OCD, as noted earlier by Olatunji et al. (2017).

The use of the OCI-R allows for the differentiation of clinical and non-clinical individuals, by means of a cutoff score. In our view, this is a somewhat limited approach, since the conceptualization of the OC symptomatology as a continuum (Bouvard et al., 2017; Olatunji et al., 2008), does not allow for a clear distinction between the two realities. For instance, individuals with a total score of 19 or 20 are considered as non-clinic, while in fact they present more similarities with other individuals just above the cutoff limit (e.g., with 22 or 23) than with others, non-clinic, with a score of 10 or 12. It is necessary to introduce different levels of symptom severity in the OCD group, for instance mild, moderate and severe (see Abramovitch et al., 2010), and perform ROC analyses for each of these levels, in order to determine the optimal levels in terms of sensitivity and specificity. This study has several limitations. First, OCD group presents a wide variability in diagnosis times, from 4 months to 12 years, which turns our clinical group into a heterogeneous one, mostly in terms of symptom severity and treatment and medication time, and it is known that the OCI-R is sensitive to the effects of treatment in adults (Taylor et al., in press). Another limitation is the lack of control of comorbidities, since it is known that OCD is associated with several clinical conditions (Angelakis & Gooding, 2020; Brakoulias et al., 2017; Winkworth & Thomas, 2019). Also, because of the large span in diagnosis times, some patients were still diagnosed according to the DSM-IV criteria and others, with more recent diagnosis times, were done so according to the DSM-5 criteria, and it is possible that our OCD group included some individuals with hoarding symptomatology, diagnosed under the DSM-IV criteria. Also, diagnosis of compulsions or obsessions in DSM-5 require that they are time-consuming (more than one hour per day) and responsible for significant distress or impairment in functional areas, and these data were not available.

In conclusion, the bifactor model is adequate for the OCI-R, and in spite of the heterogeneity of OC symptoms, it exhibited good fit in both clinical and non-clinical samples. This model allows for the communalities due to a general OC factor along with the separate dimensions, in individuals with or without an OCD diagnosis. One of the advantages of the bifactorial models is the fact that the variation explained by specific factors or dimensions is independent of the general factor, what does not happen in the other models tested, and this allows a better understanding of how the specific dimensions correlate with external variables, in addition to the general factor. In addition, the bifactorial models also make possible the evaluation to what extent the variation in responses is due to a general construct or to the different dimensions.

We also think that the bifactor structure is compatible with other classifications of the OC symptoms, obtained through latent class analysis, namely those of autogenous vs. reactive obsessions (Lee et al., 2005), or the more recent proposed classification of autogenous obsessive, reactive obsessive-compulsive and reactive compulsive (Atli et al., 2014), because these classes are not mutually exclusive, therefore allowing for the presence of a common factor.

References

Abramowitz, J. S., & Deacon, B. J. (2006). Psychometric properties and construct validity of the Obsessive-Compulsive Inventory - Revised: Replication and extension with a clinical sample. Journal of Anxiety Disorders, 20(8), 1016-1035. https://doi.org/10.1016/j.janxdis.2006.03.001 [ Links ]

Abramowitz, J. S., Deacon, B. J., Olatunji, B. O., Wheaton, M. G., Berman, N. C., Losardo, D., Timpano, K. R., McGrath, P. B., Riemann, B. C., Adams, T., Björgvinsson, T., Storch, E. A., & Hale, L. R. (2010). Assessment of obsessive-compulsive symptom dimensions: Development and evaluation of the Dimensional Obsessive-Compulsive Scale. Psychological Assessment, 22(1), 180-198. https://doi.org/10.1037/a0018260 [ Links ]

Akaike, H. (1992). Information theory and an extension of the maximum likelihood principle. In S. Kotz & N. L. Johnson (Eds.), Breakthroughs in statistics. Springer Series in Statistics (vol. I, pp. 610-624). Springer. https://doi.org/10.1007/978-1-4612-0919-5_38 [ Links ]

American Psychiatric Association [APA]. (2013). DSM-5 Diagnostic classification: Diagnostic and statistical manual of mental disorders. https://doi.org/10.1176/appi.books.9780890425596.x00diagnosticclassification [ Links ]

Angelakis, I., & Gooding, P. (2020). Obsessive-Compulsive Disorder and suicidal experiences: The role of experiential avoidance. Suicide and Life-Threatening Behavior, 50(2), 359-371. https://doi.org/10.1111/sltb.12593 [ Links ]

Angelakis, I., Panagioti, M., & Austin, J. L. (2017). Factor structure and validation of the Obsessive Compulsive Inventory - Revised (OCI-R) in a Greek non-clinical sample. Journal of Psychopathology and Behavioral Assessment, 39(1), 164-175. https://doi.org/10.1007/s10862-016-9575-5 [ Links ]

Anholt, G. (2010). The Yale-Brown Obsessive-Compulsive scale: Factor structure of a large sample. Frontiers in Psychiatry, 1. https://doi.org/10.3389/fpsyt.2010.00018 [ Links ]

Atli, A., Boysan, M., Çetinkaya, N., Bulut, M., & Bez, Y. (2014). Latent class analysis of Obsessive-Compulsive symptoms in a clinical sample. Comprehensive Psychiatry, 55(3), 604-612. https://doi.org/10.1016/j.comppsych.2013.08.029 [ Links ]

Belloch, A., Roncero, M., García-Soriano, G., Carrió, C., Cabedo, E., & Fernández-Álvarez, H. (2013). The Spanish version of the Obsessive-Compulsive Inventory - Revised (OCI-R): Reliability, validity, diagnostic accuracy, and sensitivity to treatment effects in clinical samples. Journal of Obsessive-Compulsive and Related Disorders, 2(3), 249-256. https://doi.org/10.1016/j.jocrd.2013.05.001 [ Links ]

Bentler, P. M. (1990). Comparative fit indexes in structural models. Psychological Bulletin, 107(2), 238-246. https://doi.org/10.1037/0033-2909.107.2.238 [ Links ]

Bentler, P. M. (2006). Structural equations program manual. Multivariate Software, Inc. [ Links ]

Bonifay, W. E., Reise, S. P., Scheines, R., & Meijer, R. R. (2015). When are multidimensional data unidimensional enough for structural equation modeling? An evaluation of the DETECT multidimensionality index. Structural Equation Modeling: A Multidisciplinary Journal, 22(4), 504-516. https://doi.org/10.1080/10705511.2014.938596 [ Links ]

Bouvard, M., Fournet, N., Denis, A., Sixdenier, A., & Clark, D. (2017). Intrusive thoughts in patients with obsessive compulsive disorder and non-clinical participants: A comparison using the International Intrusive Thought Interview Schedule. Cognitive Behaviour Therapy, 46(4), 287-299. https://doi.org/10.1080/16506073.2016.1262894 [ Links ]

Brakoulias, V., Starcevic, V., Belloch, A., Brown, C., Ferrao, Y. A., Fontenelle, L. F., Lochner, C., Marazziti, D., Matsunaga, H., Miguel, E. C., Reddy, Y. C. J., do Rosario, M. C., Shavitt, R. G., Shyam Sundar, A., Stein, D. J., Torres, A. R., & Viswasam, K. (2017). Comorbidity, age of onset and suicidality in Obsessive-Compulsive Disorder (OCD): An international collaboration. Comprehensive Psychiatry , 76, 79-86. https://doi.org/10.1016/j.comppsych.2017.04.002 [ Links ]

Brunner, M., Nagy, G., & Wilhelm, O. (2012). A tutorial on hierarchically structured constructs. Journal of Personality. https://doi.org/10.1111/j.1467-6494.2011.00749.x [ Links ]

Burns, G. L., Keortge, S. G., Formea, G. M., & Sternberger, L. G. (1996). Revision of the Padua Inventory of Obsessive-Compulsive Disorder symptoms: Distinctions between worry, obsessions, and compulsions. Behaviour Research and Therapy, 34(2), 163-173. https://doi.org/10.1016/0005-7967(95)00035-6 [ Links ]

Chen, F. F. (2007). Sensitivity of goodness of fit indexes to lack of measurement invariance. Structural Equation Modeling: A Multidisciplinary Journal , 14(3), 464-504. https://doi.org/10.1080/10705510701301834 [ Links ]

Chen, F. F., West, S., & Sousa, K. (2006). A comparison of bifactor and second-order models of quality of life. Multivariate Behavioral Research, 41(2), 189-225. https://doi.org/10.1207/s15327906mbr4102_5 [ Links ]

Cludius, B., Landmann, S., Rose, N., Heidenreich, T., Hottenrott, B., Schröder, J., Jelinek, L., Voderholzer, U., Külz, A. K., & Moritz, S. (2020). Long-term effects of mindfulness-based cognitive therapy in patients with Obsessive-Compulsive Disorder and residual symptoms after cognitive behavioral therapy: Twelve-month follow-up of a randomized controlled trial. Psychiatry Research, 291. https://doi.org/10.1016/j.psychres.2020.113119 [ Links ]

Cortina, J. M. (1993). What is coefficient alpha? An examination of theory and applications. Journal of Applied Psychology. https://doi.org/10.1037/0021-9010.78.1.98 [ Links ]

Deacon, B. J., & Abramowitz, J. S. (2005). The Yale-Brown Obsessive Compulsive Scale: Factor analysis, construct validity, and suggestions for refinement. Journal of Anxiety Disorders , 19(5), 573-585. https://doi.org/10.1016/j.janxdis.2004.04.009 [ Links ]

Dunn, T. J., Baguley, T., & Brunsden, V. (2014). From alpha to omega: A practical solution to the pervasive problem of internal consistency estimation. British Journal of Psychology, 105(3), 399-412. https://doi.org/10.1111/bjop.12046 [ Links ]

Ebesutani, C., McLeish, A. C., Luberto, C. M., Young, J., & Maack, D. J. (2014). A bifactor model of anxiety sensitivity: Analysis of the Anxiety Sensitivity Index-3. Journal of Psychopathology and Behavioral Assessment , 36(3), 452-464. https://doi.org/10.1007/s10862-013-9400-3 [ Links ]

Faria, M. N., & Cardoso, I. (2017). Propriedades psicométricas da versão portuguesa do Obsessive-Compulsive Inventory - Revised. Análise Psicológica, 35(1), 91-100. https://doi.org/10.14417/ap.1167 [ Links ]

Foa, E. B., Huppert, J. D., Leiberg, S., Langner, R., Kichic, R., Hajcak, G., & Salkovskis, P. M. (2002). The Obsessive-Compulsive Inventory: Development and validation of a short version. Psychological Assessment , 14(4), 485-496. https://doi.org/10.1037/1040-3590.14.4.485 [ Links ]

Foa, E. B., Kozak, M. J., Salkovskis, P. M., Coles, M. E., & Amir, N. (1998). The validation of a new Obsessive-Compulsive Disorder Scale: The Obsessive-Compulsive Inventory. Psychological Assessment , 10(3), 206-214. https://doi.org/10.1037/1040-3590.10.3.206 [ Links ]

Fullana, M. A., Tortella-Feliu, M., Caseras, X., Andión, Ó., Torrubia, R., & Mataix-Cols, D. (2005). Psychometric properties of the Spanish version of the Obsessive-Compulsive Inventory - Revised in a non-clinical sample. Journal of Anxiety Disorders , 19(8), 893-903. https://doi.org/10.1016/j.janxdis.2004.10.004 [ Links ]

Ghassemzadeh, H., Raisi, F., Firoozikhojastefar, R., Meysamie, A., Karamghadiri, N., Nasehi, A. A., Fallah, J., Sorayani, M., & Ebrahimkhani, N. (2017). A study on sexual function in Obsessive-Compulsive Disorder (OCD) patients with and without depressive symptoms. Perspectives in Psychiatric Care, 53(3), 208-213. https://doi.org/10.1111/ppc.12160 [ Links ]

Gibbons, R. D., Bock, R. D., Hedeker, D., Weiss, D. J., Segawa, E., Bhaumik, D. K., Kupfer, D. J., Frank, E., Grochocinski, V. J., & Stover, A. (2007). Full-information item bifactor analysis of graded response data. Applied Psychological Measurement, 31(1), 4-19. https://doi.org/10.1177/0146621606289485 [ Links ]

Gönner, S., Leonhart, R., & Ecker, W. (2008). The Obsessive-Compulsive Inventory - Revised (OCI-R): Validation of the German version in a sample of patients with OCD, anxiety disorders, and depressive disorders. Journal of Anxiety Disorders , 22(4), 734-749. https://doi.org/10.1016/j.janxdis.2007.07.007 [ Links ]

Goodman, W. K., Price, L. H., Rasmussen, S. A., Mazure, C., Fleischmann, R., Hill, C., Heninger, G., & Charney, D. (1989). The Yale-Brown Obsessive Compulsive Scale: I. Developoment, use and reliability. Archives of General Psychiatry, 46(11), 1006-1011. https://doi.org/10.1001/archpsyc.1989.01810110048007 [ Links ]

Graham, J. M. (2006). Congeneric and (essentially) tau-equivalent estimates of score reliability. Educational and Psychological Measurement, 66(6), 930-944. https://doi.org/10.1177/0013164406288165 [ Links ]

Hajcak, G., Huppert, J. D., Simons, R. F., & Foa, E. B. (2004). Psychometric properties of the OCI-R in a college sample. Behaviour Research and Therapy , 42(1), 115-123. https://doi.org/10.1016/j.brat.2003.08.002 [ Links ]

Hirose, M., Hirano, Y., Nemoto, K., Sutoh, C., Asano, K., Miyata, H., Matsumoto, J., Nakazato, M., Matsumoto, K., Masuda, Y., Iyo, M., Shimizu, E., & Nakagawa, A. (2017). Relationship between symptom dimensions and brain morphology in Obsessive-Compulsive Disorder. Brain Imaging and Behavior, 11(5), 1326-1333. https://doi.org/10.1007/s11682-016-9611-9 [ Links ]

Hon, S. K., Siu, B. W., Cheng, C., Wong, W. C., & Foa, E. B. (2019). Validation of the Chinese version of Obsessive-Compulsive Inventory - Revised. East Asian Archives of Psychiatry, 29(4), 103-111. https://doi.org/10.12809/eaap1832 [ Links ]

Hooper, D., Coughlan, J., & Mullen, M. (2008). Structural equation modeling: Guidelines for determining model fit. The Electronic Journal of Business Research Methods, 6(1), 53-60. [ Links ]

Hu, L., & Bentler, P. M. (1999). Cutoff criteria for fit indexes in covariance structure analysis: Conventional criteria versus new alternatives. Structural Equation Modeling: A Multidisciplinary Journal , 6(1), 1-55. https://doi.org/10.1080/10705519909540118 [ Links ]

Jöreskog, K. G. (1978). Structural analysis of covariance and correlation matrices. Psychometrika, 43(4), 443-477. https://doi.org/10.1007/BF02293808 [ Links ]

Khosravani, V., Samimi Ardestani, M., Sharifi Bastan, F., & Kamali, Z. (2017). The relationship between alexithymia and symptom dimensions in patients with Obsessive-Compulsive Disorder. Journal of Obsessive-Compulsive and Related Disorders , 14, 127-133. https://doi.org/10.1016/j.jocrd.2017.04.001 [ Links ]

Kilicaslan, E. E., Türe, H. S., Kasal, M. İ., Çavuş, N. N., Akyüz, D. A., Akhan, G., & Besiroglu, L. (2020). Differences in Obsessive-Compulsive symptom dimensions between patients with Epilepsy with Obsessive-Compulsive symptoms and patients with OCD. Epilepsy and Behavior, 102. https://doi.org/10.1016/j.yebeh.2019.106640 [ Links ]

Kim, S. J., Lee, S.-A., Ryu, H. U., Han, S.-H., Lee, G.-h., Jo, K.-D., & Kim, J. B. (2020). Factors associated with Obsessive-Compulsive symptoms in people with epilepsy. Epilepsy and Behavior , 102, 106723. https://doi.org/10.1016/j.yebeh.2019.106723 [ Links ]

Kline, R. B. (2015). Principles and practice of structural equation modeling (4th ed.). Guilford Press. [ Links ]

Koike, H., Tsuchiyagaito, A., Hirano, Y., Oshima, F., Asano, K., Sugiura, Y., Kobori, O., Ishikawa, R., Nishinaka, H., Shimizu, E., & Nakagawa, A. (2020). Reliability and validity of the Japanese version of the Obsessive-Compulsive Inventory - Revised (OCI-R). Current Psychology, 39(1), 89-95. https://doi.org/10.1007/s12144-017-9741-2 [ Links ]

Külz, A. K., Landmann, S., Cludius, B., Rose, N., Heidenreich, T., Jelinek, L., Alsleben, H., Wahl, K., Philipsen, A., Voderholzer, U., Maier, J. G., & Moritz, S. (2019). Mindfulness-Based Cognitive Therapy (MBCT) in patients with Obsessive-Compulsive Disorder (OCD) and residual symptoms after Cognitive Behavioral Therapy (CBT): A randomized controlled trial. European Archives of Psychiatry and Clinical Neuroscience, 269(2), 223-233. https://doi.org/10.1007/s00406-018-0957-4 [ Links ]

Lee, H. J., Kwon, S. M., Kwon, J. S., & Telch, M. J. (2005). Testing the autogenous-reactive model of obsessions. Depression and Anxiety, 21(3), 118-129. https://doi.org/10.1002/da.20063 [ Links ]

Malpica, M. J., Ruiz, V. M., Godoy, A., & Gavino, A. (2009). Inventario de Obsesiones y Compulsiones - Revisado (OCI-R): Aplicabilidad a la población general. Anales de Psicología, 25(2), 217-226. https://www.redalyc.org/pdf/167/16712958004Links ]

Mansolf, M., & Reise, S. P. (2017). When and why the second-order and bifactor models are distinguishable. Intelligence, 61, 120-129. https://doi.org/10.1016/j.intell.2017.01.012 [ Links ]

Mataix-Cols, D., do Rosario-Campos, M. C., & Leckman, J. F. (2005). A multidimensional model of Obsessive-Compulsive Disorder. American Journal of Psychiatry, 162(2), 228-238. https://doi.org/10.1176/appi.ajp.162.2.228 [ Links ]

McKay, D., Abramowitz, J. S., Calamari, J. E., Kyrios, M., Radomsky, A., Sookman, D., Taylor, S., & Wilhelm, S. (2004). A critical evaluation of Obsessive-Compulsive Disorder subtypes: Symptoms versus mechanisms. Clinical Psychology Review, 24(3), 283-313. https://doi.org/10.1016/j.cpr.2004.04.003 [ Links ]

Neath, A. A., & Cavanaugh, J. E. (2012). The Bayesian information criterion: Background, derivation, and applications. Wiley Interdisciplinary Reviews: Computational Statistics, 4(2), 199-203. https://doi.org/10.1002/wics.199 [ Links ]

Ólafsson, R. P., Arngrímsson, J. B., Árnason, P., Kolbeinsson, Þ., Emmelkamp, P. M. G., Kristjánsson, Á., & Ólason, D. Þ. (2013). The Icelandic version of the Dimensional Obsessive-Compulsive Scale (DOCS) and its relationship with obsessive beliefs. Journal of Obsessive-Compulsive and Related Disorders , 2(2), 149-156. https://doi.org/10.1016/j.jocrd.2013.02.001 [ Links ]

Olatunji, B. O., Ebesutani, C., & Abramowitz, J. S. (2017). Examination of a bifactor model of Obsessive-Compulsive symptom dimensions. Assessment, 24(1), 45-59. https://doi.org/10.1177/1073191115601207 [ Links ]

Olatunji, B. O., Ebesutani, C., & Tolin, D. F. (2019). A bifactor model of obsessive beliefs: Specificity in the prediction of Obsessive-Compulsive Disorder symptoms. Psychological Assessment, 31(2), 210-225. https://doi.org/10.1037/pas0000660 [ Links ]

Olatunji, B. O., Williams, B. J., Haslam, N., Abramowitz, J. S., & Tolin, D. F. (2008). The latent structure of Obsessive-Compulsive symptoms: A taxometric study. Depression and Anxiety , 25(11), 956-968. https://doi.org/10.1002/da.20387 [ Links ]

Overduin, M. K., & Furnham, A. (2012). Assessing Obsessive-Compulsive Disorder (OCD): A review of self-report measures. Journal of Obsessive-Compulsive and Related Disorders , 1(4), 312-324. https://doi.org/10.1016/j.jocrd.2012.08.001 [ Links ]

Peters, G.-J. Y. (2014). The alpha and the omega of scale reliability and validity. The European Health Psychologist, 16(2), 56-69. [ Links ]

Raisi, F., Ghassemzadeh, H., Meysami, A., Firoozikhojastefar, R., Karamghadiri, N., Sorayani, M., Nasehi, A. A., Fallah, J., & Ebrahimkhani, N. (2015). Sexual dysfunction in Obsessive-Compulsive Disorder. Tehran University Medical Journal, 73(2), 101-109. http://search.ebscohost.com/login.aspx?direct=true&db=a9h&AN=102605682&site=eds-liveLinks ]

Reise, S. P. (2012). The rediscovery of bifactor measurement models. Multivariate Behavioral Research , 47(5), 667-696. https://doi.org/10.1080/00273171.2012.715555 [ Links ]

Reise, S. P., Bonifay, W. E., & Haviland, M. G. (2013). Scoring and modeling psychological measures in the presence of multidimensionality. Journal of Personality Assessment, 95(2), 129-140. https://doi.org/10.1080/00223891.2012.725437 [ Links ]

Reise, S. P., Morizot, J., & Hays, R. D. (2007). The role of the bifactor model in resolving dimensionality issues in health outcomes measures. Quality of Life Research, 16(S1), 19-31. https://doi.org/10.1007/s11136-007-9183-7 [ Links ]

Reise, S. P., Widaman, K. F., Haviland, M. G., Scheines, R., Widaman, K. F., & Haviland, M. G. (2013). Multidimensionality and structural coefficient bias in structural equation modeling. Educational and Psychological Measurement , 73(1), 5-26. https://doi.org/10.1177/0013164412449831 [ Links ]

Revelle, W., & Zinbarg, R. E. (2009). Coefficients Alpha, Beta, Omega, and the glb: Comments on Sijtsma. Psychometrika , 74(1), 145-154. https://doi.org/10.1007/s11336-008-9102-z [ Links ]

Roberts, M., & Wilson, M. (2008). Factor structure and response bias of the Obsessive-Compulsive Inventory - Revised (OCI-R) in a female undergraduate sample from New Zealand. New Zealand Journal of Psychology, 37, 2-7. [ Links ]

Rodriguez, A., Reise, S. P., & Haviland, M. G. (2016). Evaluating bifactor models: Calculating and interpreting statistical indices. Psychological Methods, 21(2), 137-150. https://doi.org/10.1037/met0000045 [ Links ]

Rosa, J., Baptista, A., Santos, A., & Craveirinha, J. (2005). Inventário Obsessivo-Compulsivo - Revisto. In C. Machado, L. S. Almeida, M. Gonçalves, & V. Ramalho (Coords.), Actas da XIII Conferência Internacional - Avaliação Psicológica: Formas e Contextos. Psiquilibrios Edições. [ Links ]

Sanavio, E. (1988). Obsessions and compulsions: The Padua inventory. Behaviour Research and Therapy , 26(2), 169-177. https://doi.org/10.1016/0005-7967(88)90116-7 [ Links ]

Schirmbeck, F., Konijn, M., Hoetjes, V., Zink, M., de Haan, L., & For Genetic Risk and Outcome of Psychosis (GROUP). (2019). Obsessive-compulsive symptoms in psychotic disorders: Longitudinal associations of symptom clusters on between- and within-subject levels. European Archives of Psychiatry and Clinical Neuroscience , 269(2), 245-255. https://doi.org/10.1007/s00406-018-0884-4 [ Links ]

Sica, C., Ghisi, M., Altoè, G., Chiri, L. R., Franceschini, S., Coradeschi, D., & Melli, G. (2009). The Italian version of the Obsessive Compulsive Inventory: Its psychometric properties on community and clinical samples. Journal of Anxiety Disorders , 23(2), 204-211. https://doi.org/10.1016/j.janxdis.2008.07.001 [ Links ]

Solem, S., HJemdal, O., Vogel, P. A., & Stiles, T. C. (2010). A Norwegian version of the Obsessive-Compulsive Inventory - Revised: Psychometric properties. Scandinavian Journal of Psychology, 51(6), 509-516. https://doi.org/10.1111/j.1467-9450.2009.00798.x [ Links ]

Souza, F. P., Foa, E. B., Meyer, E., Niederauer, K. G., & Cordioli, A. V. (2011). Psychometric properties of the Brazilian Portuguese version of the Obsessive-Compulsive Inventory - Revised (OCI-R). Revista Brasileira de Psiquiatria, 33(2), 137-142. https://doi.org/10.1590/S1516-44462011000200008 [ Links ]

Steiger, J. H. (1990). Structural model evaluation and modification: An interval estimation approach. Multivariate Behavioral Research , 25(2), 173-180. https://doi.org/10.1207/s15327906mbr2502_4 [ Links ]

Storch, E. A., Benito, K., & Goodman, W. (2011). Assessment scales for Obsessive-Compulsive Disorder. Neuropsychiatry, 1(3), 243-250. https://doi.org/10.2217/npy.11.22 [ Links ]

Taylor, S., Abramowitz, J. S., McKay, D., & Garner, L. (in press). Obsessive compulsive and related disorders. In M. M. Anthony & D. H. Barlow (Eds.), Handbook of assessment and treatment planning for psychological disorders (3rd ed.). Guilford Press. [ Links ]

Taylor, S., Coles, M. E., Abramowitz, J. S., Wu, K. D., Olatunji, B. O., Timpano, K. R., McKay, D., Kim, S. K., Carmin, C., & Tolin, D. F. (2010). How are dysfunctional beliefs related to Obsessive-Compulsive symptoms?. Journal of Cognitive Psychotherapy, 24(3), 165-176. https://doi.org/10.1891/0889-8391.24.3.165 [ Links ]

Thordarson, D. S., Radomsky, A. S., Rachman, S., Shafran, R., Sawchuk, C. N., & Ralph Hakstian, A. (2004). The Vancouver Obsessional Compulsive Inventory (VOCI). Behaviour Research and Therapy , 42(11), 1289-1314. https://doi.org/10.1016/j.brat.2003.08.007 [ Links ]

Tucker, L. R., & Lewis, C. (1973). A reliability coefficient for maximum likelihood factor analysis. Psychometrika , 38(1), 1-10. https://doi.org/10.1007/BF02291170 [ Links ]

Van Oppen, P., Hoekstra, R. J., & Emmelkamp, P. M. G. (1995). The structure of Obsessive-Compulsive symptoms. Behaviour Research and Therapy , 33(1), 15-23. https://doi.org/10.1016/0005-7967(94)E0010-G [ Links ]

van Passel, B., Danner, U., Dingemans, A., van Furth, E., Sternheim, L., van Elburg, A., van Minnen, A., van den Hout, M., Hendriks, G.-J., & Cath, D. (2016). Cognitive Remediation Therapy (CRT) as a treatment enhancer of eating disorders and Obsessive Compulsive Disorders: Study protocol for a randomized controlled trial. BMC Psychiatry, 16, 1-14. https://doi.org/10.1186/s12888-016-1109-x [ Links ]

Wagner, G., Köhler, S., Peikert, G., de la Cruz, F., Reess, T. J., Rus, O. G., Schultz, C. C., Koch, K., & Bär, K.-J. (2019). Checking and washing rituals are reflected in altered cortical thickness in Obsessive-Compulsive Disorder. Cortex, 117, 147-156. https://doi.org/10.1016/j.cortex.2019.03.012 [ Links ]

Wang, Y.-m., Zhang, Yi.-j., Cai, X.-l., Yang, H.-x., Shan, H.-d., Cheung, E. F. C., & Chan, R. C. K. (2020). Altered grey matter volume and white matter integrity in individuals with high Schizo-Obsessive traits, high Schizotypal traits and Obsessive-Compulsive symptoms. Asian Journal of Psychiatry, 52(November 2019), 102096. https://doi.org/10.1016/j.ajp.2020.102096 [ Links ]

Watson, D., & Wu, K. D. (2005). Development and validation of the Schedule of Compulsions, Obsessions, and Pathological Impulses (SCOPI). Assessment , 12(1), 50-65. https://doi.org/10.1177/1073191104271483 [ Links ]

Williams, M., Davis, D. M., Thibodeau, M. A., & Bach, N. (2013). Psychometric properties of the Obsessive-Compulsive Inventory Revised in African Americans with and without Obsessive-Compulsive Disorder. Journal of Obsessive-Compulsive and Related Disorders , 2(4), 399-405. https://doi.org/10.1016/j.jocrd.2013.07.003 [ Links ]

Winkworth, O., & Thomas, S. J. (2019). Comparing neuropsychological performance in adults with Obsessive-Compulsive Disorder, attention-deficit hyperactivity disorder and healthy controls: An online study. Journal of Obsessive-Compulsive and Related Disorders , 23(July). https://doi.org/10.1016/j.jocrd.2019.100477 [ Links ]

Wootton, B. M., Diefenbach, G. J., Bragdon, L. B., Steketee, G., Frost, R. O., & Tolin, D. F. (2015). A contemporary psychometric evaluation of the Obsessive Compulsive Inventory - Revised (OCI-R). Psychological Assessment. https://doi.org/10.1037/pas0000075 [ Links ]

Yagi, M., Hirano, Y., Nakazato, M., Nemoto, K., Ishikawa, K., Sutoh, C., Miyata, H., Matsumoto, J., Matsumoto, K., Masuda, Y., Obata, T., Iyo, M., Shimizu, E., & Nakagawa, A. (2017). Relationship between symptom dimensions and white matter alterations in Obsessive-Compulsive Disorder. Acta Neuropsychiatrica, 29(3), 153-163. https://doi.org/10.1017/neu.2016.45 [ Links ]

Zermatten, A., Van der Linden, M., Jermann, F., & Ceschi, G. (2006). Validation of a French version of the Obsessive-Compulsive Inventory - Revised in a non-clinical sample. European Review of Applied Psychology, 56(3), 151-155. https://doi.org/10.1016/j.erap.2005.07.003 [ Links ]

Zinbarg, R. E., Barlow, D. H., & Brown, T. A. (1997). Hierarchical structure and general factor saturation of the Anxiety Sensitivity Index: Evidence and implications. Psychological Assessment, 9(3), 277-284. https://doi.org/10.1037/1040-3590.9.3.277 [ Links ]

Zinbarg, R. E., Revelle, W., Yovel, I., & Li, W. (2005). Cronbach’s α, Revelle’s β, and Mcdonald’s ωH: Their relations with each other and two alternative conceptualizations of reliability. Psychometrika , 70(1), 123-133. https://doi.org/10.1007/s11336-003-0974-7 [ Links ]

This research did not receive any specific grant from funding agencies in the public, commercial, or not-for-profit sectors.

Received: April 15, 2021; Accepted: April 27, 2022

Correspondence concerning this article should be addressed to: Miguel Faria, NICiTeS - Núcleo de Investigação em Ciências e Tecnologias da Saúde, IPLUSO - Instituto Politécnico da Lusofonia, Rua do Telhal aos Olivais, 8-8A, 1950-396 Lisboa, Portugal. E-mail: miguel.faria@ipluso.pt

The authors declared no potential conflicts of interest with respect to the research, authorship, and/or publication of this article.

All authors read and approved the final manuscript.

Creative Commons License This is an open-access article distributed under the terms of the Creative Commons Attribution License