


 (pdf)
(pdf)


 SciELO
  SciELO
 Permalink
Introduction
There is a common belief that working together as a team inspires team members to work harder than when they work individually. However, some scientists found that many hands did not make light work because people tended to slack off in teamwork settings (Ingham et al., 1974; Karau & Williams, 1993; Latané et al., 1979; Ringelmann, 1913). The tendency of exerting less effort of some team members may have a domino effect on the whole team. When witnessing slacker co-workers, others may change their motivation to perform a task (Jackson & Harkins, 1985; Jassawalla et al., 2009; Kerr, 1983; Liden et al., 2004; Mulvey & Klein, 1998; Schippers, 2014; Tata, 2002; Williams & Karau, 1991). These responses may affect follow-up reactions of the slackers. Team performance may change due to these effects. This study derived from the research of Jassawalla et al., in 2008 and 2009, which checked the impact of the perceived social loafing on the poor team performance, the response of other team members to perceived social loafing and the social loafer action after team response. Nonetheless, the causal relationships among these factors were not examined in their works.
The aim of this study is to examine the direct effect of perceived social loafing on team performance as well as the indirect relationship between these two variables via the sucker effect/social compensation and social loafer’s continuous social loafing within Vietnamese student teams. The expected results may help us to obtain knowledge of how social loafing impacts individual members as well as the whole student learning teams. These findings have practical implications for student learning teams to deal with perceived social loafing effectively and enhance team performance.
Social loafing and perceived social loafing
In 1913, a French agricultural engineer called Maximilien Ringelmann identified that people decreased their effort when pulling on a rope as a group in comparison with when pulling the rope independently. However, this discovery did not receive sufficient attention until 1974 when the experiment was recreated by Ingham et al. In 1979, Latané et al., coined the term “social loafing” for the effort reduction of team members because of the presence of others and social loafing was considered as a social disease that had a negative impact on individuals, as well as institutions.
As definition of group reported by Shaw (1971), there were interactions among group members and they thereby influenced one another. When working together in a group, the psychological phenomenon of one member can be perceived by others. If a participant decreases effort when working in a group, this fact can be realized by others. In other words, if one member engages in social loafing, other members can perceive it. However, perceived social loafing and actual social loafing do not always covary, so it is necessary to distinguish perceived social loafing from actual social loafing. Actual social loafing implies the fact that one or more team members exert less effort when working collectively in comparison with when working individually (Karau & Williams, 1993), no matter whether others perceive this fact or not (Comer, 1995; Karau & Williams, 1993; Kidwell & Bennett, 1993). Meanwhile, perceived social loafing refers to the belief of team members that there are one or more social loafers in their team, regardless of the reality (Comer, 1995; Mulvey & Klein, 1998). The current research considered student perception of social loafing in their learning teams as awareness of some social loafing behaviors of their teammates.
Team performance
As explained by Weldon and Weingart (1993), team performance is the quantity or quality of the results generated by the group, or the length of time which the whole group need to accomplish the task. Team performance refers to the productivity and efficiency of the whole team as all the team members cooperate in all aspects of their common tasks. When some students learn as a team, the team performance includes the ability to meet the deadline, the number of good ideas, the quality of the team’s final presentation.
Relationship between perceived social loafing and team performance
In terms of organizational behavior, in spite of not reflecting actual conditions, perceptions of partners are the basis for the attitudes and behaviors of team members (Zhu, 2013). According to Tata (2002), the performance of not only each team member but also the whole team may decline once they believe that their teammates are engaging in social loafing. The reduction of teamwork outcome as a consequence of perceived teammate social loafing was found in numerous works including both laboratory experiments and field studies. Tata (2002) noted that it was necessary to evaluate perceptions of social loafing owing to its negative influence on team performance. In accord with Tata, Frash et al. (2004), confirmed that it was essential to examine teammates’ perceptions of social loafing when studying the consequences of social loafing on their motivation even though their perceptions were accurate or not. The investigations in natural teamwork settings by George (1992) and Mulvey and Klein (1998) documented the negative association between perceived teammate social loafing and collective performance. Following the findings of early works, the results of the experiment by Fang and Chang (2014) validated that perceived social loafing and team performance were negatively related. In the history of social loafing research, the direct effect of perceived social loafing on team performance has been widely investigated. However, questions have been raised about how perceived social loafing impact team performance. This study examined not only the direct effect of perceived teammate social loafing on team performance but also the mechanism of the effect.
Social compensation and the sucker effect as responses of teammates to social loafing
It is possible that teammates will react in different manners when they realize social loafing in their team. Some researchers indicated that those who perceived others were loafing may contribute less so as not to be taken advantage of by the social loafers (Jackson & Harkins, 1985; Kerr, 1983; Mulvey & Klein, 1998). Exerting less effort in order not to be exploited by others team members was termed “the sucker effect” by Kerr (1983). Once individuals believe that their co-workers are underperforming, they are likely to reduce their own contribution to protect themselves from inequity in teamwork contexts. Reviewing previous research on perceived social loafing and decline in effort as a response to social loafing, Tata (2002) concluded that perceived social loafing can negatively impact team performance, it implies that the sucker effect played an important part in the relationship between perceived social loafing and team performance. Nonetheless, Tata did not investigate the association among these variables in his study.
In 1991, Williams and Karau discovered social compensation, which contrasted with the sucker effect, referring to the tendency of team members to work harder to make up for the inadequate contributions of social loafers. Social compensation was also shown in a study on 168 employees by Liden et al. (2004). In line with the previous research, Jassawalla et al. (2009) realised that students took compensatory actions such as doing more and picking up the slack once members of their teams produced insufficient contribution and did poor quality work. When conducting a study in 2014, Schippers indicated that if there was a high degree of conscientiousness and agreeableness within the team executing difficult task, team members would compensate for the social loafers.
While most of research examine the sucker effect and social compensation separately, a handful of studies considered both of these phenomena as consequences of social loafing (Jassawalla et al., 2008; Schipper, 2014; Singer, 2019). Especially, both the sucker effect and social compensation were investigated in the study conducted by Singer (2019) in order to comprehend how students would respond to social loafing and how team performance would be impacted by these two ways of response. The results showed that the teammates responded to perceived social loafing by working harder and making up for the lost effort of the social loafers, not by decreasing their effort. Nonetheless, the association between social compensation and team performance was not examined in the study. Additionally, Singer (2019) suggested that future research should investigate the mediating role of social compensation in the relationship between perceived social loafing and team performance.
Social loafer’s continuous social loafing as a response of the social loafer to their teammates’ reactions
On the issue of consequences of social loafing, while previous studies had investigated only the responses of social loafers’ teammates, the research by Jassawalla et al. (2008) and the research by Singer (2019) captured the reactions of social loafers in response to the actions taken by the teammates. Nonetheless, both of the studies did not examine the relationship of the social loafers’ reactions with other variables such as the responses of social loafers’ teammates or team performance. It would be possible that social loafer’s continuous social loafing as a response of the social loafer to teammate reactions is not only a proximal outcome of the sucker effect or social compensation but also a direct precursor of low team performance. Therefore, along with teammate reactions to perceived social loafing, we propose that social loafer’s continuous social loafing may be another mediator contributing to the mechanism of the influence of perceived social loafing on team performance.
The relationship between perceived social loafing, responses of teammates to social loafing (the sucker effect/social compensation), social loafer’s continuous social loafing and team performance
In a wide variety of research on social loafing, the sucker effect was regarded as one cause of effort reduction of team members that would lead to a decline in the total output of the whole team. In teams with perceived co-worker loafing, peolpe reduced their effort to avoid playing the sucker role, the team performance might accordingly be worse (Mulvey & Klein, 1998; Tata, 2002).
Unlike the sucker effect, the majority of research to date has tended to focus on social compensation as a consequence of perceived social loafing rather than its impact on other factors such as teammate responses and team performance apart from Schippers’ study in 2014 which discovered that the negative impact of social loafing on team performance would be prevented by social compensation.
So far, in the literature on social loafing field, there has been no discussion about the association among perceived social loafing, team members’ reactions to perceived social loafing, the response of social loafers to their peers’ reactions and team performance. Taking the close connections of these psychological phenomena into consideration, the present study assumes that responses of teammates to social loafing (the sucker effect/social compensation) and social loafers’ continuous social loafing can serve as serial mediators between perceived social loafing and team performance. The empirical findings in this study will make several noteworthy contributions to the current literature.
Hypotheses
Hypothesis 1: Perceived social loafing directly affects team performance.
Hypothesis 2: Perceived social loafing has an indirect effect on team performance through social compensation and social loafer’s continuous social loafing.
Hypothesis 3: Perceived social loafing has an indirect effect on team performance through the sucker effect and social loafer’s continuous social loafing.
Methods
Participants
The research was conducted in the second semester of the 2020-2021 academic year. Participants of the study consists of 351 students who were studying at a university in Vietnam and had experienced social loafing in their learning teams.
Instruments
There are five scales utilized in this study (see Table 1):
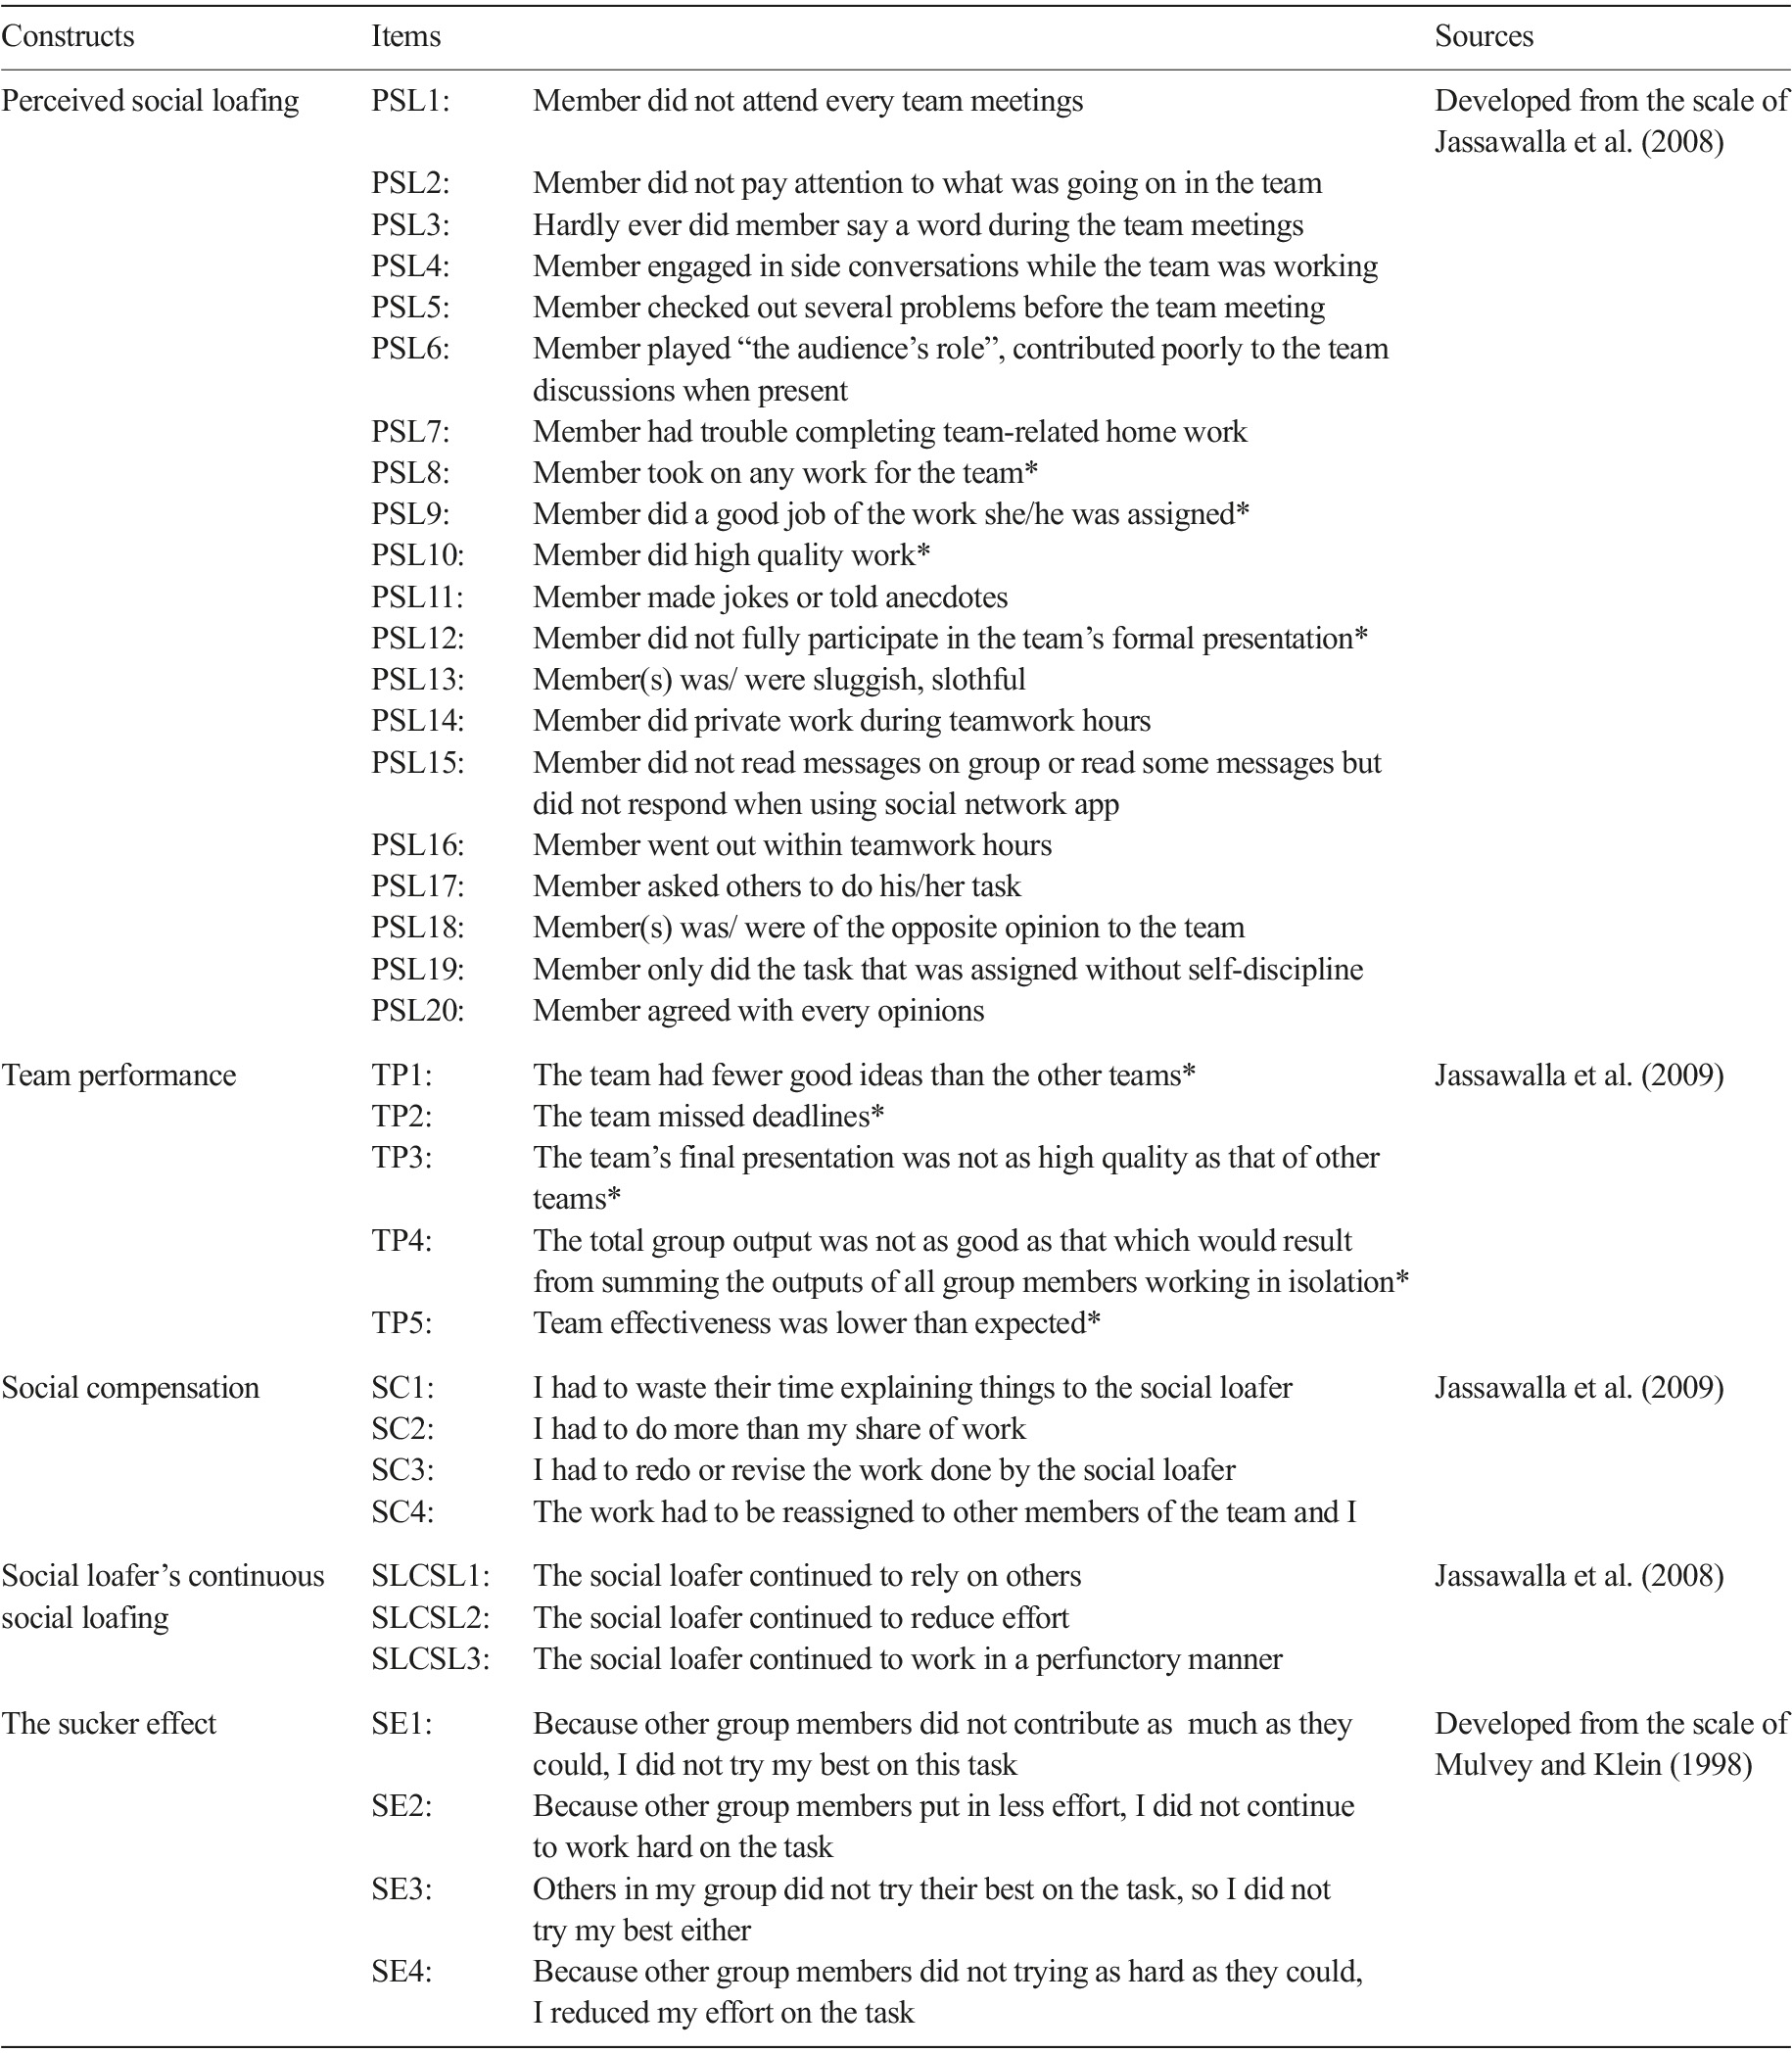
Perceived Social Loafing Scale (20 items): A scale was developed from 12 items in the questionnaire of Jassawalla et al. (2008) and 08 added items based on the data collected from the participants’ answers for opened-ended questions. Students’ perceptions of social loafing were examined by this scale.
Social Compensation Scale (4 items): A scale was taken from Jassawalla et al. (2009) in order to assess the compensatory reaction of the social loafers’ teammates. In each item, the subject “team members/other team members” was replaced by “I” to refer to the respondent’s own compensatory reaction to social loafing.
The Sucker Effect Scale (4 items): A scale of 4 items was adapted from Mulvey and Klein (1998) to examine the effort reduction of the surveys once they recognize a teammate’s social loafing behavior.
Social Loafer’s Continuous Social Loafing Scale (3 items): A checklist of three items was adapted from Jassawalla et al. (2008) to capture the effort changes of the social loafer in response to the compensatory actions taken by their teammate.
Team Performance Scale (5 items): A scale was developed from 03 items in the scale of Jassawalla et al. (2009) and 02 added items based on the data collected from the participants’ answers for opened-ended questions. This scale examined the performance of the teams with social loafers.
The respondents were required to respond on 5 score points ranging from (1) absolutely false to (5) absolutely true. In order to calculate the total score, four items in the perceived social loafing scale and five items in the team performance scale were scored in reverse. The total score of each scale was computed with higher score corresponding to higher amount of perceived social loafing, social compensation, social loafer’s continuous social loafing and team performance.
Initially, the scales were translated into Vietnamese. Following that, the Vietnamese versions were retranslated into English. Finally, based on a comparison of the second English versions with the originals, some modifications for the Vietnamese versions were done to provide the best comprehensibility among the respondents.
Procedure
Phase 1: A survey was conducted on 198 seniors to explore their perception of social loafer’s behaviors in their learning teams. The students were asked to answer some open-ended questions about their latest learning team with at least one perceived social loafer:
What did the social loafer(s) in your learning team do?
What did you do in response to the social loafing?
What was the response from the social loafer?
The impact of the social loafing on the team performance?
A content analysis (n=198) was conducted to analyse the student’s responses to each open-ended question then categorise the student’s responses into topics. Lastly, the social loafing behaviors from the students’ perspectives were compared to which in the perceived social loafing questionnaire of Jassawalla et al. (2008); the responses of the students were compared to which in the sucker effect scale of Mulvey and Klein (1998) and the compensation scale of Jassawalla et al. (2009); the responses from the social loafer were compared to which in the questionnaire of Jassawalla et al. (2008); the impact of the social loafing on the team performance was compare to the team performance scale of Jassawalla et al. (2009). Which item in each scale was identical to the students’ answers would be kept and any other special Vietnamese student behaviors with more than 10 times of answers would be added in the scales.
Phase 2: Two pilot studies using Exploratory Factor Analysis on 79 students and Confirmatory Factor Analysis on 80 students confirm was conducted in order to assess the validity and reliability of the scales.
Phase 3: The main survey was conducted with 351 other students including sophomores, juniors and seniors. The freshmen were not investigated because they had not experienced learning in teams at this university.
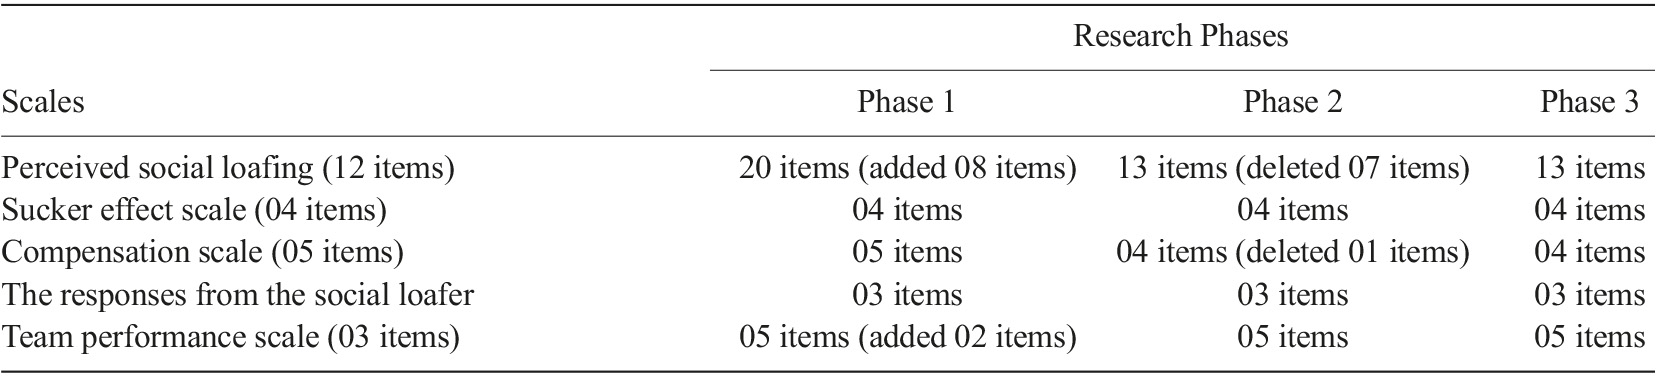
Table 2 presented the development of the scales through the phases of the research.
Data analysis
This study used a measuring instrument reliability test internal consistency with Cronbach alpha technique and by using IBM-SPSS software version 21.0 for Windows. Cronbach alpha technique criteria research instrument with reliability coefficients ≥0.6 are acceptable and an item-total correlation cut-off limit as low as 0.3 was used according to Nunnally and Bernstein (1994). Therefore, 05 items in the perceived social loafing scale (PSL1, PSL4, PSL5, PSL11, PSL18); 01 item in the social compensation scale (SC1), 02 items in team performance scale (TP1, TP2) that did not meet this cut-off criterion threshold were eliminated. After item reduction, the scales’ Cronbach alphas had a certain degree of increase and were used in the main survey. For the main survey with 351 students, Cronbach’s alpha reliability of each scale was more than 0.7, which indicated acceptable internal consistency.
According to Worthington and Whittaker (2006), Exploratory factor analysis (EFA) and Confirmatory factor analysis (CFA) were used to examine the internal reliability of the scales that were developed in this study.
Exploratory Factor Analysis was conducted on 15 items of the perceived social loafing scale. The sample is suitable for EFA as the KMO is 0.805>0.5 (p=0.000<0.001). However, 02 items (PSL7, PSL 15) out of 15 items were eliminated because their communalities were less than 0.5 (Hair et al., 2009). In the second run of the EFA, with the two poorly loading items from the first run dropped, the KMO value was 0.789 (p<0.001), with no item KMO under 0.553 and the communities of each item met the cut-off criterion threshold (>0.5). Varimax rotation with Kaiser Normalization resulted in three factors with extracted variance is 61.988%>50%. Following this final EFA run, the internal consistencies of the subscales were again checked, and this time each subscale had acceptable internal consistency (factor 1: Cronbach’s Alpha=0.839; factor 2: Cronbach’s Alpha=0.774; factor 3: Cronbach’s Alpha=0.734), and all item-test correlations were above 0.5. Table 3 showed the final scale compositions and item factor loadings. The first factor has 6 items, the second factor includes 4 items, the last factor has 3 items, named “slacking off, dependent”; “passive, unwilling to comment”; “do not contribute actively” respectively based on the content of the items comprising each factor, in combination with existing theory.
CFA using AMOS 21 was applied on the second half of the sample (80 students) to test the validity of the structure obtained after EFA. Table 3 showed the item loadings of the CFA. All item loadings were above 0.5 and significant at the p<0.05 level. According to Hu and Bentler (1999), the fit statistics suggested the three-factor model was an acceptable fit to the data [χ 2 (80)=940.18, p<.001; RMSEA=0.08; CFI=0.91; TFI=0.89].
Table 3 Exploratory factor analysis and confirmatory factor analysis results: Scale compositions with item factor loadings
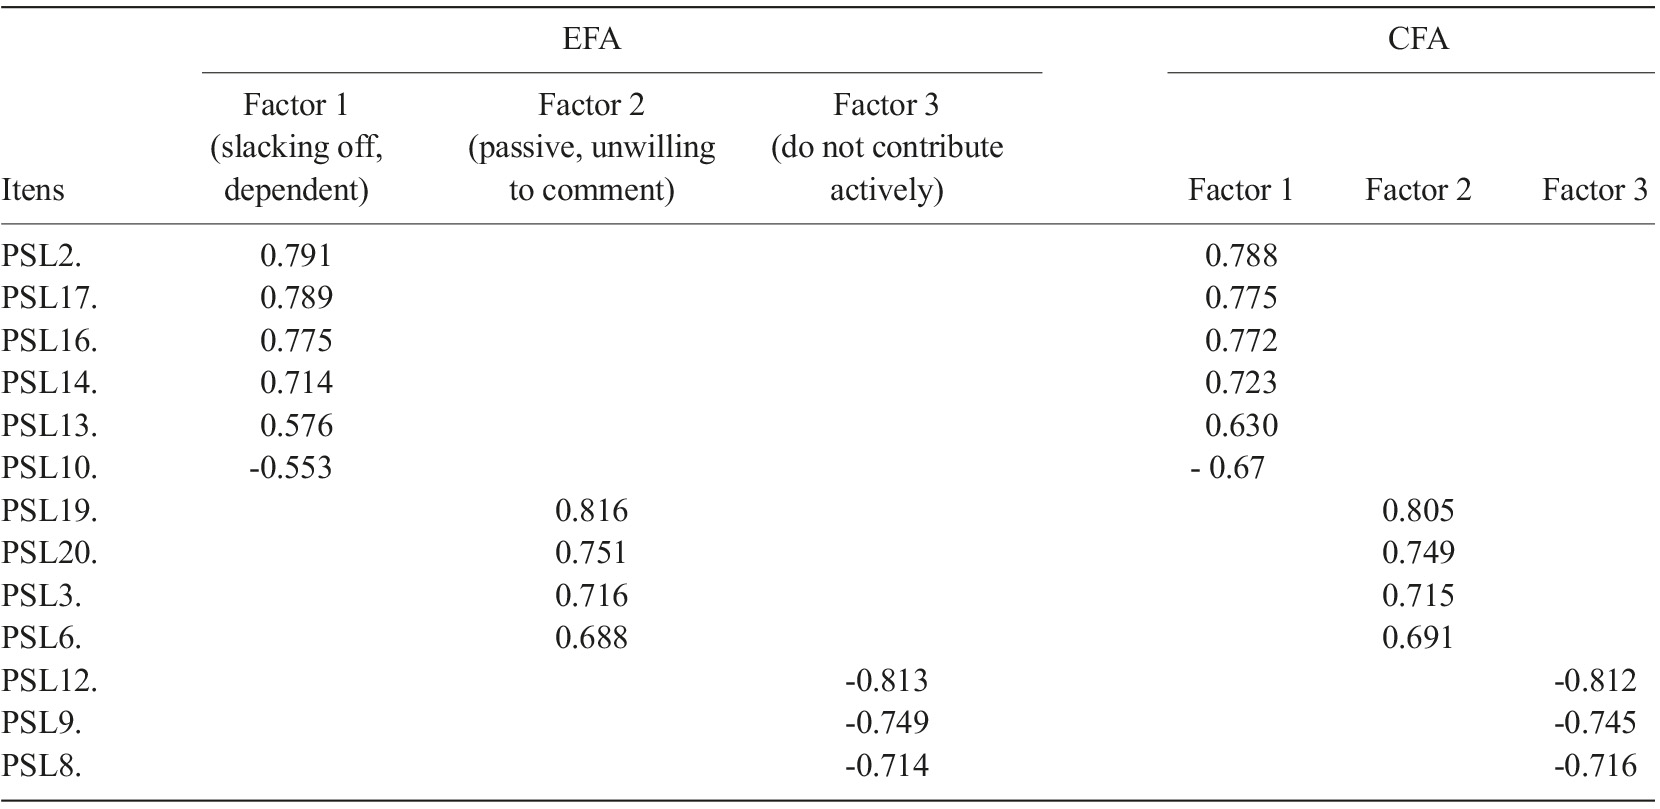
The results of EFA and CFA presented in Table 3 confirmed the three-component structure of perceived social loafing among Vietnamese student learning team.
EFA and CFA were also utilized to check the validity of the social loafer’s continuous social loafing scale and the team performance scale. The results confirmed the construct validity of the items of the scales.
Pearson’s correlation was applied to calculate correlations among variables to check the necessary condition under which statistical mediation analysis would be conducted.
In this study, the sequential mediation model was tested using the SPSS macro Process (Model 6) (Hayes, 2013). A total of 5000 boostrapping sample were generated and 95% of bias correlated confidence intervals (CI) were observed. As recommended by Jim Frost, the confidence interval used to compare means presents a range of values that likely contains the difference between the means for the entire population, a value of zero represents no difference between the means, the difference is statistically significant because the range excludes no difference. In mediation analysis, significant indirect effect is assumed when the confidence intervals does not intersect through zero.
Results
Initial analyses
Table 4 lists the reliability, mean values and standard deviations of the variables. Apart from the sucker effect that had no correlation with any other variables, there was a significant correlation between perceived social loafing, social compensation, social loafer’s continuous social loafing, and team performance.
Table 4 Pearson’s correlations, reliability, means and standard deviations of key study variables
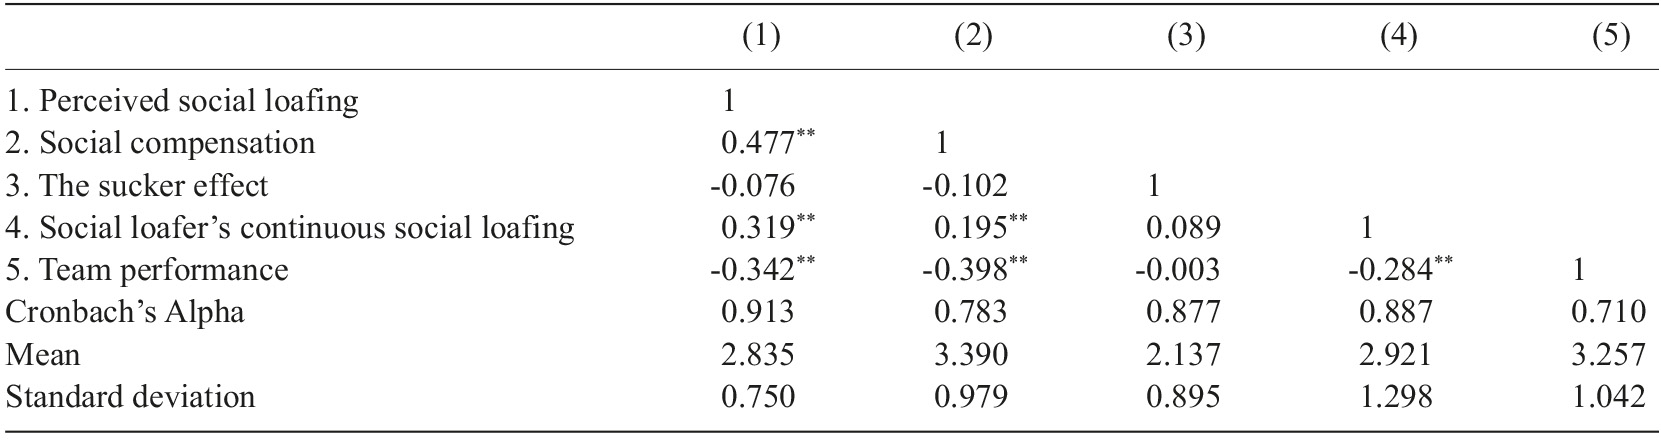
Note. Level of significance: **p<0.01.
The two proposed mediators including social compensation and social loafer’s continuous social loafing had significant correlations with both predictor and outcome variables wherein the sucker effect did not meet Baron and Kenny’s criterion (1986) to become a mediator. The analysis found that the sucker effect was not related to perceived social loafing as well as social loafer’s continuous social loafing or team performance. Therefore, social compensation and social loafer’s continuous social loafing were submitted for mediational analysis but the sucker effect could not be included in the mediation model.
For correlation analyses among variables in the serial mediation model, the study result revealed positive relationships between perceived social loafing and social compensation as well as social loafer’s continuous social loafing with r=0.477 (p<0.01) and r=0.3219 (p<0.01), respectively. A positive relationship was also found between social compensation and social loafer’s continuous social loafing with r=0.195 (p<0.01). In the opposite direction, team performance was negatively correlated with perceived social loafing (r=-0.342, p<0.01), with social compensation (r=-0.398, p<0.01) and with social loafer’s continuous social loafing (r=-0.284, p<0.01).
Test of the model
When using the bootstrapping method, it became evident that all five direct effects and three indirect effects were statistically significant since the bootstrap CI did not include zero and each of the p values was less than 0.05.
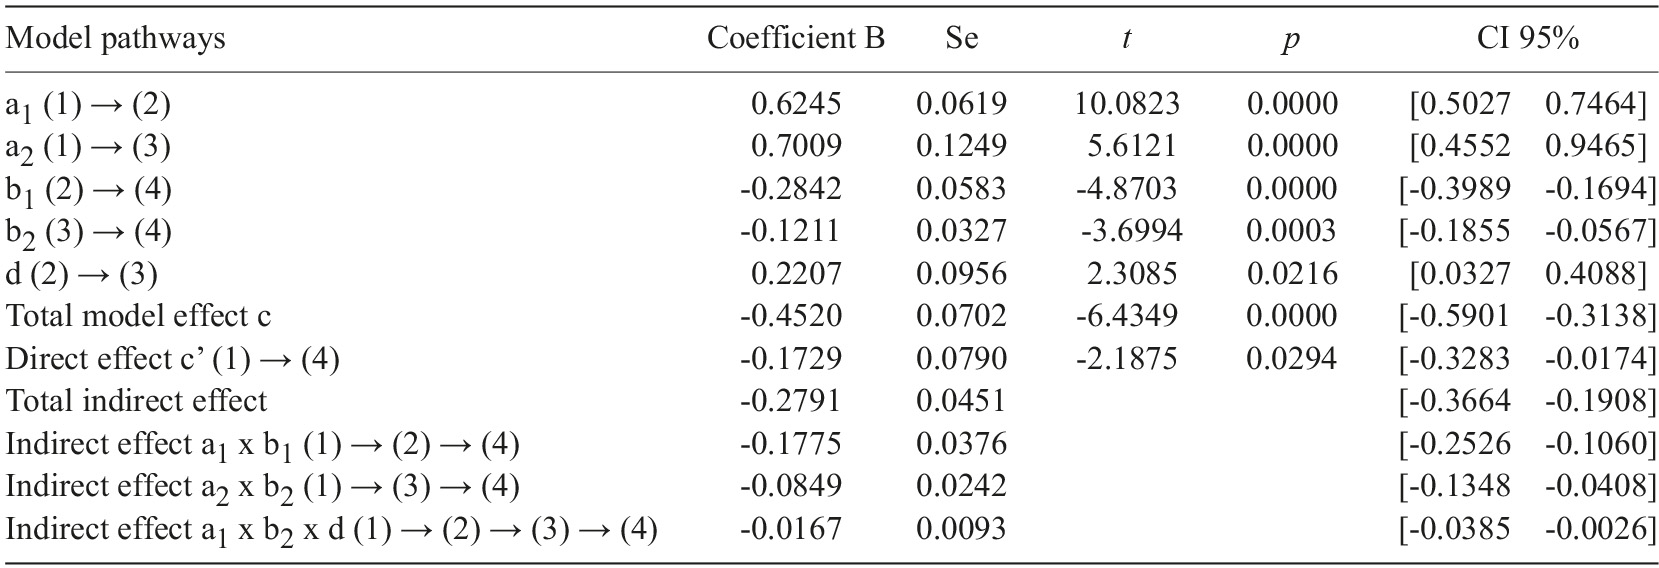
First of all, the result of the serial mediation analysis in Table 5 indicated that, the direct effect c’ of perceived social loafing on team performance was significantly negative (B=-0.1729; se=0.0790; t=-2.1875; p=0.0294; 95% CI=[-0.3283, -0.0174] did not include 0). That is to say, the Hypothesis 1 of the direct effect of perceived teammate social loafing on team performance was supported.
Table 5 Serial mediation analysis
Note. N=345; Arrow (→) refers to the effect; (1): Perceived social loafing; (2): Social compensation of social loafers’ teammates; (3): Social loafer’s continuous social loafing; (4): Team performance.
Table 5 also showed that perceived teammate social loafing was significantly and positively associated with social compensation (B=0.6245; se=0.0619, t=10.0823; p=0.0000, 95% CI=[0.5027 0.7464]). Social compensation of social loafers’ teammates had a significantly positive impact on social loafer’s continuous social loafing (B=0.2207; se=0.0956; t=2.3085; 95% CI=[0.0327 0.4088]; p=0.0216). Social loafer’s continuous social loafing had a significant negative link with team performance (B=-0.1211; se=0.0327; t=-3.6994; p=0.0003; 95% CI=[-0.1855 -0.0567]). Further-more, a significantly negative association was found between social compensation and team performance (B=-0.2842; se=0.0583; t=-4.8703; p=0.0000; 95% CI=[-0.3989 -0.1694]) as well as between perceived social loafing and social loafer’s continuous social loafing (B=0.7009; se=0.1249; t=5.6121; p=0.0000; 95% CI=[0.4552 0.9465]).
In concern to the indirect influence of perceived social loafing on team performance, from the values given in Table 5, evidence of the mediating effect of social compensation and social loafer’s continuous social loafing on the relationship between perceived social loafing and team performance was found. The total model effect c of perceived social loafing on team performance was significantly negative (B=-0.4520; se=0.0702; t=-6.4349; 95% CI=[-0.5901, -0.3138]; p=0.0000). Meanwhile, total indirect effect and indirect effect of social compensation and social loafer’s continuous social loafing were also significantly negative (total indirect effect=-0.2791, 95% CI=[-0.3664 -0.1908]; indirect effect a1 x b1=-0.1775; 95% CI=[-0.2526 -0.1060]; indirect effect a2 x b2=-0.0849; 95% CI=[-0.1348 -0.0408]). The indirect effect a1 x b1 and the indirect effect a2 x b2 revealed that social compensation of social loafers’ teammates as well as social loafer’s continuous social loafing played the role as a separate mediator in the relationship between perceived social loafing and team performance because the bootstrap CI did not include zero.
When testing the sequential mediating role of the two mediators, the direct effect d indicated that social compensation of social loafers’ teammates had a significantly positive impact on social loafer’s continuous social loafing. Moreover, the indirect effect a1 x b2 x d of these two variables on the relationship between perceived social loafing and team performance confirmed that they were serial mediators of the possitive association between perceived social loafing and team performance (B=-0.0167; se=0.0093; % CI=[-0.0385, -0.0026]).
As perceived social loafing had significant direct effect on team performance, social compensation and social loafer’s continuous social loafing served as partial mediators between these two variables. Once this mediational effect occured, the coefficient of the total effect c was different from the coefficient of the direct effect c’ (B=-0.4520 as compared to B=-0.1729).
The results from Hayes’s test for the serial mediating model in this study was summarized in Figure 1. The research results supported the Hypothesis 2 that social compensation of social loafers’ teammates and social loafer’s continuous social loafing played serial moderating roles on the association between perceived social loafing and team performance in the tendency of decreasing the degree of team performance.
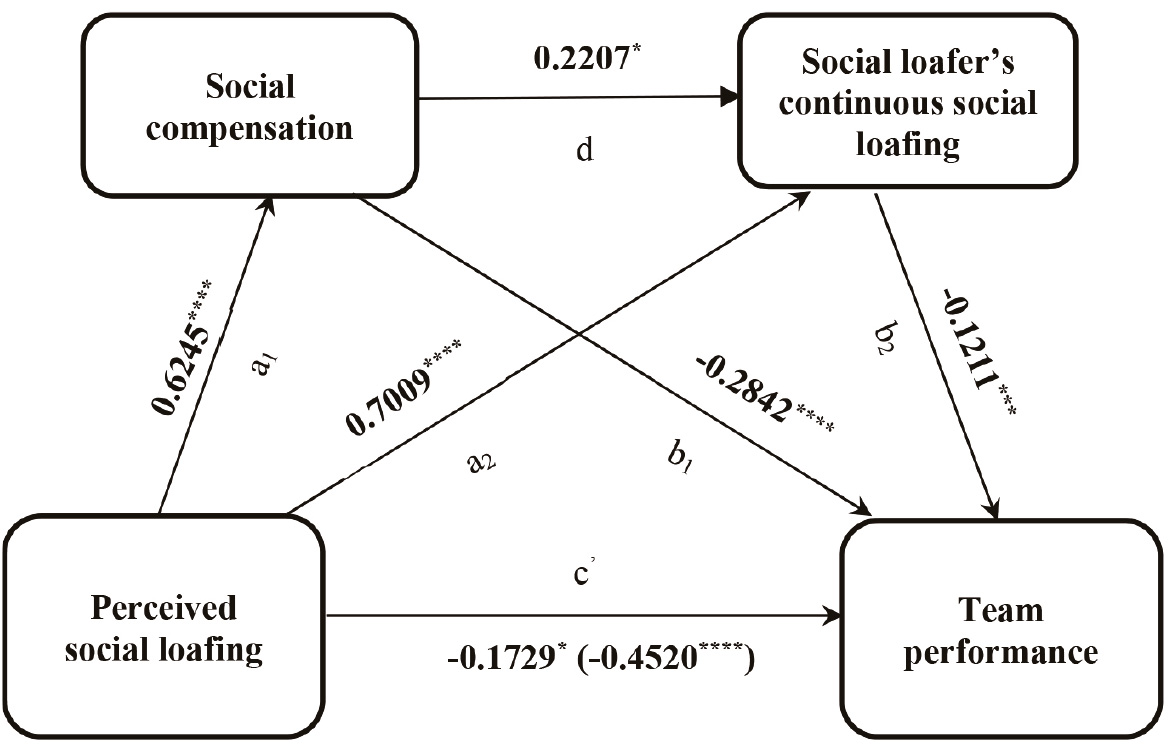
Note. Total effect of TSC was shown in parenthesis; ***p<0.001, ****p<0.0001
Figure 1. Serial mediation model showing the effect of perceived social loafing on team performance through social compensation and social loafer’s continuous social loafing
In reference to the magnitude of the mediating effect of social compensation and social loafer’s continuous social loafing on the association between perceived social loafing and team performance, the increase of 0.2791 (0.4520 - 0.1729) in the standardized coefficient represented the mediation effect.
The proportion of the indirect effects on the total effect was 0.6175.
(a1 x b1) + (a2 x b2) + (a1 x b2 x d) (0.2791)
(Proportion mediated = ------------------------ = ---- = 0.6175).
c 0.4520
The ratio of the indirect effects to the direct effect was 1.6142.
(a1 x b1) + (a2 x b2)+ (a1 x b2 x d) (0.2791)
(Ratio mediated = ------------------------ = ---- = 1.6142).
(c’) 0.1729
The coefficient of the indirect effect a1 x b1 was higher than that of a2 x b2 as well as than that of a1 x b2 x d (B=-0.1775 as compared to B=-0.0849 or B=-0.0167). These suggested that the size of moderating effect of social compensation was greater than that of social loafer’s continuous social loafing and than that of the two serial mediators.
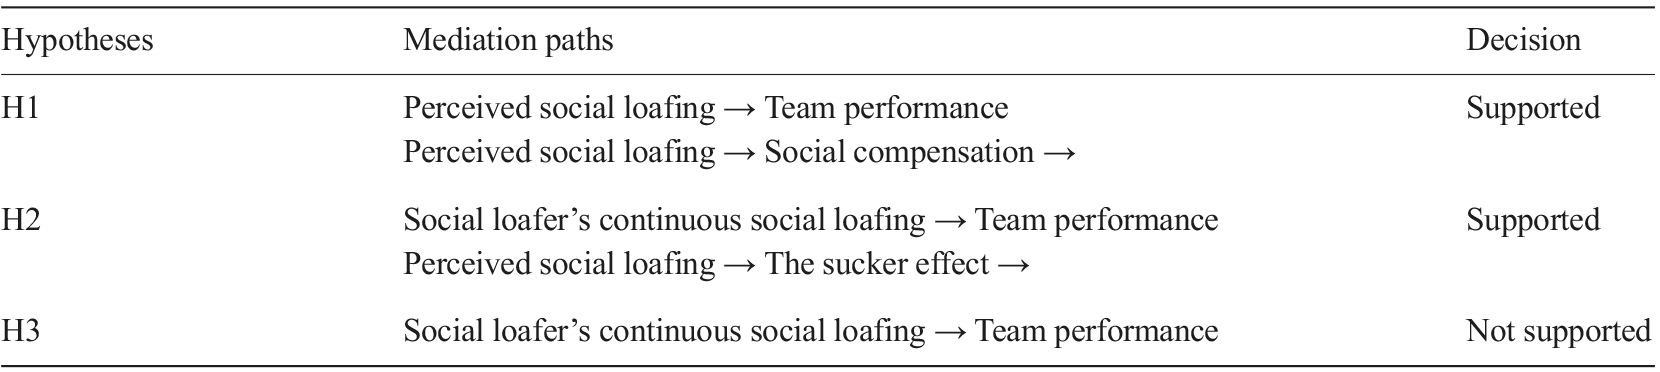
The sucker effect did not correlate with each of the following variables including perceived social loafing, social compensation, social loafer’s continuous social loafing and team performance, as a result the sucker effect did not mediate the relationship between perceived social loafing and team performance. Hence, the Hypothesis 3 was not supported.
Table 6 summarizes the results of the hypothesis testing in this study.
Discussion and conclusion
Theoretical implications
As for the relationship between perceived social loafing and team performance, we hypothesized that perceived social loafing seemed to influence team performance in two ways. On one hand, perceived social loafing may directly impact team performance. On the other hand, perceived social loafing may indirectly affect team performance through some mediating factors. The present study’s findings can be used to verify the existence of these two ways of influence.
The results of correlation and mediation analysis in this study consolidated the existing literature of the directly negative impact of perceived teammate social loafing on the team performance. In various studies of teamwork, the reduction of the whole team performance was identified when team members believed that their teammates engaged in social loafing (George, 1992; Fang & Chang, 2014; Mulvey & Klein, 1998; Tata, 2002).
More importantly, while almost the previous studies had only discussed the direct effect of perceived social loafing on team performance, this study focused on exploring how perceived social loafing affects team performance and sequential consequences of perceived teammate social loafing on other variables.
Despite the fact that previous studies evaluating team responses to social loafing observed inconsistent results, including two opposite responses - the sucker effect and social compensation - the current study documented that when Vietnamese student teams identified social loafing in their learning team, they experienced the social compensation effect rather than the sucker effect. This finding was in line with a research carried out by Singer (2019) in the context of a South African university. The more students perceived their teammates’ social loafing, the more likely they would be to increase their efforts to compensate for their teammates.
This study did not pay attention to only the responses of social loafers’ teammates to social loafing but also the reactions of social loafers themselves in response to the compensatory actions taken by their teammates and the effect of responses of social loafers’ teammates to social loafing on team performance. A striking finding from this analysis was the significant negative effect of social compensation on team performance. In contrast to the proposition given by Simms and Nichols (2014) that social compensation helped each team member save their energy to do their own tasks whereas the group results were still preserved, the research results derived from this study revealed the fact that social compensation negatively affected not only the person who was doing the slacking but also the whole group. In addition, this study found no support for the results found by Schippers (2014) that social compensation prevented the negative influence of social loafing on team performance.
The current research followed up on the call by Singer (2019) to examine the mediating effect of social compensation between perceived social loafing and team performance relationship, and makes a meaningful contribution to the understanding of the mechanism in which perceived social loafing affects team performance. The multiple mediation analysis in this study documented that social compensation was not only a distinct mediator but also the first of two serial mediators in the relationship between perceived social loafing and team performance. In Vietnamese student teams with perceived social loafers, the social compensation of the teammates for the social loafers was identified as a major contributing factor for the low team performance. The results of the causal mediation analysis in this study indicated that social compensation and social loafer’s continuous social loafing were two serial mediators that partially mediated the relationship between perceived social loafing and team performance. In this relationship, the level of perceived social loafing had a negative correlation with the level of the social compensation of social loafers’ teammates, the level of the social compensation of social loafers’ teammates had a negative correlation with social loafer’s continuous social loafing, and social loafer’s continuous social loafing had a negative correlation with team performance. To be specific, when students in classroom teams perceived that others withheld effort, they were more likely to make up for this lost effort. The more the social loafers were compensated by their teammates, the more likely they would be to decrease their efforts. The more the social loafers continued social loafing, the worse team performance became. Although this is a cross-sectional study, we present a serial mediation model which has strong theoretical support and practical implications for team learning. It seems that there was a chain reaction has occurred in Vietnamese student teams: students increased their efforts to compensate for their teammates when realizing that they were social loafers, but this compensation made the social loafers continue reducing their effort and depending on others, as a result there was a decrease in the overall team performance. After all, the way students reacted in this scenario to raise their efforts to compensate for the social loafers was the root cause of the reduction in team performance. The negative consequences of the compensatory actions of the teammates showed that they seemed to make a mistake. Further longitudinal research should be undertaken to confirm these findings.
Practical implications
The most obvious finding to emerge from this study is when perceiving social loafing in classroom team, students had better not pick up the slack for social loafers due to the fact that their compensatory actions can make the social loafers tend to continue social loafing, which can lead to an increasingly decrease in the overall team performance.
Another important practical implication is that lecturers should pay attention to motivate each student in learning teams and help them response appropriately to social loafers for the sake of not only each team member but also the whole team.
Research limitations and suggestions for future studies
Firstly, the research findings may be limited by the recall bias of a retrospective study.
Secondly, the common method bias can result in the artificial inflation of relationships between the variables. Further studies should conduct a series of CFA to confirm the discriminant validity of study variables.
Thirdly, it is recommended that a longitudinal design be used in the future instead of a cross-sectional design like this study to confirm the causal effects.

