


 Inglês (pdf)
 Artigo em XML
 Referências do artigo
 Enviar este artigo por email
 Citado por SciELO
  Similares em
SciELO
Similares em
SciELO 
 Permalink
INTRODUCTION
Anemia is a common complication associated with increased morbidity and mortality in patients with end-stage renal disease (ESRD) on hemodialysis (HD)1,2. Since treatment of anemia with erythropoietin-stimulating agents (ESAs) reportedly reduced the need for blood transfusions and improved quality of life3,4, ESAs have been widely used as first-line therapy for anemia in HD patients. ESA resistance is, however, common, costly, and apparently related to worse outcomes in this population5. The mechanisms of ESA hyporesponsiveness are not fully understood, but are likely to be multifactorial, relating to iron deficiency, inflammation, and malnutrition6,7. Difficulty in interpreting iron deficiency tests and their relationship to inflammation may also contribute to delayed diagnosis. Other possible risk factors involve genetic polymorphisms, hyperparathyroidism, inadequate dialysis, and aluminum overload8.
The ESA resistance index (ERI) has been proposed as an indicator for ESA hyporesponsiveness, and some previous studies have suggested that it can predict mortality in HD patients9,10.
The aim of this study was to analyze the factors influencing ESA resistance in prevalent HD patients and their association with all-cause short-term mortality. We also intended to clarify the relationship between inflammatory and iron markers according to the responsiveness to ESA therapy in this population.
SUBJECTS AND METHODS
We conducted a single-center retrospective cohort study of prevalente HD patients at the Centro Hospitalar do Médio Tejo, EPE HD unit between January 2019 and March 2020. Patients who recovered renal function, lost follow-up, or switched to another renal replacement therapy were excluded. Patients with acute or chronic inflammatory disease, active malignancy and those not receiving ESA were also excluded. Patients were treated with weekly darbepoetin alfa to maintain hemoglobina (Hgb) concentration between 10-13g/dL, weekly intravenous (IV) iron (iron sucrose) to maintain ferritin levels between 200-800mg/dL, oral vitamin B complex and folic acid 3 times a week. No patients received blood transfusions during the study follow-up period.
To evaluate the dose-response effect of ESA therapy, we used the ESA resistance index (ERI), calculated as the mean weekly weightadjusted ESA dose (U/Kg per week) divided by the mean hemoglobina level (g/dL), over a 3-month period. To compare with previous reports on ERI with epoetin, darbepoetin alfa dose was converted based on the ratio of their equivalent peptide masses (200 units of epoetin to 1 μg darbepoetin alfa, as previous described). According to the mean ERI value, patients were categorized in two cohorts: ERI ≤ 10 and ERI >10 (defined as those with ESA hyporesponsiveness in this study).
Baseline clinical and demographic characteristics, including age, gender, cause of ESRD, and anthropometric data were collected, as well as patient comorbidity score according to the Charlson Comorbidity Index (CCI). ERI was calculated during the first 3 months of the study.
Laboratory parameters were measured monthly over the same period, including hemoglobin, serum iron, ferritin, transferrin saturation (TSAT), albumin, phosphorus (P+), calcium (Ca2+), C-reactive protein (CRP) and intact parathyroid hormone (iPTH). Patients were followed up for one year and all-cause mortality according to ERI was assessed.
Statistical analysis was performed using SPSS version 23.0 for Mac OS X. Continuous variables were presented as mean and standard deviation or median and interquartile range (IQR) for variables with skewed distributions. Nominal variables were presented as number (frequency) and percentage. A p value < 0.05 was considered statistically significant.
Baseline characteristics and laboratory data were compared among cohorts using the student t-test for normally distributed continuous variables, Mann-Whitney U-test for skewed distributed continuous variables and Chi-square test for categorical variables. Pearson correlation was used to analyze correlations between ERI values and different variables. Logistic regression analysis was performed to identify predictors of ESA hyporesponsiveness. The association between ESA hyporesponsiveness and all-cause mortality at one year was assessed using standard survival analysis methods.
RESULTS
Fifty-nine prevalent HD patients were recruited into the study: 37 (62.7%) were male, 23 (39%) diabetic and 36 (61%) had congestive heart failure. Hypertension was present in 71.2% of patients and 28.6% of those were treated with angiotensin-converting enzyme inhibitors (ACEIs)/ angiotensin receptor blockers (ARBs). Mean age was 74.58 ± 12.54 years. Mean CCI was 7.34 ± 2.35 and 29 (49.2%) patients had CCI > 8. Most patients (83.1%) were undergoing online hemodiafiltration and had a central venous catheter (CVC) (50.8%). Mean HD vintage was 26.29 ± 22.89 months. Mean Hgb concentration for the entire group was 10.97 ± 0.86g/dL, mean ESA dose was 69.59 ± 82.96IU/Kg/week and mean ERI was 10.05 ± 8.51IU/Kg/week/g/dL. Twenty-four patients (40.7%) had hyporesponsiveness to ESA therapy defined as having na ERI superior to the mean for the whole group (ERI >10) (Table 1).
Using a Pearson Correlation, we found a correlation for ERI which was positive for CRP (r=0.286, p=0.028) and negative for Hgb (r=-0.614, p=0.001), serum iron (r=-0.322, p=0.016), TSAT (r=-0.401, p=0.002), albumin (r=-0.519, p=0.001) and iPTH (r=-0.350, p=0.007).
Table 1 Baseline clinical and analytical characteristics of prevalent HD patients included in the study
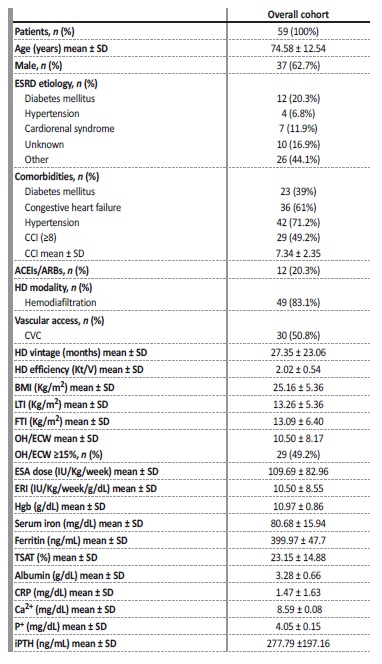
p-values represent a Student T-test for continuous variables and Chi-square test for categorical variables. ESRD, end-stage renal disease; SD, standard deviation; IQR, interquartile range; CRP, c-reactive protein; CCI, Charlson Comorbidity Index; CVC, central venous catheter; BMI, body mass index; LTI, lean tissue index; FTI, fat tissue index; Hgb, hemoglobin; TSAT, transferrin saturation; ACEIs, angiotensin-converting enzyme inhibitors; ARBs, angiotensin receptor blockers, Ca2+, calcium; P+, phosphorus; iPTH, intact parathormone
Comparison of clinical and analytical data among ERI groups
Concerning patient characteristics, only CCI (p=0.045) and use of permanent CVC for HD (p=0.004) differed significantly among groups. Age, sex, etiology of ESRD, presence of diabetes, hypertension or congestive heart failure, HD modality and HD vintage were similar in the two cohorts. The percentage of patients treated with ACEIs/ARBs was also similar.
Patients with hyporesponsiveness to ESA therapy (ERI>10) had significantly lower body mass index (BMI) (p=0.012) and fat tissue index (FTI) (p=0.037), lower Hgb concentration (p=0.001), lower sérum iron (p=0.001), lower TSAT (p=0.003), lower albumin (p=0.003), lower iPTH values (p=0.004) and higher CRP levels (p=0.027), when compared to those with ERI≤10. Predialysis fluid overload, defined as overhydration/ extracellular water > 15%, measured by bioimpedance, was identical between cohorts (Table 2).
Table 2 Baseline characteristics of HD patients classified according to ERI groups
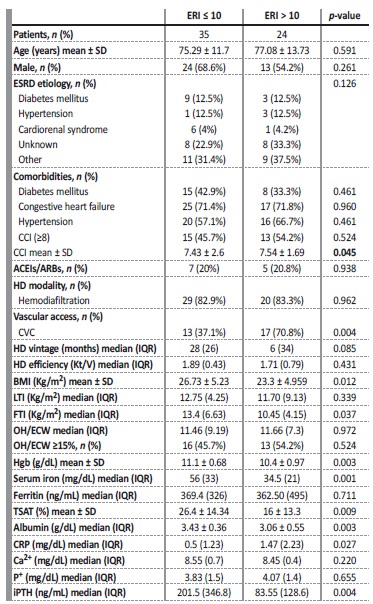
p-values represent a Student T-test for normally distributed continuous variables (age, BMI, Hgb, TSAT, CCI), Mann-Whitney U-test for skewed distributed continuous variables and Chi-square test for categorical variables. ESRD, end-stage renal disease; SD, standard deviation; IQR, interquartile range; CRP, c-reactive protein; CCI, Charlson Comorbidity Index; CVC, central venous catheter; BMI, body mass index; LTI, lean tissue index; FTI, fat tissue index; Hgb, hemoglobin; TSAT, transferrin saturation; ACEIs, angiotensin-converting enzyme inhibitors; ARBs, angiotensin receptor blockers, Ca2+, calcium; P+, phosphorus; Ipth, intact parathormone.
Relationship between iron status and inflammatory markers among ERI groups
No differences were found in serum ferritin levels between groups. To investigate the relationship between ferritin, iron status and inflammatory markers according to the patient’s responsiveness to ESA therapy, Spearman´s rank correlation was performed. A significant positive correlation was observed between ferritin and CRP levels (r=0.77, p=0.006) in the group of patients with hyporesponsiveness to ESA therapy (ERI > 10) (Figure 1). No statistically significant correlations were found between ferritin and TSAT or serum iron levels in this group.
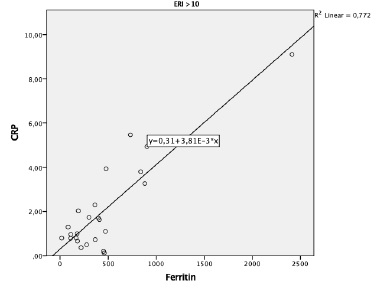
For the group of patients with ERI ≤10, positive correlations were found between ferritin and TSAT levels (R=0.35, p=0.04) and ferritin and serum iron levels (R=0.36, p=0.034), but not between ferritin and CRP.
Predictors of hyporesponsiveness to ESA therapy
To identify the factors associated with hyporesponsiveness to ESA therapy in our population, a multivariate logistic regression analysis was conducted. Because ESA responsiveness was calculated by dividing the ESA dose over the body weight and Hgb concentration, we excluded Hgb as a confounding factor. Lower BMI (OR: 0.86; 95% CI: 0.76-0.98; p=0.029), lower TSAT levels (OR: 0.95; 95% CI: 0.90-0.99; p=0.029) and the use of CVC (OR: 3.83; 95% CI: 1.06-13.88; p=0.041), were significantly associated with hyporesponsiveness to ESA therapy (Table 3).
Table 3 Multivariable logistic regression analysis of factors associated with hyporesponsiveness to ESA therapy

OR - odds ratio; BMI - body mass index; TSAT - transferrin saturation; CVC - central venous catheter
Association between hyporesponsiveness to ESAtherapy and all-cause one year mortality
During the follow-up period, 11 (18.64%) patients died: 7 patients from infectious causes (2 CVC-related infections); 3 patients from cardiovascular events; and 1 patient from acute upper gastrointestinal bleeding. The mean ERI was significantly higher in these patients (17.47 ± 9.22 vs 8.91 ± 7.62 U/kg/week/g/dL; t=3.24; p=0.002). One year survival was 91.4% in the group with ERI ≤10 and 66.7% in those with ERI > 10 (log-rank=6.491; p=0.011) (Figure 2).

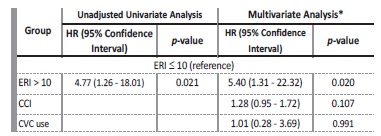
Using a Cox proportional hazards analysis, we observed that patients with ERI >10 had an increased risk of all-cause mortality at one year when compared to those with ERI ≤ 10, in both unadjusted (HR: 4.77; 95% CI: 1.26-28.08; p=0.021) and adjusted models for CCI and CVC use (HR: 5.40; 95% CI: 1.31-22.32 p=0.018), both baseline characteristics that significantly differed among groups (Table 4).
DISCUSSION
This study documents the relationship between comorbidity factos and ESA resistance in prevalent HD patients and their negative effect on short-term survival. To assess the response to treatment, we used the relationship between body weight-adjusted dose of ESA and Hgb concentration, as described in earlier studies. ERI is easy to calculate and allows directly assess the response to ESA treatment by looking at a single variable. This variable allows to compare groups of patients under different circumstances and evaluate the effect of diferente treatments in a single patient. Furthermore, our results suggest that ERI acts as a prognostic factor for all-cause one-year mortality in HD patients.
Our study confirmed previous reports that malnutrition, inflammation, and iron deficiency are the most common causes of ESA hyporesponsiveness in HD patients6,7, and suggested that new factors, such as low levels of iPTH and CVC use, may also influence ESA response in this population.
Nutritional status is known to influence the response to ESA, with lower albumin levels usually accompanied by an increase in ERI. Kalantar et al.11 showed a correlation between ERI and malnutrition score, cholesterol, and pre-albumin, while López-Gómez et al.9 found that BMI and albumin were inversely correlated to ERI. Since weight is a part of ERI definition, these results should be interpreted with caution.
In our study, hyporesponsive patients had lower BMI and FTI, but n difference was found in lean tissue index (LTI) among groups, suggesting that the protective effects of BMI on ERI may be due to a higher percentage of fat tissue. These results reiterate those of previous research in which adipose tissue shows a protective effect on HD patients as a signal of proper nutritional status12,13. Like other studies, albumin also showed a strong inverse correlation with ERI in our population.
Although albumin concentration can be considered an indicator of nutritional status, it is also a marker of inflammation, which acts as a negative acute phase reactant. Malysko et al.14 described a significantly lower albumin concentration associated with higher levels of CRP, IL-6, and TNF-α among HD patients with resistance to ESA therapy. In our study, ESA hyporesponsiveness was also directly related to inflammatory markers such as CPR.
Iron deficiency is a multifactorial cause of resistance to ESA therapy15, resulting from blood loss from HD extracorporeal circuit or routine laboratory tests, occult gastrointestinal blood losses and elevated hepcidin levels. We found no relationship between sérum ferritin and ERI. In contrast, patients with lower serum iron and TSAT levels had less favorable responses to ESA therapy. These findings suggest that ESA responsiveness is enhanced by adequate levels of functional iron, and, on the other hand, serum ferritin is not a good marker to assess iron requirements, as recently demonstrated in the DRIVE study16. When comparing the relationship between ferritin and other iron and inflammatory markers, according to the ERI, we found a positive correlation between ferritin and CRP in hyporesponsive patients and ferritin and TSAT and serum iron in those who showed better responses. Our results suggest that ferritin may be a marker of inflammation rather than iron status in hyporesponsive patients.
Therefore, a higher ferritin level secondary to inflammation may mask an underlying iron deficiency. Our study supports the need for a complete profile of iron studies and, eventually, new biomarkers, to safely exclude iron deficiency and guide iron therapy in this group of patients.
In our study, patients with permanent CVC for HD had a 3.83 increased risk of resistance to ESA therapy. In fact, the CVC can act as a source of infection and chronic inflammation, leading to the release of inflammatory cytokines, partially blocking erythropoiesis17.
Previous studies have revealed a significant relationship between ESA hyporesponsiveness and hyperparathyroidism18,19. Our results do not support these findings. Instead, hyporesponsive patients showed lower iPTH levels and an inverse correlation between iPTH and ERI was found. Recently, low iPTH levels have been associated with inflammation and malnutrition among HD patients, which may justify our results20,21
CONCLUSION
Our study revealed that ESA hyporesponsiveness evaluated by the ERI was associated with an increased risk of all-cause one-year mortality in prevalent HD patients. Although there are no quantitative definitions of ESA hyporesponsiveness based on the evidence from studies examining the prognosis of HD patients, the ERI is easy to calculate in daily practice and appear to be a useful tool for assessing patients´ clinical status.
There were some limitations to our findings. This was a singlecenter retrospective study with a small sample and short follow-up period. Therefore, large-scale multicenter studies may be needed to corroborate our results.

