


Serviços Personalizados
Journal

Artigo
 Inglês (pdf)
 Artigo em XML
 Referências do artigo
 Enviar este artigo por email
Indicadores
 Citado por SciELO
 Links relacionados
 Similares em
SciELO
Similares em
SciELO Compartilhar

 Permalink
Portugaliae Electrochimica Acta
versão impressa ISSN 0872-1904
Port. Electrochim. Acta vol.30 no.3 Coimbra maio 2012
https://doi.org/10.4152/pea.201203145
Behavior of Electrogalvanized Steel Pre-Treated with Cr(III)-Based Baths and Exposed to 0.5 M Na2SO4 Solution
C.R. Tomachuk1, C.I. Elsner2,3 and A.R. Di Sarli3,*
1 Energy and Nuclear Research Institute, IPEN/CNEN-SP, CCTM, Av. Prof. Lineu Prestes, 2242, CEP 05508-000, São Paulo, SP, Brazil.
2 CIDEPINT: Research and Development Centre in Paint Technology (CICPBA-CCT CONICET LA PLATA); Av. 52 s/n entre 121 y 122. CP. B1900AYB, La Plata-Argentina
3 Engineering School, National University of La Plata, Av. 1 esq. 47. CP. B1900TAG, La Plata-Argentina.
Abstract
As Cr (VI) compounds used to formulate conversion layers provide enhanced anticorrosive protection to zinc coatings, but they are produced using hazardous chemicals, the development of ''green'' technologies is a paramount purpose. Consequently, the corrosion behavior of zinc coatings subjected to a Cr3+ based passivating treatment, with and without sealing, was studied through EIS measurements in 0.5 M Na2SO4 solution. The analyses of the experimental data allowed inferring that the Cr3+-based conversion treatment with an adequate sealer provides good corrosion resistance and, coupled to an adequate painting system, could be a suitable alternative to traditional chromate coatings.
Keywords: corrosion, trivalent chromium, conversion layer, sealing treatment, electrogalvanized steel.
Introduction
The corrosion of galvanized steel is one of the major problems in industry. The material could become more resistant to corrosion if a protective conversion coating is applied on top of the zinc layer. The term ''conversion coating'', as used in the metal-finishing industry, refers to the conversion of a metal surface into a surface that will more easily accept applied coatings and/or provide a more corrosion resistant surface [1]. Conversion coatings for zinc have been in use since the early 1920's and there are a number of different products on the market [2]. The chromatation layer is one of the most important of these products, performing both as an anodic inhibitor, forming a passive layer lowering the zinc dissolution rate and, as an efficient cathodic inhibitor, lowering the rate of the oxygen reduction reaction on the metal surface and avoiding the formation of blisters in painted surfaces [3].
Responding to increasingly more rigorous environmental protection activities, recent years have shown progressive advances in order to reduce the use of environmentally-hazardous materials. In line with this purpose, the development of various kinds of chromate-free coated steel sheets, to be used in industries such as food, automotive, appliances, etc., is being extensively explored all over the world. In this sense, the most common transitional alternative to Cr6+ is Cr3+, which is used since the mid 1970's [4-8]. The first-generation of trivalent chrome conversion processes was based on fairly stable Cr3+ complexes, which slowed their reactivity rates even at high temperatures. They produced film thicknesses of 20 to 30 nm with limited corrosion resistance. To produce thicker passivating layers, a second-generation of trivalent passivating process was developed. It incorporates accelerators, modified complexes, and is operated at higher concentration and temperature to drive the reaction kinetics to a faster rate. When applied as recommended, film thicknesses of 300 to 380 nm, i.e. equivalent to those produced from yellow Cr6+ passivating solutions, were obtained. The film in this case consists of an insoluble barrier layer free of hexavalent chrome. The main advantage of Cr3+ plating baths is that these ions are non-toxic and, therefore, environmentally benign alternatives. However, their corrosion resistance is generally less than that of the Cr6+ [10-12]. Consequently, many recent studies have focused on improving the corrosion resistance of the Cr3+ based conversion layers, subjecting them to a sealing treatment. Bellezze et al. [10] reported that the corrosion resistance of the Cr3+ layer increased dramatically with a Si based sealing treatment, making it equivalent to that of the Cr6+-based conversion layer. According to Fonte et al. [13], the Cr3+ conversion layer formed in a bath containing transition metal ions such us Co2+, Ni2+ and Fe2+ showed higher corrosion resistance than those formed in absence of them. This finding was confirmed by Tomachuk et al. [14, 15].
Concerning the formation of the protective layer on zinc, it was demonstrated that the passive layer contains Zn (II) and Cr (III) oxides/hydroxides [16]. Nevertheless, other authors [3] stated that the chromate layer does not contain a significant amount of zinc, it is permeable to zinc dissolution and its main component is Cr(OH)3.2H2O.
Taking into account that the requirements for Cr(IV)-free coatings on electrogalvanized steel sheets are high due to their potential great extent of uses, the aim of this work was to study the behavior of Cr(III)-based passivating pre- treatments applied on electrogalvanized steel panels and used as the only coating layer. After passivated, some samples were subjected to sealing treatments, which led to form layers of Si compounds in prevalently organic or inorganic matrices. By covering the passivating layer pores and cracks, these treatments improve its corrosion performance. The study of the samples' evolution during their immersion in 0.5 M Na2SO4 solution was accomplished by electrochemical impedance spectroscopy.
Experimental details
Samples preparation
AISI 1010 steel sheets (7.5×10×0.1 cm) were industrially electrogalvanized using a cyanide-free alkaline bath containing Zn2+ 12 g L-1, KOH 130-140 g L-1, K2CO3 50 g L-1 and commercial addition agents; the operating conditions were cathodic current density 2 A dm-2, and temperature 25 °C. Immediately after finishing the zinc electrodeposition step, each sample was coated with the make up described in Table 1, and following the supplier recommendations, Table 2.

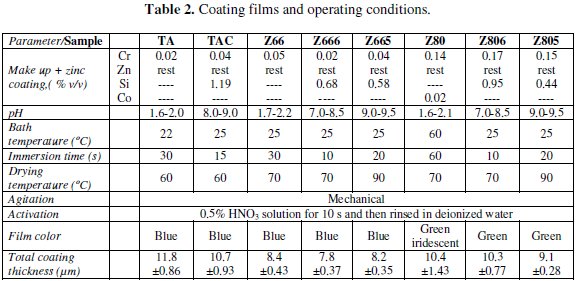
At the end of this step, samples were rinsed with deionized water, and then dried. The sealing treatment 1 (S1) was applied on TA samples (for obtaining TAC samples), the sealing treatment 2 (S2) on Z66 and Z80 samples (for obtaining Z666 and Z806 samples, respectively), and the sealing treatment 3 (S3) on Z66 and Z80 samples (for obtaining Z665 and Z805 samples, respectively).
Thickness measurements
Coating thickness was measured with a Helmut Fischer DUALSCOPE MP40 according to the ASTM B499-09 standard.
EIS measurements
The electrochemical measurements were performed by using the conventional three electrode cell. In it, a Pt-Rh mesh and a saturated calomel electrode (SCE) served respectively as counter and reference electrodes, while the pre-treated electrogalvanized steel samples, with an exposed area of 15.9 cm2, acted as working electrode.
EIS measurements, as a function of the exposure time in quiescent and open to air 0.5 M Na2SO4 solution, were conducted using a Solartron 1255 Frequency Response Analyzer coupled to a Solartron 1286 Potentiostat/Galvanostat (both controlled by the ZPlot program®). A small potential perturbation (sinusoidal signal of 10 mV peak to peak in amplitude around the open circuit potential and ten measurements/decade) was applied within a frequency range of 10-2 < f(Hz) < 105. Despite ten points/decade were measured, only some of them were plotted to make simpler the visualization of the Bode diagrams.
The experimental impedance spectra were fitted and interpreted on the basis of equivalent electrical circuit models using the software developed by Boukamp [17]. All the measurements were performed at laboratory temperature (22 ± 3 °C), and with the electrochemical cell inside a Faraday cage to reduce external interferences as much as possible. The sample integrity was checked by measuring the corrosion potential after each test to confirm that the change from the initial value was no higher than ± 5 mV.
Taking into account that the corrosion behavior of passivated, painted and/or multi coated materials strictly depends on the production procedure, all the tests were carried out on three replicates of each sample type and the average results obtained for them are the reported in the following Tables and Figures.
Results and discussion
Table 2 reports the samples identification, chemical composition and coating thickness prior to exposure. In it, the dispersion of the coating thickness values was mainly attributed to the fact that the steel sheets electrogalvanization as well as the conversion layers deposit were carried out in a continuous galvanizing line, where this type of dispersions commonly occur. On the other hand, although information related to the conversion layers thickness could not be obtained, it was possible to observe that they were uniform and bright throughout the entire surface [14].
Electrochemical behavior
Corrosion potential and EIS measurements carried out on electrogalvanized steel surfaces protected by different conversion treatments but exposed to the same aqueous electrolyte provide an opportunity to better analyze the evolution of their electrochemical behavior. When the overall coating system is considered, it should be noted that, being the thin conversion layer the outermost one, electrochemical interactions between this layer and its environment starts just after getting into contact, particularly if the medium is a saline solution. For that reason, the Cr (III)-based conversion coating plays a paramount role in delaying zinc dissolution, acting as a barrier layer to the diffusion of corrosion inducing species towards the underlying zinc film and/or inhibiting the oxygen reduction reaction by polarizing the cathodic areas. However, as the protective effectiveness of each thin Cr (III)-based conversion layer depends not only on its chemical composition but also on its compactness and lack of defects, desirable protective properties are only obtained if an adequate sealant is used.
Corrosion potential evolution
At the beginning of the immersion test, the corrosion potential (Ecorr) values of all the coated panels ranged between -1.02 and -1.04 V/SCE. As the time elapsed, these values did not vary by more than ± 0.020 V from their initial ones.
Bode plots
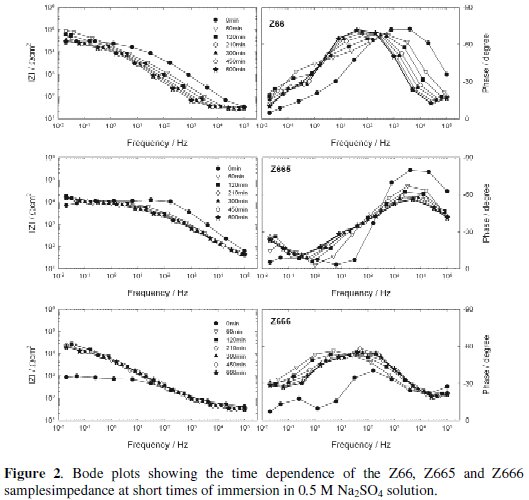
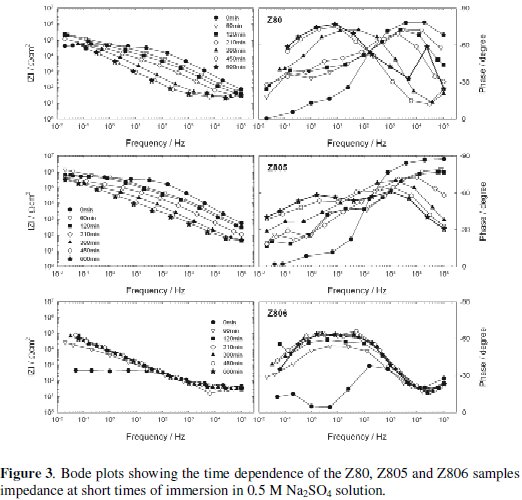
The impedance modulus (|Z|) and phase angle curves as a function of the exposure time to 0.5 M Na2SO4 solution are shown in Figs. 1 and 2 for short immersion times, and Figs. 3 and 4 for long immersion times.
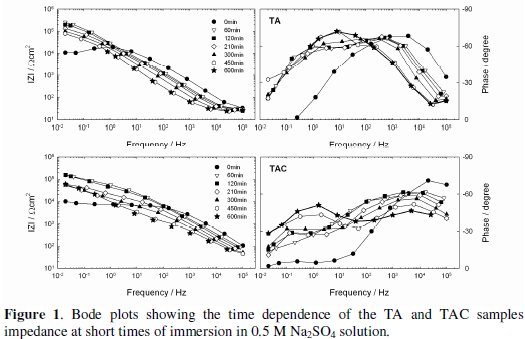
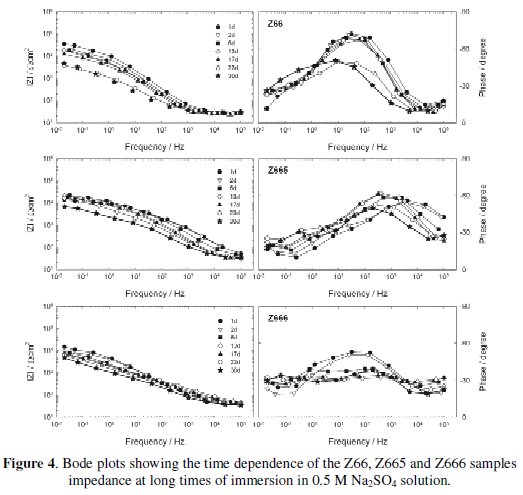
A first qualitative analysis of these plots shows that the shape of all the experimental diagrams was quite similar. The Phase vs. Frequency plots clearly show the presence of at least two time constants, one at low frequencies and another at high frequencies, which, in some cases, seem to be three due to the appearance of another at intermediate frequencies. As well, in the considered frequencies range is clear that the |Z|-time oblique lines mostly shifted towards the regions of high to low frequencies, which indicates that the Bode plot is sensitive to the coating damage and the dynamic of the corrosion process.
As seen in Fig. 1, between 0 and 60 min of exposure, the |Z| values at the low frequency range increased almost one order of magnitude (104 to 105 Ω cm2) for the TA and TAC samples.
Such increase was probably due to the barrier effect contribution offered by the corrosion products gathered at the localized coating defects. Then, the total resistance showed a slight decrease but their values were always higher than those corresponding to t = 0. On the other hand, the low impedance values measured at the high frequency range suggest the existence of electrochemical activity in parts of the zinc layer exposed to Na2SO4 solution through defects in the pre-treatment one [18]. This behavior was confirmed by the phase angle evolution towards slightly more capacitive values at the low frequency range, and the displacement of its maximum value towards lower frequencies.
Fig. 2 shows that the shape of the impedance spectra corresponding to the Z66, Z665 and Z666 samples did not differ much from the above described but also that the |Z| values at the low frequency range were lower during the test.
The anomalous fact that the Z66 sample's impedance was slightly greater than those corresponding to the Z665 and Z666 samples means that in both cases the respective Cr(III)-based conversion layers were not effectively sealed by the S3 and S2 products, reason by which the cathodic/anodic areas relationship increased and, consequently, the corrosion rate of the underlaying zinc layer. Again, the slight increase of |Z| and Phase values during the first hour of exposure was ascribed to the corrosion products gathered at the bottom and/or within the coating defects, which enhanced the coating barrier protection. On the other hand, the slight decreased of |Z| values at medium and low frequencies showed by the three types of samples pointed out the presence of an electrochemically active interface.
With regard to the Z80, Z805 and Z806 samples, Fig. 3, it can be seen that, as occurred with the TA and Z66 samples series, the initial |Z| at low frequencies began low, but then increased a few KΩ for the Z80 and Z805 samples, and at least two orders of magnitude for the Z806 samples.
From 60 min of exposure, and up to the end of the test, the |Z| values at medium and low frequencies decreased, more in Z805 and in Z80 than in Z806 samples, suggesting that in all them there were electrochemically active areas.
The above-depicted performance could be explained assuming that the thin conversion layer can not avoid an initially fast and localized attack of the zinc substrate, whose white corrosion products deposited at the bottom and/or within the coating defects contributed to increase the samples impedance. The fact that the initial attack to the zinc substrate was localized could be attributable to the conversion layer pores and/or cracks acting as an electrical shunt. As the exposure time went on, it is possible that certain equilibrium between the rate of both the corrosion products development and their diffusion towards the electrolyte was reached and, consequently, the impedance fluctuations become small.
At longer immersion times, the impedance spectra of most the samples showed minor changes, consequently only the corresponding to Z66, Z665 and Z666 samples were used to illustrate the Fig. 4.
As can be seen, the more important change took place on Z66 samples whose initial total impedance at low frequencies, about 4.104 Ω cm2, decreased almost one order of magnitude after 30 days of exposure. Moreover, by comparing the performance of all the samples during the short and long exposure times, it can be inferred that: 1) independent of the overall coating composition, the greater and better defined changes took place within the first 24 h of immersion; and 2) under the present exposure conditions, the barrier resistance afforded by the conversion layers, without or with sealant, was not so effective as to avoid the development of at least a minor electrochemical activity at the conversion layer/zinc interface.
Impedance data treatment
One of the more important difficulties for analyzing the EIS data from the impedance spectra deconvolution is, in general, to find an electrical equivalent circuit model and/or the parameters to explain the corrosion behavior of each analyzed system. Some authors have reported circuit models used to simulate EIS data coming from measurements on Cr and Mo-based conversion layers [1922], while others [23-26] accounted for partial analysis based on Bode or Nyquist diagrams. As well, it was reported that the capacitance of the coating and corrosion layer could be distinguished from different frequency range in the Bode plots of the conversion layers [27].
In this paper, the impedance data were well described either by the complete or partial version of the equivalent circuit proposed in Fig. 5.
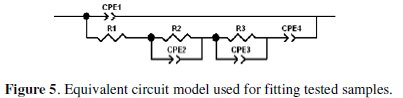
In it, the resistive and capacitive components associated to the physicochemical processes taking place in each reactive and complex interface were fitted according to the respective sample's impedance spectrum.
Throughout the test, the time constants exhibited some Cole-Cole type dispersion [28] determined by the value of the corresponding ni parameter (0 < ni ≤ 1).
Furthermore, distortions observed in those resistive-capacitive contributions indicate a deviation from the theoretical models in terms of a time constant's distribution due to either lateral penetration of the electrolyte at the metal/coating interface (usually started at the base of intrinsic or artificial coating defects), underlying metallic surface heterogeneity (topological, chemical composition, surface energy), and/or diffusional processes that could take place during the test. Since all these factors make the impedance/frequency relationship be non-linear, they are taken into consideration by replacing one or more capacitive components (Ci) of the equivalent circuit by the corresponding constant phase element (CPEi) [17].
In the proposed circuit, where the constant phase element (CPE) is given by [17, 29, 30]:

the time constant (R1CPE1) at high frequencies was associated to the resistive (R1) and capacitive (CPE1) contribution of the conversion layer to the overall impedance [20-23]. As the frequency values diminish, and taking into account that the corrosion-inducing chemicals (water, oxygen and ionic species) reach the electrochemically active areas of the zinc layer through the conversion layer defects, it is reasonable to assume that the corrosion process developing at the zinc surface should be placed in series with R1. The R2 and CPE2 parameters model the charge transfer resistance and the electrochemical double layer capacitance of the corrosion process. As a result of the zinc dissolution, the corrosion products accumulate in the coating defects affecting the size and shape of the system impedance by acting partially as a barrier. Such contribution is taken into account through the resistive, R3, and capacitive, CPE3, parameters. The diffusional component CPE4 ≡ Zd obtained at certain exposure times was associated to the oxygen diffusion-controlled reaction usually found in zinc corrosion [26, 31-36].
Difficulties were sometimes found while attempting to provide an accurate physical description of the processes. In such cases, a standard deviation (Χ2) ≤ 5.10-4 was used as a final criterion by considering that the smaller this value becomes, the closer the fit is to the experimental data [17]. According to the impedance data dispersion, the fitting process was performed using the CPEi or the dielectric capacitance (Ci). However, this last parameter was used in all the following plots to facilitate the results visualization and interpretation.
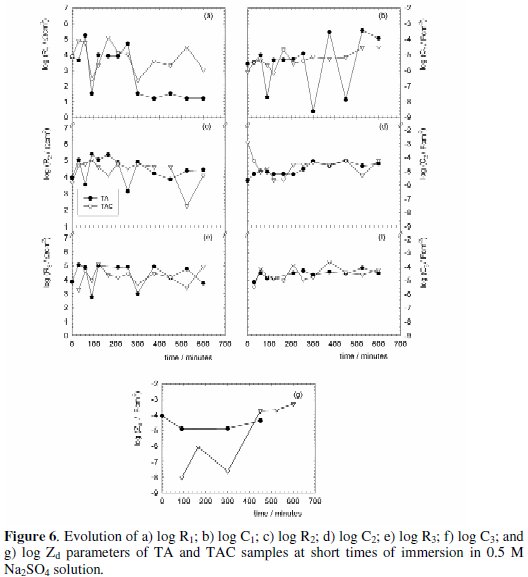
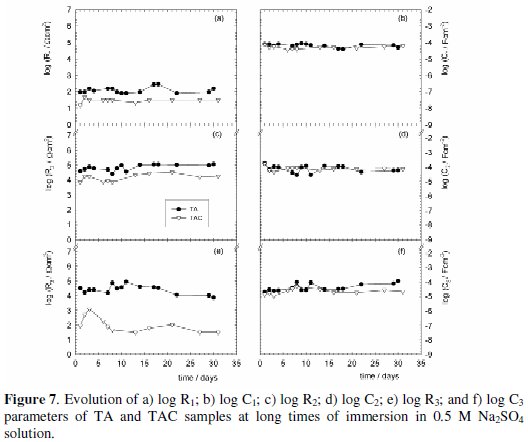
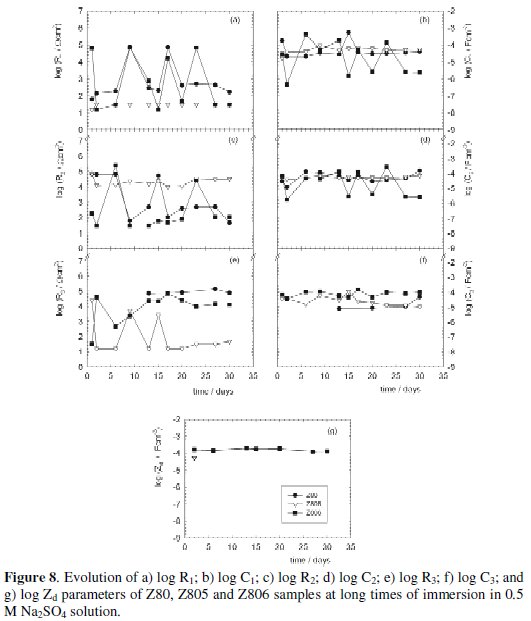
The trend of each parameter contributing to the system impedance, i.e. R1, C1, R2, C2, R3, C3 and/or Zd is reported due to space limitations only for some samples in Fig. 6a-g for short, and Figs. 7a-f and Fig. 8a-g for long immersion times.
As result of the dynamic behavior shown by the surface properties due to the conversion layer deterioration, zinc corrosion process, and/or heterogeneous morphology of the zinc corrosion products, a high variation of their associated time constant values was observed during the immersion test.
Time dependence of the impedance resistive and capacitive components
The chemically stables Cr(III) oxides/hydroxides forming the outermost layer of the tested samples can act as a barrier layer able to inhibit the zinc corrosion process by lowering the rate of the oxygen reduction reaction at the cathodic areas and/or the arrival of the corrosion inducing chemicals to the zinc coating. The TA and TAC samples plots (Fig. 6a-g) clearly indicate that the resistance of the conversion layer (R1), the zinc corrosion (R2), and the corrosion products (R3) increased within the first hour of immersion, but then presented a rather fluctuating evolution up to the end of the test. Such fluctuations were certainly abrupt in some cases and indicatives of localized development of conversion layer defects (R1), pitting corrosion of the underlaying zinc coating (R2), and/or changes in the barrier effect of the white corrosion products (R3). It is seen that the R1 and R2 values were mostly greater for TAC than those for TA samples, while the corresponding R3 values were quite similar for both sample types. This anomalous behavior could be attributed to the presence of small surface defects on the TA samples which can act as an electrical shunt; on prolonging the immersion, these pits were occluded and the resistances increased. This process continued until the protective properties of the conversion layer without sealant were totally lost. At the same time, the coating capacitance (C1) corresponding to TA samples showed much higher fluctuations than that of the TAC samples whose values remained almost constant and close to the initial ones. This trend indicates a high deterioration of the conversion layer in the TA samples, while slight damage was revealed in the TAC samples.
With regard to the C2 and C3 curves for both sample types, they showed not only similar but also stabilized values, ≈ 10-4 - 10-5 F cm-2, during the immersion test. Both results are indicative of small changes in variables such as thickness, area and/or dielectric constant affecting the faradic process and white corrosion products behavior within and/or at the bottom of the micro-cracks.
Taking into account that the resistive (Ri) and capacitive (Ci) parameters depend directly or inversely on a series of specific (chemical composition, resistivity, dielectric constant) as well as geometric (layer thickness, intact and/or flawed areas) variables, it is difficult to explain accurately all the interface changes leading to the different trends shown by the samples evolution during the immersion test. However, if within certain limits is considered that most of the above mentioned variables have equal or very similar values, it may also be reasonable to think that the main distinction between the TA and TAC samples are the sealing treatment and the area that could be involved in the physicochemical process associated to a given time constant. Then, the aforementioned evolution trends were ascribed to both factors which could be influencing the coupled resistive and capacitive components of the impedance in such a way that these must be affected by different areas [37] instead of the whole electrode area commonly used when the corresponding value is expressed per square centimeter.
Additional evidence showing that in these samples the sealing treatment improved the protective properties of the conversion layer was found by observing the Zd evolution, Fig. 6g. In it, the time elapsed before the appearance of the diffusion process for the TAC was longer than for the TA samples due to the slower corrosion rate of those. Accordingly, a longer induction time (about 100 min of exposure) was necessary before the thickness of the corrosion product's layer could delay the oxygen arrival to the reaction areas making that the cathodic reaction (oxygen reduction) was the rate determining step (rds) of the localized zinc corrosion process [38-40].
The not shown (due to space limitations) electrochemical response derived from fitting the impedance data of the Z66, Z665, Z666 and Z80, Z805, Z806 samples was qualitatively similar but quantitatively different between them and also of those obtained for the TA and TAC samples. Such results indicated that different process occurred on those samples; nevertheless, in general terms may be established that on passing from the conversion layers without sealants (Z66 and Z80) to those with sealant (Z665, Z666, and Z805, Z806 samples), the parameter values indicated that, like occurred for TA and TAC samples, the whole coating damages were faster and more significant in the absence of the sealant. Such effect was particularly observed in the Z66 series and Z806 samples owing to the null (Z66) or lower (Z665, Z666 and Z806 samples) Si content in the respective conversion layer. Whereas, the null Si content in Z80 samples was compensated by the presence of Co in the conversion layer, which improved its corrosion resistance [41].
For all the coatings, the not shown values of the exponent n, included in equation (1), slightly decreased with time and ranged between 1 and 0.5. This means that as the exposure test elapsed, each layer forming part of the coated steel system behaved like a pure capacitor (n = 1), a capacitor with loss (0.5 < n < 1), or a diffusion element (n = 0.5) [17].
According to results reported by other authors [42, 43], the capacitance (C2) increase was correlated with the corrosion initiation by the pitting mechanism. The size of the pits observed in this investigation correlated well with the increase in the C2-time plots, indicating that the pitting corrosion can be revealed by the C2 increase, and also that when its values decrease the pits become partial or completely occluded by the corrosion products.
It is important to point out that, independent of the conversion layer structure and composition, with all the tested coatings there was either higher or lower but almost continuous zinc electrochemical activity. Regarding this, the dynamic behavior of the processes taking place at these interfaces is reflected by the changing values of the resistive-capacitive parameters associated to the time constants feasible to be deconvoluted, as well as by the rds of the zinc dissolution reaction, which was mostly under diffusion control at short immersion times. With regard to the barrier protection offered by the conversion layer in the TA and TAC samples at long exposure times, Fig. 7a-f, it can be seen that the coating resistance (R1) remained constantly low but with slightly higher values for the TA (≈ 100 Ω cm2) than for the TAC (≈ 60-80 Ω cm2) samples. This behavior was similar for R2 and R3 and it may be interpreted assuming that the initial faster zinc dissolution, due to the thin thickness of the conversion layer and low chromium content enabled to produce more compact and stable corrosion products that blocked the conversion layer defects. In addition, as the evolution of the C1, C2 and C3 values (≈ 10-4 - 10-5 F cm-2) was quite similar and constant, it was inferred that, after the significant changes occurred during the first 24 h of immersion, only minor variations of the electrochemically active areas and the overall zinc corrosion process took place during the remaining 30 days of testing.
On the other hand, the evolution of the resistive-capacitive values for the Z66, Z665 and Z666 samples as a function of the immersion time in 0.5 M Na2SO4 solution did not exhibit great differences. Perhaps the main discrepancy was that the rds of the corrosion reaction for the Z66 samples was always under activated control while for the Z665 and Z666 samples it was controlled by the mass transport process. Despite this, the R2 values were rather similar (mostly 103 - 104 Ω cm2) in these three samples. Differences found in the rds were ascribed to the fact that after the fast attack and development of zinc white corrosion products at the beginning of the exposure, the barrier effect hindering the mass transport towards the areas where the cathodic reaction happened, i.e. the (Cr(III)-based conversion layer, as well as towards the zinc substrate was more effective in the sealed than in the not sealed samples. This may be indicative that, under the present exposure conditions, a sealed conversion layer was more effective inhibiting the cathodic (oxygen reduction) than the anodic (zinc dissolution) reactions.
As seen in Fig. 8a and c, the coating (R1) and charge transfer (R2) resistance values corresponding to the Z805 samples, ≈ 50 Ω cm2 and 2.104 Ω cm2, respectively, remained almost unchanged during the immersion test. At the same time, the resistance (R3), Fig. 8e, provided by the white corrosion products deposited within and/or at the bottom of the conversion layer defects stayed very low (≈ 30 Ω cm2), but stable. With regard to the Z80 and Z806 samples, the evolution of R1 and R2 showed strong oscillations (almost three orders of magnitude) with some periods of stability, while the component R3 corresponding to the Z80 samples did not appear up to 13 days of immersion and its value was very similar to that of the Z806 samples. Besides, the R3 values for these two samples type were mostly greater than for the Z805 samples. Changes in the C1, C2, and C3 were in line with those described for their associated resistive components. Nevertheless, in order to explain differences observed in the plots illustrating the evolution of coupled RiCi components, it was also assumed that at long immersion times the resistive and capacitive components defining the physicochemical process associated to each time constant are affected by different areas [37]. In Z80 and Z805 samples, the rds was under activated control throughout the test, while in Z806 samples, the corrosion reaction was always under diffusion control. These results were interpreted as follows: despite of having the lowest coating resistance (R1) value, the best anticorrosive behavior (greater R2 values mean lower corrosion rates) shown by the Z805 samples was attributed to their higher Cr content in the conversion layer and Si content in the applied sealant. In addition, the lowest R3 values indicated that the gathered white corrosion products were not enough to delay the oxygen transport towards the cathodic areas, reason by which the rds was under active control. A similar effect probably occurred with the Z80 samples, but in this case, provoked by the presence of Co ions in the conversion layer acting as a partial inhibitor of the zinc dissolution reaction. As happened in the Z665 and Z666 samples, the rds in the Z806 samples was always under diffusion control; therefore, it is rational to assume that the same interpretation is applicable.
Conclusions
The corrosion behavior of zinc coatings subjected to Cr(III)-based passivation treatments, with and without sealing, was studied. The investigations were performed by EIS test in quiescent aerated 0.5 M Na2SO4 solution.
The analysis of the EIS data allowed providing an equivalent electrical circuit model capable of completely describe the corrosion behavior of steel/zinc/conversion layer/0.5 M Na2SO4 systems during the overall testing period considering both the micro-defects in the conversion layers and the corrosion products deposited at the bottom and/or within them. Besides, for the Cr (III) treated electrogalvanized steel the impedance data reproducibility was good.
The behavior of the Cr(III)-based conversion layer was explained by the variation of its coating resistance (R1) as a function of the immersion time. The increase in R1 indicates an increase in the amount of white corrosion products covering the micro-defects and, therefore, working as a barrier to the diffusion of oxygen and ionic species through the conversion layer. However, with further increasing immersion time, the corrosion products transport towards the bulk of the electrolyte takes place, the zinc dissolution at the bottom of the micro-defects becomes more severe and an increase of the defects amount occurs.
Consequently, R1 decreases due to the corrosion products cannot act as a diffusion barrier. As this is a cyclic process, it continues until the protection offered by the conversion layer is totally lost.
The Cr(III)-based layer acted not only as a barrier layer hindering the corrosive species transport towards the zinc substrate but also diminishing the rate of the oxygen reduction reaction in such a way that this reaction was the rate determining step of the underlying zinc corrosion.
Only in some Cr(III)-based conversion layers, the sealing treatment revealed to be effective in increasing the corrosion resistance. Thus, the here obtained experimental results indicated that such effectiveness depended not only upon the protective properties of the conversion layer without sealant, but also on the applied sealant to improve the corrosion protection offered to the zinc substrate. When this is the case, the respective conversion layer could be considered as a suitable alternative to the traditional chromating treatment.
In line with this proposal, and taking as contrast parameter the corrosion resistance values shown by all the tested samples after 30 days of immersion in 0.5 M Na2SO4 solution, the more acceptable performance was offered by the TA, Z66 (despite their initial high corrosion rates), TAC and Z805 (R2 ≈ 104 - 105 Ω cm2), while the worst corresponded to the Z80 and Z806 samples (R2 ≈ 101 - 102 Ω cm2).
The low coating resistance afforded by the new types of tested conversion layers would need further studies to improve their overall protective properties, although they are currently satisfactory for some applications. In line with this conclusion, it must be taken into account that, when long term durability is required, the conversion layer is designed as an internal component of the steel protection system and, therefore, unless the painting system fails, it seldom comes in direct contact with the environment. This implies that the corrosion protection given by the Cr(III)-based pre-treatments may still be adequate for a variety of applications, especially when the main function of the coating is to improve the adhesion of paints and organic layers. Accordingly, together with the above mentioned studies, the here characterized products also form part of the starting point to formulate proper painting systems which will be applied on pretreated electro-as well as hot dip-galvanized steel surfaces and experimentally evaluated through laboratory and field tests.
References
1. Definitions committee, Federation Society for Coatings Technology. Philadelphia; 1978. P. 177. [ Links ]
2. Bibber J. Met Finishing. 2002;100:98-102. [ Links ]
3. Gabrielli C, Keddam M, Minouflet-Laurent F, Ogle K, Perrot H. Electrochim Acta. 2003;48(8):965-976.
4. Kendig M, Bucheit R. Proceedings of Corrosion 2000, NACE; 2000 March; Orlando, USA. [ Links ]
5. Meisel W, Mohs F, Guttman HJ, Gütlich P. Corros Sci. 1983;23(5):465471.
6. Szklarska-Smialowska Z, Staehle RW. J Electrochem Soc. 1974;121(9):1146-1154. [ Links ]
7. Mayne JEO, Ridgway P. Brit. Corros J. 1974;9(3):177-180. [ Links ]
8. Von Katen G. Galvanotechnik. 1999;90(3):650-653. [ Links ]
9. Gianelos L. Plat Surf Finishing. 1979;66(5):56-60. [ Links ]
10. Bellezze T, Roventi G, Fratessi R. Surf Coat Technol. 2002;155(2-3):221230. [ Links ]
11. Zhang X, van den Bos C, Sloof WG, Terryn H, Hovestad A, de Wit JHW. Surf Eng. 2004;20:244-250.
12. Zhang X, van den Bos C, Sloof WG, Hovestad A, Terryn H, de Wit JHW. Surf Coat Technol. 2005;199(1):92-104.
13. Da Fonte Jr B, Mich MC. US Patent 4.359.345, 1982. [ Links ]
14. Tomachuk CR, Elsner CI, di Sarli AR. Mat Chem Physics. 2009;119(12):19-29. [ Links ]
15. Tomachuk CR, Elsner CI, di Sarli AR. J Coat Technol Research. 2010;7(4):493-502. [ Links ]
16. Townsend HE, Hart RG. J Electrochem Soc. 1984;131(6):1345-1348. [ Links ]
17. Boukamp A. Equivalent circuit. The Netherlands: University of Twente; 1989. Report Nº.:CT88/265/128, CT89/214/128. [ Links ]
18. Martyak NM, McCaskie JE, Harrison L. Met Finish. 1996;94:65-67. [ Links ]
19. Almeida E, Fedrizzi L, Diamantino TC. Surf Coat Technol. 1998;105(12):97-101. [ Links ]
20. Lengyel B, Baroti-Labar Zs, Kahan R. Mater Chem. 1982;7(2):183-193.
21. Pirnat A, Meszaros L, Lengyel B. ACH-Models in Chemistry. 1995;132:647-651. [ Links ]
22. Ende D, Kessler W, Oelkrug D, Fuchs R. Electrochim Acta. 1993;38(17):2577-2580. [ Links ]
23. Zeller III RL, Savinell RF. Corros Sci. 1986;26(5):389-399. [ Links ]
24. Hazan J, Coddet C. J Appl Electrochem. 1996;26(2):203-209. [ Links ]
25. Barcelo G, Sarret M, Muller C, Pregonas J. Electrochim Acta. 1998;43(12):13-20. [ Links ]
26. Fedrizzi L, Ciaghi L, Bonora PL, Fratesi R, Roventi G. J Appl Electrochem. 1992;22:247-254.
27. Zheludkevich MI, Serra R, Montemor MF, Yasakau KA, Miranda Salvado IM, Ferreira MGS. Electrochim Acta. 2005;51(2):208-217.
28. Cole KS, Cole R. J Chem Phys. 1941;9:341-351. [ Links ]
29. del Amo B, Veleva L, Di Sarli AR, Elsner CI. Prog Org Coat. 2004;50(3):179-192. [ Links ]
30. van Westing EPM, Ferrari GM, Geenen FM, de Wit JHW. Prog Org Coat. 1993;23(1):89-103. [ Links ]
31. Deflorian F, Rossi S, Fedrizzi L, Bonora PL. Prog Org Coat. 2005;52(4):271-279. [ Links ]
32. Rangel CM, Cruz LF. Corros Sci. 1992;33(9):1479-1493. [ Links ]
33. Cachet C, Wiart R. J Electroana. Chem. 1980;111(2-3):235-246; [ Links ] Cachet C, Wiart R. J Electroana. Chem. 1981;129(1-2):103-114. [ Links ]
34. Amirudin A, Thierry D. Prog Org Coat. 1995;26(1):1-28. [ Links ]
35. Abreu CM, Izquierdo M, Keddam M, Novoa XR, Takenouti H. Electrochim Acta. 1996;41(15):2405-2415.
36. Bonora PL, Deflorian F, Fedrizzi L. Electrochim Acta. 1996;41(7-8):10731082. [ Links ]
37. do Nascimento GG, Mattos OR, dos Santos JLC, Margarit ICP. J Appl Electrochem. 1999;29(3):383-392. [ Links ]
38. Turgoose S. In: Clubey BG, editor. Chemical inhibitors for corrosion control. Manchester:The Royal Society of Chemistry; 1990. [ Links ]
39. Nevison DCH. Corrosion. ASM Handbook, 9th Ed. Vol 13. ASM International, The Materials Information Society; 1987. [ Links ]
40. Duarte RG, Bastos AC, Castela AS, Ferreira MGS. Prog Org Coat. 2005;52(4):320-327. [ Links ]
41. Fratesi R, Roventi G, Giuliani G, Tomachuk CR. J Appl Electrochem. 1997;27(9):1088-1094. [ Links ]
42. Shih H, Mansfeld F. Corrosion. 1989;45(8):610-614. [ Links ]
43. Mansfeld F, Wang Y, Lin SH, Xiao H, Shih H. In: Scully JR, Silverman DC, Kending MW, editors. Electrochemical impedance, analysis and interpretation, ASTM STP 1188. Philadelphia; 1993. P. 297-312.
Acknowledgements
This research was financed by CAPES/MINCyT (Process 158/09 of Brazil and BR/08/04 of Argentina), and Comisión de Investigaciones Científicas de la Provincia de Buenos Aires (CICPBA), Consejo Nacional de Investigaciones Científicas y Técnicas (CONICET) and Universidad Nacional de La Plata of Argentina.
*Corresponding author. E-mail address: ardisarli@cidepint.gov.ar
Received 6 February 2012; accepted 30 June 2012

