


Serviços Personalizados
Journal
Artigo
 Inglês (pdf)
 Artigo em XML
 Referências do artigo
 Enviar este artigo por email
Indicadores
-
 Citado por SciELO
 -
 Acessos
Links relacionados
-
 Similares em
SciELO
Similares em
SciELO
Compartilhar

 Permalink
Portugaliae Electrochimica Acta
versão impressa ISSN 0872-1904
Port. Electrochim. Acta vol.32 no.6 Coimbra nov. 2014
https://doi.org/10.4152/pea.201406369
Electrochemical Modification of Glassy Carbon Electrode by Bismuth-chitosan Nanosheets for Electrocatalytic Reduction and Determination of Tartrazine
Karim Asadpour-Zeynali* and Mozhdeh Aleshi
Department of Analytical Chemistry, Faculty of Chemistry, University of Tabriz, Tabriz 51666 16471, Iran
Abstract
In this paper, a glassy carbon electrode is modified by Bismuth-Chitosan (Bi-Chit) nanosheets. Bismuth, that is âenvironmentally friendlier'' than mercury, is deposited on a glassy carbon electrode by electrolysis at -0.75 V vs. SCE in a stirring solution containing 0.18 mg mL-1 Bi(NO3)3, 0.05 mg mL-1 KBr and acetate buffer 0.1 M (pH=4.5) for 200 s. Furthermore, the electrode is modified by chitosan by the means of sonication of bismuth-modified glassy carbon electrode in chitosan solution for 15 minutes. Study of the field emission by scanning electron microscopy (SEM) shows the formation of Bi-Chit nanosheets on the glassy carbon electrode. The modified electrode surface is also characterized by energy dispersive X-ray analysis (EDX). In this research the Bi-Chit modified glassy carbon electrode exhibits excellent catalytic activity toward the electro-reduction of Tartrazine. The modified electrode is successfully used for determination and measurement of Tartrazine in Bisacodyle tablets and chocolates with colorful coatings.
Keywords: Bismuth-Chitosan, Nanosheet, Electrochemical modification, Tartrazine.
Introduction
Mercury film electrodes and hanging mercury film electrodes (MFE & HDME) have been used for various voltammetric determinations due to their great analytical properties [1]. These mercury electrodes show a wide negative potential window and good electrochemical behavior, e.g., low background and high hydrogen overpotential [2]. However, the considerable toxicity of mercury has led some countries to completely ban or restrict its application in analytical methods [3] and, as a result, alternative electrode materials are sought for use in electrochemistry analysis [4]. Bismuth Film Electrodes (BiFEs) have become a suitable alternative for mercury and mercury film electrodes [5]. Bismuth is an environmentally friendly and non-toxic green element [6]. The BiFEs show high sensitivity, low background, wide potential window, insensitivity to dissolved oxygen, and simple surface renewal [5,7-9]. Since BiFEs have these attractive electrochemical characteristics, a vast variety of bismuth film electrodes have been prepared by in-situ or ex-situ plating of bismuth onto substrates such as Glassy Carbon Electrode (GCE) [2,4,10], carbon paste [11] and pencil lead electrode [12].
Chitin, a naturally abundant mucopolysaccharide and the supporting material of crustaceans, insects, etc., is well known and it consists of 2-acetamido-2-deoxyb- D-glucose through a β (1 → 4) linkage. Chitosan is the N-deacetylated derivative of chitin [13]. A usual method for the synthesis of chitosan is the deacetylation of chitin using sodium hydroxide in excess as a reagent and water as a solvent. When this reaction is allowed to be completed (complete deacetylation), it yields up to 98% product.
Chitosan is the main component of the shell of shrimps, crabs and insects. Chitosan has both hydrophilic and hydrophobic groups. It has functional groups such as -NH2 and -OH [14]. The amino group in chitosan has a pKa value of about 6.5, which is the sufficient reason for its protonation in acidic to neutral solution. The above mentioned reasons prove chitosan as water soluble and a bioadhesive component, which easily binds to negatively charged surfaces. Chitosan is chemically stable and is widely used in medicine, agriculture, etc. Since chitosan has special characteristics such as biocompatibility, biodegradability, non-toxicity, adsorption properties, etc., several reports have been published about chemical modification of electrodes by chitosan [14-16]. Natural colors are replaced by synthetic ones due to their high cost and instability. Synthetic colorants are widely used with preservatives to produce the favorable and natural shade and make the visual aesthetic appearance of some foods better, and this effect is maintained during the production process and storage [17,18]. Synthetic dyes often contain azo functional groups and aromatic ring structures.
Synthetic azo dyes are mostly used due to the non-expensive production and the wide range of colors that can be produced when compared to natural ones. Nowadays since the excessive consumption of synthetic dyes can cause harmful effects on human health, the interest to find their toxicity properties has increased. Therefore, researchers have been trying to develop reliable sensitive quantitative methods for the determination of these synthetic dyes that are used widely in different productions [19].
One of the most common colorants is Tartrazine (Fig. 1).
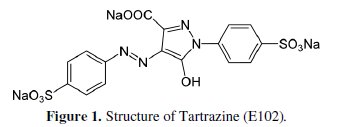
Tartrazine (C.I. 19140) or E102, is a synthetic azo dye commercially used in colorful foods, soft drinks, drugs and cosmetics [19].
Tartrazine, also known as E102 or FD&C yellow 5, is a synthetic lemon yellow azo dye and is derived from coal tar [20]. It is water soluble and principally it is the trisodium 5-hydroxy-1-(4-sulfonatophenyl) -4-(4-sulfonatophenylazo)-Hpyrazol- 3-carboxylate.
Several analytical methods have been investigated for determination of Tartrazine, including, voltammetry [16, 17], spectroscopy [18, 19], differential pulse polarography [20], high performance liquid chromatography [21,22] and electrochemical by the means of modified electrodes [23-25].
In this work, the optimum conditions for measurement of Tartrazine by bismuthchitosan modified electrode have been investigated. Then the amount of this synthetic dye is determined in tablet coatings and chocolate with colorful coatings. This method has shown to have comparable results, such as low cost and good accuracy, to standard analysis methods.
Experimental
Apparatus and software
All electrochemical experiments are performed with an Electro-Analyzer system (Sama500, Esfahan, Iran) connected with a personal computer. A three-electrode cell, containing a modified glassy carbon electrode with bismuth and chitosan, a Saturated Calomel Electrode (SCE) as reference electrode, and a platinum wire auxiliary electrode are used. All potentials in the text refer to it. The pH measurements are carried out by means of a Metrohm pH-Meter 827. The Field Emission Scanning Electron Microscopy (SEM) / Energy Dispersive X-ray Analysis (EDX) is performed using a MIRA3 TESCAN Field Emission Scanning Electron Microscope (Czech Republic) equipped with an EDX system. Data of all voltammograms were converted to EXCEL files (version7). All experiments are carried out at room temperature without removing the dissolved oxygen.
Reagents and chemicals
All chemicals used in these experiments are of analytical grade and are used without further purification. The water utilized in all studies is deionized. A stock solution of 1000 mg L-1 of KBr and bismuth (III) ion (1000 mg L-1 in 5 wt% nitric acid) are prepared. A stock solution (5 × 10⁻³ M) of Tartrazine (E102, CI19140, acid yellow 3) is prepared by weighing a suitable amount of this compound and dissolving it in deionized water. Then it is diluted to the required concentration with the same solvent. Acetic acid buffer 0.1 M and 0.3 M is prepared by measuring an appropriate amount of acetic acid and adjusting to the desired pH by sodium hydroxide. A chitosan solution is prepared by dissolving 10 mg of chitosan in 1wt. % acetic acid solution by means of sonication for about 10 min until it is completely dissolved.
Procedures
The general procedure for obtaining relevant voltammograms is as follows: into the voltammetric cell appropriate amounts of acetate buffer 0.3 M (pH=4) and Tartrazine are added in such a condition that the final concentration of Tartrazine in cell is 200 μM. The voltammograms are recorded by applying a negative going scan over the potential range from -0.4 to -0.8 V. The obtained voltammograms are used for further calculations.
Preparation of modified electrode
The glassy surface of the electrode is carefully polished with alumina powder and rinsed with deionized water. Then it is sonicated in distilled water in order to remove alumina and any other contaminants from electrode's surface. The bismuth film is deposited on the glassy carbon electrode without removing oxygen, in an acetate buffer solution 0.1 M (pH=4.5), containing 0.18 mg mL-1 Bi (III) ion by electrolysis at -0.75 V vs. SCE for 200 s while stirring the solution. After the electrode was modified with bismuth, it was rinsed with distilled water. Then the electrode is placed in chitosan solution for 15 min under a sonication system. After that, the electrode has been rinsed with distilled water to remove the excess chitosan from its surface, and then the electrode allowed to dry in air.
Results and discussion
Effect of experimental variables
In this research it has been tried to investigate the voltammetric responses of Tartrazine in different conditions of preparation of a modified electrode, such as pH range of 1-5. As pH increases in the range of 1-4, the peak current also increases in companion with the shift of Ep to positive values. At pH=4.5 the maximum reduction current and potential is seen. So pH=4.5 was chosen as the optimum pH for Bi3+ deposition on glassy carbon electrode.
The thickness of the bismuth film depends on its ion concentration and deposition time. The influence of bismuth concentration on cathodic current and potential is investigated in the range of 0.04 to 0.28 mg mL-1. As Bi3+ concentration increases, the cathodic current increases too and the potential of the peak shifts to more positive values. When Bi3+ concentration in the cell is 0.18 mg mL-1 the maximum reduction current and potential are obtained. But by increasing the Bi3+ concentration more than 0.18 mg mL-1 the current changes unexpectedly, but since the Ep shifts to more negative values, the concentration of 0.18 mg mL-1 of Bi3+ has been chosen as the optimum concentration for further experiments.
The effects of deposition potential (from -0.6 to -0.75 V) on the electrochemical behavior of the modified electrode were investigated. At the more negative deposition potentials, the peak current and potential of Tartrazine increase. But when the potential is more negative than -0.75 V, the electrode is not successfully modified. So a potential of -0.75 V vs. SCE is elected as the optimum potential.
The reduction peaks of Tartrazine are not observed while the deposition is below 100 s. The peak current and potential increase in the time interval of 100 - 200 s, while a decrease in both parameters is obtained when the pre-concentration time is more than 200 s. Therefore t =200 s is selected as the optimum time for pre- concentration step.
Characterization of the modified electrode
Field Emission Scanning Electron Microscopy is employed to characterize the top views of the Bi-Chit modified electrode and bare electrode (Fig. 2).
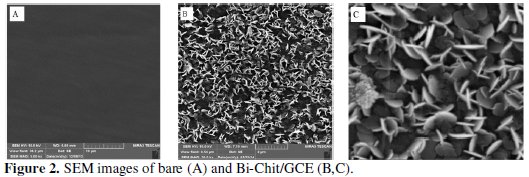
On the bare glassy carbon electrode (Fig. 2A), a completely homogenous black surface shows that the glassy carbon electrode is unmodified. While the SEM image of modified electrode indicates that (Fig. 2B,C) there is a homogenous dispersion of bismuth and chitosan particles on the electrode's surface. The thickness of the bismuth and chitosan nanosheets is below 100 nm (Fig. 2C). It can be understood from Fig. 2 that the modifiers are successfully immobilized on glassy carbon electrode's surface.
Furthermore, the EDX experiment (Fig. 3) is carried out in order to confirm the bismuth deposition on electrode's surface.
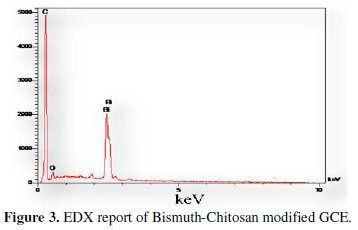
The Bi peak in this figure shows that the electrode is successfully modified by bismuth.
The cyclic voltammograms of K3Fe(CN)6-K4Fe(CN)6 at modified and unmodified electrodes have been investigated by scan rate 50 mV s-1 (the cyclic voltammograms are not shown here). DEp is decreased from 200 mV on bare glassy carbon electrode to 100 mV on Bi-Chit modified glassy carbon electrode. Also the peak currents are increased on the modified electrode. Because of the intrinsic properties of Bi-Chit modified GCE a higher response of ferrocyanide toward Bi-Chit modified is observed. It can be understood that the presence of Bi-Chit has accelerated the electron transfer.
Electrochemical behavior of Bi-Chit GCE toward electro-reduction of Tartrazine
Fig. 4 shows the differential pulse voltammograms of 200 μM Tartrazine at a bare glassy carbon electrode (a) and bismuth-chitosan modified glassy carbon electrode (b) in acetate buffer 0.3 M solution (pH= 4).
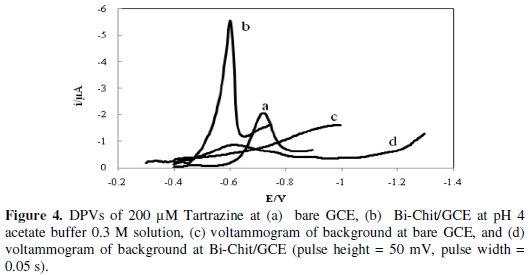
In Fig. 4, c is the background current on Bi-Chit/GCE. The small peak at -0.6 V in curve c is related to buffer reduction.
At the bare glassy carbon electrode, Tartrazine shows a reduction peak at ≃800 mV vs. SCE (Fig. 4a), but its reduction on Bi-Chit modified/GCE occurs at ≃00 mV vs. SCE along with an increase in the current of the peak. In comparison, at bare and modified electrodes, an increase in peak current and a decrease in the reduction potential of Tartrazine are obtained at Bi-Chit/GCE.
The above results indicate that the modified electrode has an excellent electrocatalytic activity toward electro-reduction of Tartrazine and can accelerate the electron transfer rate between this azo-colorant and the electrode. In the later experiments, operational conditions such as pH and scan rate, which affect the performance of the modified electrode, are optimized.
Effect of pH value
The investigation about the effect of pH on electrochemical behavior of Tartrazine is done by the means of differential pulse voltammetry technique in Britton-Robinson buffer solution 0.04 M (pH range: 4-10). Fig. 5 shows the pulse voltammograms of Tartrazine that have been recorded in different pH values.
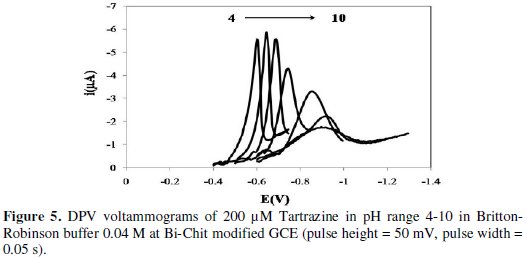
The reduction current gradually increases in the pH range of 4-6 and then decreases from 6-10.
When pH increases in the range of 4-10, the potential of the peak shifts toward more negative potentials. This indicates that the reduction process of Tartrazine is dependent on pH. On the other hand, the mechanism for the irreversible reduction of azo-colorant at the Bi-Chit/GCE electrode surface involves two steps as given in the following reactions (1) and (2) [16]:


When the pH value is below 3, reactions 1 and 2 occur at the same time, but when the pH is close to neutrality, reaction 2 does not occur. In this work, pH 4.0 is the optimum pH for sensitive determination of tartrazine; although the peak current for electro reduction of tartrazine is higher at pH=5, the peak potential has more positive value in pH=4. So, in the case of Tartrazine only step 1 occurs. Therefore the electro reduction of tartrazine is a 2 protone and 2 electron process.
Effect of scan rate
The influence of scan rate on the reduction current of Tartrazine is investigated via cyclic voltammetry technique in the range of 5-500 mV s-1. As scan rate increases, Ep shifts toward more negative values that are accompanied by an increase in ip. The peak currents of Tartrazine have a linear relationship with the square root of scan rate which indicates that a diffusion-controlled reduction process occurs at the surface of Bi-Chit/GCE: ip(mA)=0.372 v1/2 (mV s-1)1/2 + 0.547 , R2=0.996.
In order to calculate the transfer coefficient, α, and also the number of electrons participating in the rate-determining step, na, the plot of Ep versus Log (v) for the reduction of Tartrazine at Bi-Chit/GCE is drawn. For an irreversible reaction, the cathodic peak potential can be represented by this equation [26]:

where v is the scan rate, b is the Tafel slope and k is a constant value. For Tartrazine the slope at Bi-Chit/GCE is 0.058 V, therefore the Tafel slope is equaled to 0.116 V decade-1. If α is assumed to be 0.51, na is 1.
Effect of Tartrazine concentration
In order to get insight about the influence of Tartrazine concentration, the differential pulse voltammograms of Tartrazine in different concentrations have been recorded in optimum conditions acetate buffer 0.3 M pH=4 and scan rate=50 mV s-1 at Bi-Chit/GCE. The voltammograms indicate that by increasing the concentration of Tartrazine, Ep shifts to more negative potentials and the cathodic current increases. The cathodic current is dependent on Tartrazine's concentration in the range of 0 to 2.78 × 10⁻³ M (Fig. 6).
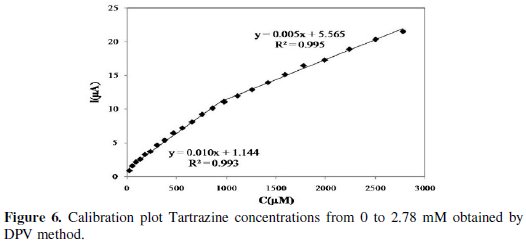
There are 2 linear segments in the ranges 2.40 × 10⁻⁵ M to 9.80 × 10⁻⁴ and 9.80 × 10⁻⁴ to 2.78 × 10⁻³ M. The two regions probably reflect the formation of a sub-mono layer in the first range of calibration curve and the formation of a monolayer in second range [27]. The detection limit that is calculated from the first region of calibration curve is 15.12 μM. Hydrodynamic amperometry is another technique that is used in this experiment in order to compare its analytical results with DPV method's results. The obtained amperograms show that by increasing the concentration of Tartrazine in a stirring solution containing acetate buffer 0.3 M (pH=4) and Tartrazine, the current increases in time range of 400 s (Fig. 7).
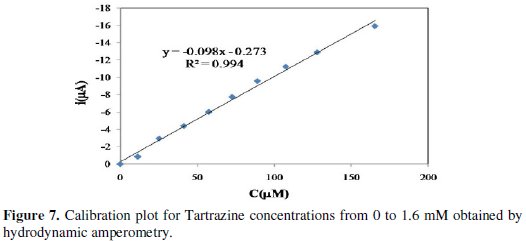
With this technique we obtained the LOD value of 10.833 μM.
Application to real samples
The linear ranges that are obtained by the bismuth-chitosan glassy carbon electrode have two orders of magnitude. The application of the bismuth-film electrode for analysis of solutions containing Tartrazine is investigated for real samples (Bisacodyle Tablets and Chocolates with colorful coatings) in order to check the method's validity. The determined concentration of Tartrazine in Bisacodyle Tablets is 0.515 mg per each Tablet and 1.13 mg per each Chocolate with yellow coating. Four additions of Tartrazine standard solution (5 mM) to both samples yield recoveries in the range of 91.125-102.00%. These data demonstrate that the components of the matrix of real sample did not interfere in the Tartrazine determination. The comparative results obtained by the standard and proposed methods are given in Table 1.
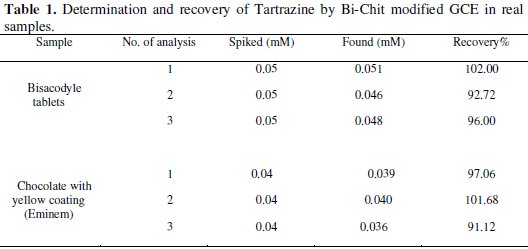
The RSD values are respectively 2.93 and 3.050% for bisacodyle tablets and chocolates with yellow coatings. The t-test is carried out in order to check the validity of the data obtained. At the 95% confidence level, both values for t value calculated are less than 4.30, the t theoretical value for the mean of three experiments which indicates that there are no significant differences between the data obtained.
Conclusions
In this work, the possibility of a Bi-Chit modified GCE for determination of Tartrazine has been investigated. This electrode is a suitable alternative for mercury electrodes since it has mercury electrodes' advantages and Bi non- toxicity. First the electrode is electrochemically modified by bismuth ions, and then a film of chitosan is coated on its surface by sonication. Since the obtained electrode indicates better electrocatalytic activity towards Tartrazine in comparison to the glassy carbon electrode, the determination and measurement of Tartrazine in food and drug samples on Bi-Chit modified GCE have been carried out. The proposed method for determination of Tartrazine is practical, inexpensive and simple. Furthermore the data that are obtained by this method are comparable to data obtained by standard methods.
References
1. Xu H, Zeng L, Huang D, et al. Food Chem. 2008;109:834. [ Links ]
2. Claux B, Vittori O. Electroanalysis. 2007;19:2243. [ Links ]
3. Gustafsson E. Water Air Soil Poll. 1995;80:99. [ Links ]
4. Kefala G, Economou A, Voulgaropoulos A. Analyst. 2004;129:1082. [ Links ]
5. Wang J, Lu J, Hocevar SB, et al. Anal Chem. 2000;72:3218. [ Links ]
6. Yuane W, Dawei P, Xinmin L, et al. Chin J Chem. 2009;27:2385. [ Links ]
7. Krolicka A, Pauliukaite R, Svancara I, et al. Electrochem Commun. 2002;4:193. [ Links ]
8. Morfobos M, Economou A, Voulgaropoulos A. Anal Chim Acta. 2004;519:57. [ Links ]
9. Economou A, Voulgaropoulos A. Talanta. 2007;71:758. [ Links ]
10. Nigovic B, Simunic B, Hocevar S. Electrochim Acta. 2009;54:5678. [ Links ]
11. Baldrianova L, Svancara I, Sotiropoulos S. Anal Chim Acta. 2007;599:249. [ Links ]
12. Asadpour-zeynali K, Najafi-marandi P. Electroanalysis. 2011;23:2241. [ Links ]
13. Kumar M N V R. React Funct Polym. 2000;46:1. [ Links ]
14. Ye X, Yang Q, Wang Y, et al. Talanta. 1998;47:1099. [ Links ]
15. Luo X L, Xu J J, Wang J L, et al. Chem Commun. 2005;160:2169. [ Links ]
16. Asadpour-Zeynali K, Mollarasouli F. Cent Eur J Chem. 2014;12:711. [ Links ]
17. Gomez M, Arancibia V, Rojas C, et al. Int J Electrochem Sci. 2012;7:7493. [ Links ]
18. El-Sheikh AH, Al-Degs YS. Dyes Pigments. 2013;97:330. [ Links ]
19. Altinoz S, Toptan S. J Food Compos Anal. 2002;15:667. [ Links ]
20. Lopez-de-Alba P L, Lopez-Martinez L, De-LeoRodriguez L M. Electroanalysis. 2002;14:197. [ Links ]
21. Vachirapatama N, Mahajaroensiri J, Visessanguan W. J Food Drug Anal. 2008;16:77. [ Links ]
22. Garcia-Falcon M S, Simal-Gara J. Food Control. 2005;16:293. [ Links ]
23. Ghoreishi S M, Behpour M, Golestaneh M. Anal Methods. 2011;3:2842. [ Links ]
24. Song Y Z, Xu J M, Lv J S, et al. Indian J Chem Sect A. 2010;49:1030. [ Links ]
25. Ghoreishi S M, Behpour M, Golestaneh M. Food Chem. 2012;132:637. [ Links ]
26. Bard A J, Faulkner L R. Electrochemical Methods, Fundamentals and Applications. New York: Wiley; 1980. [ Links ]
27. Ghalkhania M, Shahrokhian S, Ghorbani-Bidkorbeh F. Talanta. 2009;80:31. [ Links ]
Acknowledgement
The authors would like to thank the University of Tabriz for financial support.
*Corresponding author. E-mail address: asadpour@tabrizu.ac.ir
Received 8 December 2014; accepted 22 December 2014

