


Serviços Personalizados
Journal
Artigo
 Inglês (pdf)
 Artigo em XML
 Referências do artigo
 Enviar este artigo por email
Indicadores
-
 Citado por SciELO
 -
 Acessos
Links relacionados
-
 Similares em
SciELO
Similares em
SciELO
Compartilhar

 Permalink
Portugaliae Electrochimica Acta
versão impressa ISSN 0872-1904
Port. Electrochim. Acta vol.33 no.5 Coimbra set. 2015
https://doi.org/10.4152/pea.201505275
Kinetic Study of the Discoloration of the Food Colorant E131 by K2S2O8 and KIO3
H. A. Naser Elddinea , Z. K. Damaja , O. A. Yazbecka , M. A. Tabbarab and M. M. El Jamala,*
a Inorganic and Organometallic Coordination Chemistry Laboratory LCIO, Faculty of Sciences (I), Lebanese University, El Hadath, Lebanon.
b Lebanese University, Faculty of Engineering (III), El Hadath, Lebanon.
Abstract
The discoloration of the food colorant E131 (Patent Blue V) by K2S2O8 and KIO3 was investigated by spectrophotometric method. The discoloration is first order with respect to the food colorant and the oxidants. The discoloration rate constant increases with the increase in initial concentration of the oxidant and temperature; whereas discoloration decreases with the increase in concentration of E131 and chloride ion. In the presence of persulfate, Cu(II) and Fe(II) have a catalytic effect on discoloration but Ni(II) has not. The thermodynamic parameters (Ea, ΔH#, ΔS#, ΔG#) of the discoloration in the presence and absence of Cu(II) and Fe(II) are calculated.
Keywords: Commercial E131, K2S2O8, KIO3, discoloration, advanced oxidation, kinetic.
Introduction
The food industry is growing very fast around the world, and the high competition between the sectors pushes the factories to improve their products and to make them more attractive for consumption. Consequently, there is a frequent use of synthetic dyes to achieve desired goals [1] because the color of the food influences the consumer's likes.
With regard to the production of commercially prepared foodstuffs (beverages, candies, ice-cream, etc.) a number of studies have focused on the use of additives, particularly food colorings [2], and their influence on humans [3] and the environment [4]. For example, Patent Blue V (E131) was banned in Australia and US (but permitted in EU), because health officials in these countries suspect that it may cause allergic reactions, with symptoms ranging from itching and nettle rash to nausea and hypotension.
Synthetic food dyes are most widely composed of aromatic rings and auxochrome groups (e.g., azo (E102, E123), anthraquinone (E127), triphenylmethane (E131, E133)), and present high stability and xenobiotic characteristics. Such dyes produce adverse effects on the environment because they are not easily degraded by conventional biological treatment processes (nonbiodegradable) [5, 6]. Waste minimization represents an environment friendly solution to pollution problems that threaten the ecosystems. To purify dye from wastewater, a number of methods, such as biodegradation [7], photocatalytic degradation [8, 9], electrochemical treatment [10, 11] electrocoagulation [12] and advanced oxidation [13, 14] have been investigated.
Advanced Oxidation Processes (AOPs) have emerged as an important class of technologies for mineralizing of a wide range of organic contaminants by accelerating their oxidation, and hence ease of removal from polluted water [15]. The advanced oxidation methods involve in situ generation of highly potent chemical oxidants, such as the hydroxyl radical (OH*) and sulfate radical (SO4*-), using oxidizing agents like persulfate [13, 16, 17]. KBrO3 [18], KIO4 [19], O3 [20], Fenton's reagent [21], and H2O2 [22] are also used.
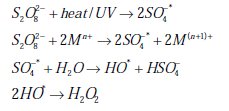
Potassium persulfate (KSP) is one of the strongest oxidants known in aqueous solution and has a higher potential (E0 of S2O82- / SO42- = 2.01 V) than H2O2 (E0 of H2O2 / H2O = 1.76 V) [23]. It offers some advantages over other oxidants as a solid chemical at ambient temperature with ease of storage and transport, high stability, high aqueous solubility and relatively low cost [17]. It has immense capability for degrading numerous non-biodegradable organic contaminants through free radicals (SO4*- and OH*) generated in the persulfate system [24]. Thermal activation [25], activation by transition metal catalysis [26, 27], base activation [28] and UV-irradiation [29] have been used to generate a sulfate radical, an even stronger oxidant (E0 = 2.5-3.1 V) [30] than persulfate. The formation of sulfate free radicals can be catalyzed by metal ions. These sulfate radicals initiate a cascade of reactions leading to formation of reactive hydroxyl radicals and intermediate oxidant (H2O2) as in the following reactions:
All oxidizing agents and radicals potentially coexist and any one may be responsible for oxidation of the organic contaminant, and either radical may predominate over the other depending on the pH.
Patent Blue V (E131), also called Food Blue 5, is a dark bluish synthetic triphenylmethane class dye (Fig. 1).
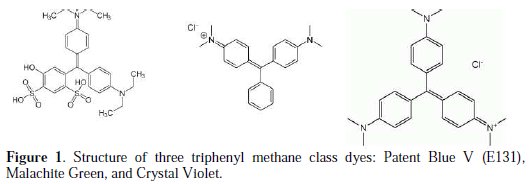
It is structurally very similar to other triphenylmethane class dyes as Crystal Violet (CV), which has three alkylamino groups on all three phenyl rings, and Malachite Green (MG) which has two alkylamino groups substituted on the two phenyl rings.
The purpose of this work is to investigate the parameters that influence the discoloration (and perhaps the degradation) of commercial E131 by potassium persulfate (K2S2O8) and potassium iodate (KIO3). The parameters studied are the concentration of the food colorant, the concentration of the oxidant, pH, temperature, and the catalytic effect of some metallic ions and other ions.
Experimental
A commercial product of the food colorant E131 (CI 42045) is used as purchased from local society (C27H32N2O7S2Na, purity: 10 %, MW: 582.67 g) (Fig. 1). The impurities are organic and inorganic compounds. The inorganic compound is mainly Na2SO4 [31], as confirmed by ionic chromatography and XR analysis. The other chemical reagents used were of analytical grade.
Diluted solutions of commercial E131 (20 to 100 mg L-1) were prepared from an initial solution (1 g.L-1) in order to draw the calibration curve and verify if the commercial product obeys Beer's law. The kinetic study of the discoloration of E131 by persulfate was carried out on a double beam spectrophotometer, Specord 200 (Analytical Jena). Salt solutions of 1 M KCl were prepared to study the effect of the ionic force on the discoloration rate constant.
Transition metal solutions (0.1 M) of Ni(NO3)2, CuSO4, and Fe(NH4)2(SO4)2.6H2O, were also prepared to find which metal ion can catalyze the discoloration reaction.
To determine the order of the reaction with respect to E131, the kinetic study was carried out in the presence of a large excess of persulfate (or KIO3). On the other hand, the order with respect to persulfate (or KIO3) was determined in the presence of different excess amounts of the oxidant, while the other parameters were kept constant. For the determination of the pseudo order with respect to E131 and the effect of its initial concentration, the reaction mixture was obtained as follows: x mL of 400 mg L-1 of the commercial colorant E131 (3 ≤ x mL ≤ 10) (∼40 mg.L-1 of pure E131) was added to a mixture of 10 mL of 0.1 M persulfate and (10-x) mL of H2O. For the determination of the pseudo order with respect to persulfate (or 0.1 M KIO3): x mL of 0.1 M persulfate (3 ≤ x mL ≤ 10) were added to 10 ml of E131 200 mg.L-1 and (10-x) mL of H2O (total volume 20 mL). Quickly after the addition of the reactants, the UV visible spectrum of the solution was recorded at a predetermined time until the absorbance at λmax becomes less than 0.1. The rate expression for the discoloration reaction is:

where k is the rate constant of the reaction, m and n are the pseudo orders of the reaction with respect to E131 and K2S2O8 (or KIO3), respectively. The absorbance (A) at λmax (290 and 616 nm) is proportional to the concentration of E131; thus, the slope of the function A or lnA vs. time, defined as kobs at λmax, will be equivalent to the discoloration rate constant kapp.
The effect of pH on the discoloration rate was studied by replacing water by diluted solutions of H2SO4 (10-4 M to 0.1 M). The effects of salt, and transition metal, on the rate constant were carried out at several concentrations of the mentioned salts, while keeping the other reactants concentration constant.
Results and discussion
A-Reaction with potassium persulfate (KPS)
The UV-visible absorption spectra
In order to investigate the change in the molecule of the commercial food colorant E131 with reaction time, UV-visible absorption spectra changes in the dye solution were observed and the corresponding spectra are shown in Fig. 2.
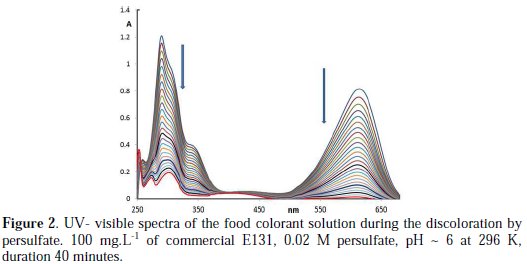
It can be seen that there are two main characteristic absorption bands of commercial E131 solution, at 290 and 616 nm (Fig. 2). There are also two shoulder bands in the UV region at 254 and 340 nm, which are not as intense as the other two. The relation found between the absorbance A616 and the mass concentration of the commercial food colorant is A616 = 8.6×10⁻³ × [E131] (mg.L-1), with R2: 0.997. Another relation is obtained at 290 nm, A290 = 9.2×10⁻³ × [E131] (mg.L-1), with R2: 0.986.
The discoloration is faster with the increase in potassium persulfate (KPS) concentration. The blue solution of E131 turns greenish blue with time, and then at the end turns into a pale yellow color, which disappears very slowly with time. The photo-catalytic degradation of E131 by supported TiO2 leads to phenol and other byproducts [9]. During the UV/K2S2O8 treatment system, absorption intensity of E131 in solution became weaker along with the reaction time, and the whole spectrum in the UV-visible decreases with time (Fig. 2). The decrease in the absorbance in the visible band may reasonably be due to the elimination of the auxochromes diethylamino and/or hydroxyl, and the decrease in the absorbance in the UV regions may possibly be due to the breakdown of the chromophore (aromatic rings). Since the decrease in A290 nm is ∼ similar to that at A616 nm, then the two conceivable steps will have to occur simultaneously. Another credible explanation for the decrease in the whole spectrum is the formation of a leuco form of E131 as was the case with Methylene Blue [32] and pH discoloration of Malachite Green (MG) [33].
TOC/UV-visible spectral analysis and proposed mechanism
The TC value of persulfate solution (10-1 M to 10-2 M) is ∼ 0. The TOC analysis of the commercial food colorant showed the absence of inorganic carbon. The TOC values before and after treatment of the 10 mL of 400 mg.L-1 of the commercial product with 10 mL of 0.1 M persulfate are ∼ constants (20-22 against 18-20). Generally low reduction in TOC analysis (< 10%) is within the error range, and unfortunately does not support hypothesis of mineralization of E131 by KPS.
Due to structural similarity to CV and MG, we initially anticipated UV-visible spectral results of discoloration of E131 by KSP to be either analogous to Crystal Violet (CV) where a decrease in the absorption band in one region is accompanied by an increase of absorbance in another, with a clear isobestic point of the overlay of spectra [13]; or analogous to MG, where claims of partial degradation (such as N-demethylation, deamination or removal of a benzene ring) by KPS are supported by LC-ESI-MS analysis. [16]. However, the low reduction in TOC values and the fact that there are no new absorbance peaks in the UV-visible spectra or an isobestic point, forfeit the claims of even partial degradation of E131 by KSP. So, in this study there is only evidence to support the second hypothesis, that is, the discoloration of E131 by KPS is due to the formation of leuco form of E131 (as shown in Scheme 1 and Scheme 2). Two mechanisms are proposed.
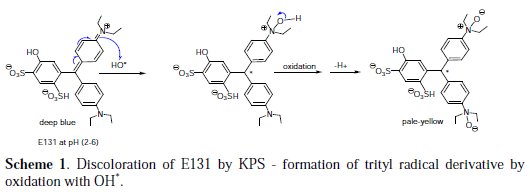
The first oxidation mechanism involves the formation of a triphenylmethyl radical derivative by the reaction of E131 with the oxidant OH* (Scheme 1). Solutions containing the trityl radical are yellow. Hydroxide radical can oxidize the quaternary imine to the amine-N-oxide as shown in the mechanism in Scheme 1. The trityl radical, in this case, will not be able to dimerize to the quinoid type dimmer because all para positions of the aromatic ring are occupied, and thus the yellow radical will persist with time, at least until it reacts with another hydroxide radical in solution.
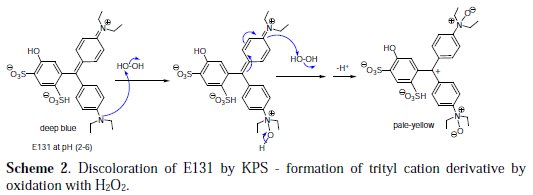
Instead of the trityl radical, formation of a trityl cation may also take place. Oxidants like H2O2 can readily oxidize the free tertiary diethylamine to the amine-N-oxide, as shown in Scheme 2. Further oxidation of the second tertiary amine, after breaking the resonance with the aryl group, will produce the pale- yellow derivative of triphenylmethyl cation (trityl cation).
The hydroxyl group (electron donating by resonance) being in the meta position relative to the cation will not contribute to its stability, and neither will the sulfonate group (withdrawing group), ortho and para to it. This cation, though stabilized by aromatic resonance, is very reactive toward nucleophiles, and will react in the solution even with water. In intermediate pH, complete discoloration by nucleophilic attack of water may well occur but it is very slow.
Upon treatment of the oxidized form of E131with a base, OH-, the solutions turns blue again (Scheme 3), but with bathochromic shift in wavelength: 265 nm, 368 nm, 640 nm.
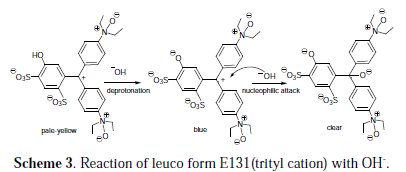
This solution turns clear in basic medium, and complete discoloration is achieved in a short period of time. We propose the alkaline medium to first deprotonate the aryl alcohol group (pKa ≈ 9-10), followed by nucleophilic attack of hydroxide ion (OH-) on the electrophilic trityl cation, as shown in Scheme 3.
Formation of a triphenyl methanol derivative, a nonresonant carbinol, will disrupt the conjugation between the aromatic rings and result in a colorless compound. The alcohol group of triphenyl methanol has the same pKa value as aliphatic alcohols (pKa 16-19) and will not be deprotonated under our conditions.
The preliminary study of HPLC of commercial solution of E131 before and after treatment with KSP, showed two peaks at 2.5 and 22.5 min (at 254 and 290 nm). The peak at 22.5 min (more intense) corresponds to pure E131. No new peak is observed after treatment, there is only reduction in the area peak at 22.5 min. The preliminary study confirmed the 2nd hypothesis.
Order with respect to E131
From the plots of A, ln A and 1/A at 616 nm or 290 nm vs. time (as shown in Fig. 3), it may be concluded that the best pseudo order with respect to the food colorant is one (according to the R2 value).
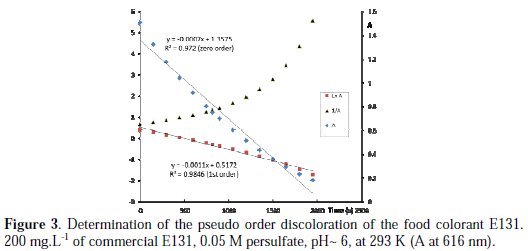
For all the experiments concerning the determination of the order with respect to E131, there is competition between order zero and one, but, for most of the experiments, the correlation coefficient (R2) is closer to 1 when first order is assumed (order two was rejected, since R2 < 0.7). Similar order is observed with MG, but differs from CV [13].
Effect of the food colorant concentration
The rate constant decreases linearly with the increase in concentration of E131 (as illustrated in Fig. 4).
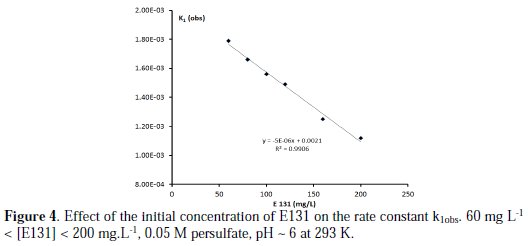
The rate of discoloration increases with the decrease in the number of species to be oxidized. The same results were obtained with the systems malachite green/persulfate [13]. A Michaelis-Menten plot of 1/kobs versus 1/[persulfate] gave a straight line with no intercept, this suggests that there was no intermediate complex formation [19].
Order with respect to persulfate
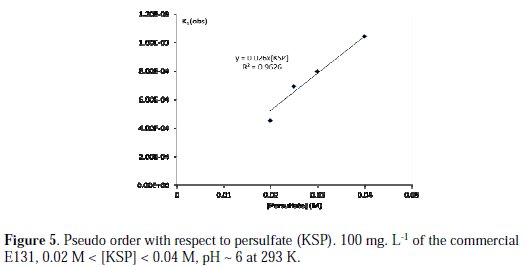
The pseudo order with respect to persulfate is determined by keeping the concentration of the food colorant constant and varying the concentration of persulfate in the medium. On increasing the concentration of persulfate, more reactive radicals (and also oxidizing agents) could be generated and the rate of E131 discoloration would become faster. Similar trend was observed in the discoloration of MG and CV with persulfate [13, 16]. The pseudo order with respect to persulfate is one since there is linear relation between the observed rate constant (kobs) and the concentration of persulfate, as seen in Fig. 5 (kapp =k[S2O82-]n, n= 1, k= 0.026, R2: 0.96).
Effect of initial pH
It is known that pure E131 is a useful color indicator for H+ concentration in very acidic medium range 0.8-3 [34]. It is notably the protonation/deprotonation of the two sulfonic acid groups, the alcohol group (9 < pKa < 10), and the charge on tertiary alkylamine (pKa ≤ 5) which dictate its color changes. The zone of pH undertaken for this study was limited to a range where the blue color of E131 and the general shape of the UV visible spectrum remain the same in the chosen range of pH.
The pH is an important parameter in the oxidation reaction. It is well accepted that with persulfate oxidation, the formation of sulfate free radicals can be catalyzed by protons as follow [35]: S2O82- + H+ → HS2O8- → HSO4- + SO4-*.
According to these equations, catalysis is expected at lower pH. The effect of pH was undertaken at several initial pH (1 to 6) by adding different concentrations of H2SO4. The results show that the rate constant increases slightly with the increase in pH (Fig. 6).
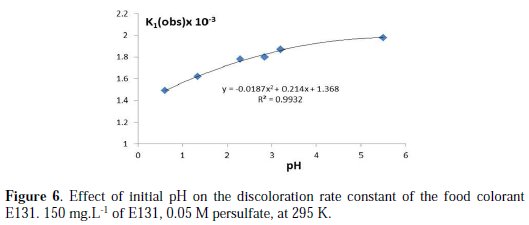
The pH profile for discoloration seems to be hyperbolic having a maximum at near neutral pH.
This behavior is in contradiction with the expectation, and incomparable with the results with CV and MG [13]. Nonetheless, the repetition of the experiments and the use of H3PO4 and phosphate salt to vary the initial pH confirmed the rate constant increase at higher pH.
Matrix effect
Salt effect
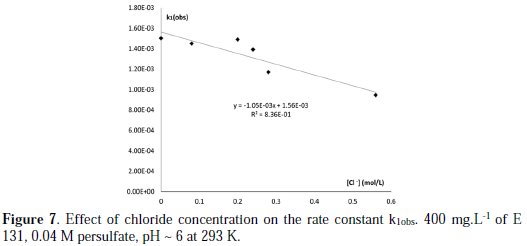
The high redox potential of sulfate free radical makes it very reactive in destroying organic contaminants. However, parallel reactions with other species, could result in scavenging of sulfate radical and could possibly limit its oxidation efficiency. Competition for sulfate radical could be from water constituents such as chloride ions, carbonate and phosphate [30]. The commercial compound already contains Na2SO4, as confirmed by XRD (2.77 Ao (100%), 4.64 Ao (80%), FTIR (1121, 637, 615 cm-1) and Ionic GC analysis. The effect of this parameter was studied only in the presence of KCl. The discoloration rate of E131 is hardly affected by very low concentration of chloride, but it is quickly reduced with the increase in chloride concentration (Fig. 7).
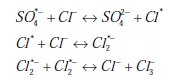
It is known that SO4*- can directly oxidize Cl- via electron transfer reactions to produce less-active species [36]. The equations below show the chemical reaction mechanism of persulfate with chloride in aqueous solutions:
There is not a linear relationship between kobs and √I, and thus the effect is beyond primary kinetic salt effect and ionic strength. The decrease in discoloration rate is then most likely due to Cl- ion scavenging and competing with the E131 for SO4*- and because chloride and chlorine radicals are poorer oxidants than sulfate the radical. Similar decrease in rate of discoloration of MG has been observed.
Metal activation
The chemical oxidation of organic pollutants by persulfate can be accelerated by metal ion activation (Cu(II) and Fe(II)), through enhancing sulfate radical generation [37]. The addition of Ni(II) increases a little the discoloration rate constant, whereas the ions Cu(II) and Fe(II) accelerate it considerably (Fig. 8 and Fig. 9).
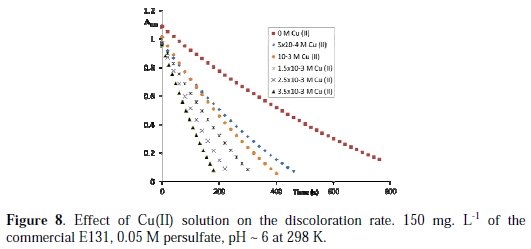
For the same concentration of metal ion, Fe(II) decolorizes the mixture (E131 + KSP) faster than Cu(II).
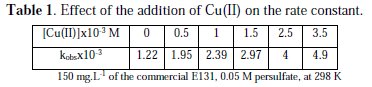
The rate constant increases linearly with the increase in Cu(II) concentration in accord to the equation kobs= 1.04×[Cu(II)] + 1.35×10⁻³ (R2: 0.996) (Table 1).
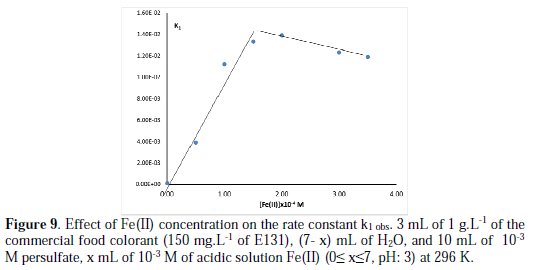
The discoloration behavior of E131 in presence of Fe(II) is somehow special. In the presence of 0.05 M of persulfate, the addition of 1 mL of 0.01 M Fe(II) ([Fe(II)]f = 5×10⁻⁴ M), the blue color disappears just after mixing. The fast discoloration remains even with lower concentration of Fe(II) (10-3 M). In this case, to study the effect of Fe(II) by spectrophotometry, lower initial concentrations of Fe(II) and persulfate (10-3 M for both) are used. In the conditions of the experiment, the rate constant increases first with the increase in Fe(II) concentration (10-4 to 1.4×10⁻³) to reach a maximum, then it decreases little with the increase of Fe(II) concentration (Fig. 9).
The increase in Fe(II) concentration up to 1.5x10⁻⁴ M, increases the rate of production of sulfate radical and therefore the discoloration rate of E131 [30]. At higher concentration of Fe(II), the small decrease in the rate constant can be attributed to the scavenging effect of the sulfate radial by the metal Fe(II) + SO4*- → Fe(III ) + SO42- [13].
Effect of temperature
The increase in temperature from 296 K to 318 K increases the discoloration rate of E131. In the presence of Fe(II) and in its absence, the activation parameters associated with the discoloration are calculated according to Arrhenius and Eyring equations (Table 2) [13].
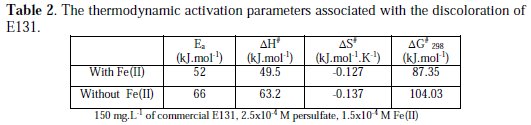
The reaction conditions in the presence or absence of the metal were kept the same. The effect of temperature was also conducted with Cu(II) with higher concentration of persulfate (Table 3).
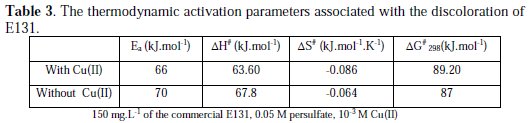
The decrease in the activation energy in the presence of Cu(II) and Fe(II) as relative to that in the absence of these metallic ions proves their catalytic effect.
B -Reaction with KIO3
The order with respect to the food colorant and KIO3 is one for both reactants. No intermediate complex is formed during the discoloration as verified by the plot of 1/kobs vs. [KIO3]-1. The discoloration rate decreases linearly with the increase of the concentration of commercial E131 (kobs: -5×10⁻⁵ × [E131] (mg.L-1) + 1.54×10⁻², R2: 0.992). There is no reaction between KIO3 and E131 at neutral pH, but in very acidic medium the reaction becomes faster (because the oxidant power of KIO3 decreases with pH). For pH < 1, the rate constant decreases linearly with pH (kobs: -5.93×10⁻³ × pH + 6.56×10⁻³, R2: 0.94). The addition of KCl, Ni(II) and Cu(II) has negligible effect on the rate constant, whereas the addition of Fe(II) decreases the discoloration rate due to the redox reaction between Fe(II) and KIO3 (formation of I2 and Fe(III)). The addition of Na2SO4 decreases linearly the rate constant as follows: kobs =-6.49 × [Sulfate ] + 4.18 , R2: 0.994. In the presence of 0.3 M of sulfate, the rate constant is reduced by half. The discoloration rate constant increases with the temperature: Ln(kobs) = 6650/T(K) + 16.4 , R2: 0.995. The thermodynamic parameters are Ea: 55.2 kJ.moL-1 , ΔH#:52.54 kJ.mol-1 , ΔS#:-0.117 kJ.mol-1.K-1, ΔG#:87.4 kJ.mol-1 at 298 K).
Conclusions
The discoloration of the commercial food colorant E131 by persulfate and KIO3 is effective. It is pseudo first order with respect to E131 and the oxidant persulfate and KIO3. The discoloration increases with the temperature, and the decrease in E131 concentration. There was negligible effect on the rate constant upon addition of Ni(II), and Na2SO4, but an important increase is observed after addition of Cu(II) and Fe(II). With persulfate, the rate constant increases with the increase of pH, but with KIO3 it decreases. Despite the similarity in structure, there are many distinct differences between commercial Patent Blue, Malachite Green and Crystal Violet; starting from the UV-visible spectra, the pH effect, even the salt and metal effects slightly differ. We are currently studying a purer sample of E131 in order to pinpoint and better evaluate the difference between these dyes and their discoloration rate.
References
1. Prado M A, Godoy H. Quim Nova. 2007;30:268. [ Links ]
2. Clydesdale F M, Crit Rev Food Sci Nutr.1993;33:83. [ Links ]
3. Berdick M, Hathcock J N. (ed.), Nutritional Toxicology. New York: Academic Press; 1982.
4. Greenlee W F, Osborne R, Dold K M, et al. Environ Health Perspect.1985;60:69. [ Links ]
5. Ngoc U N, Schnitzer W S E A S, Trans Environ Develop. 2008;4:313. [ Links ]
6. Pereira W S, Freire R S. J Braz Chem Soc. 2006;17:832. [ Links ]
7. Chaube P, Indurkar H, Moghe S Asiatic J Biotech Res. 2010;1:45. [ Links ]
8. Akpan U G, Hameed B H, J Haz Mat. 2009;170:520. [ Links ]
9. Barka N, Qourzal S, Assabbane A, Nounah A, et al. Chem Eng Comm. 2011;198:1233. [ Links ]
10. Santos V, Morao A, Pacheco M J, et al. J Environ Eng Manag. 2008;18:193. [ Links ]
11. Silva C P, Marmitt S, Haetinger C, et al. WSEAS Trans System. 2008;9. [ Links ]
12. Modirshalan N, Abdoli M, Behnajady M A, et al. Env Protection Eng. 2013;39:59. [ Links ]
13. Fayoumi L M A, Ezzedine M A, Akel H H, et al. Port Electrochim Acta. 2012;30:121. [ Links ]
14. Mcheik A H, El-Jamal M M. J UCTM. 2013;48:12. [ Links ]
15. Bolton J R, Bircher K G, Tumas W, et al. Pure Appl Chem. 2001;73:627. [ Links ]
16. Gokulakrishnan S, Parakh P, Prakash H. J Haz Mat. 2012;213:19. [ Links ]
17. Lin Y T, Liang C, Chen J-H. Chemosphere. 2011;82:1168. [ Links ]
18. Gemeay A H, El-Ghrabawy G R, Zaki A B. Dyes Pigments. 2007;73:90. [ Links ]
19. Idris S O, Hassan H, Iyun J F, et al. J Sci Research Rep. 2015;4:551. [ Links ]
20. Kusvuran E, Gulnaz O, Samil A, et al. J Haz Mat. 2011;186:133. [ Links ]
21. Hameed B H, Lee T W. J Haz Mat. 2009;164:468. [ Links ]
22. Edwards J C. [MSc Thesis]. Blacksburg, Virginia; 2000. [ Links ]
23. Harris D C. Quantitative Chemical Analysis. 4th ed. New York: W.H. Freeman and Company; 1995. [ Links ]
24. Huang K, Zhao Z, Hoag GE, et al. Chemosphere. 2005;61:551. [ Links ]
25. Ding Y, Zhu L, Yan J, et al. J Environ Monit. 2011;13:3057. [ Links ]
26. Anipsitakis G P, Dionysiou D D, Environ Sci Technol. 2004;38:3705. [ Links ]
27. Mushinga T, Jonnalagadda S B. Int J Chem Kinetics. 1992;24:41. [ Links ]
28. Miraglio M A. Base-Activated Persulfate Treatment of Contaminated Soils With pH Drift From Alkaline to Circumneutral [MSc thesis]. Washington State Univ;2009. [ Links ]
29. Aliouche S, Belaidi S, Djebbar K, et al. Sci Technol A. 2008;27-B:31. [ Links ]
30. Xu X-R, Li X-Z. Sep Purific Technol. 2010;72:105. [ Links ]
31. El-Hajj-Hassan M A, El-Jamal M M. EFSA J. 2013;11:2818. [ Links ]
32. El-Hajj-Hassan M A, El-Jamal M M. Port Electrochim Acta. 2012;30:351. [ Links ]
33. El-Hajj-Hassan M A, Fayoumi L M A, El-Jamal MM, J UCTM (Sofia). 2011;46:395. [ Links ]
34. Sabnis R W. Handbook of Acid-Base Indicators. CRC Press. 2008;295. [ Links ]
35. Chen X, Xue Z, Yao Y., et al., Int J of Photoenergy. 2012;754691. [ Links ]
36. Lee Y, Lo S, Kuo J, et al. Front Environ Sci Eng. 2012;6:17. [ Links ]
37. Liu C S, Shih K, Sun C X, et al. Sci Total Environ. 2012;416:507. [ Links ]
*Corresponding author. E-mail address: mjamal@ul.edu.lb
Received 24 March 2015; accepted 20 September 2015

