


Serviços Personalizados
Journal
Artigo
 Inglês (pdf)
 Artigo em XML
 Referências do artigo
 Enviar este artigo por email
Indicadores
-
 Citado por SciELO
 -
 Acessos
Links relacionados
-
 Similares em
SciELO
Similares em
SciELO
Compartilhar

 Permalink
Portugaliae Electrochimica Acta
versão impressa ISSN 0872-1904
Port. Electrochim. Acta vol.33 no.6 Coimbra nov. 2015
https://doi.org/10.4152/pea.201506353
Corrosion Inhibition: Synergistic Influence of Gluconates on Mild Steel in Different Corrosive Environments. Synergetic Interactions of Corrosion Inhibition Tendency of Two Different Gluconates on Mild Steel in Different Corrosive Environments
A.P.I. Popoolaa,b,* , O. Sannia , C.A. Lotoa,b and O.M. Popoolac
a Department of Chemical, Metallurgical and Materials Engineering, Tshwane University of Technology, Pretoria, 0001, South Africa.
b College of Science and Technology, Covenant University, Ota, Ogun State, Nigeria.
c Dept of Electrical Engineering, Tshwane University of Technology, Pretoria, 0001, South Africa.
Abstract
Susceptibility of mild steel to corrosion attack has restricted its industrial applications, despite its numerous advantageous characteristics. Comparison of the inhibitive tendency of a mixture of zinc gluconate (ZG) and ferrous gluconate (FG) on the corrosion behavior of mild steel in acid and saline media was investigated using electrochemical and weight loss techniques. The FG:ZG ratio was dosed from 0.5:0.5 to 2.0:2.0 g/v at an interval of 0.5:0.5. The surface morphology of the corroded mild steel samples was evaluated by high resolution scanning electron microscope equipped with energy dispersive spectroscopy (HR-SEM/EDS). Experimental results indicated that the combined inhibitor significantly reduced the corrosion rates of mild steel, with the maximum inhibition efficiency (IE) of 100% and 48% at 28 °C in the presence of 1.5:1.5 g/v concentrations in 3.5 % NaCl and 0.5 M H2SO4 solutions, respectively. The SEM micrographs of the inhibited samples show a clearly reduced surface degradation as opposed to the surface morphology without inhibitor. Potentiodynamic polarization curves studies showed that the combined inhibitor is a mixed type inhibitor for mild steel corrosion in 3.5 % sodium chloride and 0.5 molar sulphuric acid solutions. From the set of experimental data it was found that the combined inhibitor reduced the corrosion rate through an adsorption process and obeyed Langmuir's adsorption isotherm in chloride medium and Freundlich adsorption isotherm in sulphuric acid medium at all concentrations and temperature studied. Good synergism exists between FG and ZG. The results obtained from potentiodynamic polarization are consistent with the results of the weight loss method. Synergistic performance of inhibitors was perfect in saline medium. From the analysis of grey relational grade model, the significant concentration ratios were indentified. The results showed the influence of synergistic FG:ZG at a concentration of 1.5 g/v on the corrosion rate of mild steel. Predicted results were found to be in good agreement with experimental results.
Keywords: Inhibition efficiency; Synergistic effect; SEM/EDS; mild steel; potentiodynamic polarization.
Introduction
Corrosion control phenomena and their prevention are inevitable major scientific issues that must be addressed daily as long far as there is an increasing need of metallic materials in all aspects of technological development [1]. Corrosion is a surface occurrence known as the attack of alloys or metals by their environment such as water, air or soil in electrochemical or chemical reactions to form more stable compounds [2]. Steel is used in large tonnages in chemical processing, marine applications, nuclear powered transportation, refining and petroleum production, oil and gas transportation, mining, metal-processing and construction equipment. Corrosion control of mild steel by both corrosion scientists and material experts is a major task [3]. Several methods are employed to prevent mild steel from corroding, such as cathodic protection, anodic protection, coating and the use of corrosion inhibitors. The use of inhibitors has been known to be one of the most effective methods for practical application [4-8]. Synergism is one of the significant effects in an inhibition process, and serves as the basis for most of the modern corrosion inhibiting formulations [9]. Reports show that zinc, sodium and calcium salts of gluconic acid could give an effective corrosion inhibition effect for mild steel immersed in near neutral environments [10-15].
Gluconate effectiveness on the cathodic oxygen reduction reaction and anodic metal dissolution reaction in neutral solutions depends on the nature of cations introduced in the solution as a gluconate salt and on the inhibitor concentration [16]. Also, electrochemical analysis showed that sodium gluconate could perform excellently as a scaling and non-toxic corrosion inhibitor for ordinary steel in simulated cooling water [17]. The tendency of calcium gluconate to reduce mild steel corrosion in simulated cooling water was demonstrated in an experimental research [10]. Sodium salt of gluconic acid was studied as a corrosion inhibitor in chloride media [18]. It is also reported that the mixture of Zn and benzimidazole could provide a good corrosion inhibition effect in 3.5% NaCl solution for mild steel [19]. In a very recent article, the inhibition behavior of methionine combined with cetylpyridinium bromide and cetrimonium bromide for copper corrosion in 0.5 molar hydrochloric acid solution has been reported [20]. The result shows that the combination of methionine with cetylpyridinium or cetrimonium bromide provides a strong synergistic inhibition effect.
In the present study, two gluconate salts, ferrous gluconate (FG) and zinc gluconate (ZG) were selected for an inhibition study on mild steel in saline and acid environments. The inhibition tendencies of the two salts have been separately studied in our previous work where promising results were presented [21-22]. The present study involves an extensive investigation of the synergistic action of a mixture of FG and ZG for a corrosion inhibition effect of mild steel on sodium chloride and sulphuric acid environments using weight loss and polarization techniques. Weight loss method gives information on the amount of material attacked by corrosion over a specified period of time and under specified operating conditions [23]. The combined effects of the two inhibitors dosed in equal proportion on the corrosion of mild steel in saline and acid environments will be studied.
Experimental
Materials
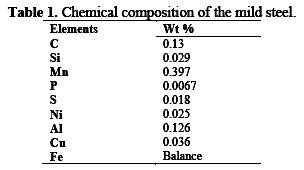
Corrosion analysis was performed on mild steel specimens with the dimension 12×12×2 mm, with a weight percentage composition shown in Table 1 for electrochemical and weight loss tests.
The specimen surface was wet-polished with different grades of silicon carbide abrasive paper (220 to 1200), rinsed with distilled water, degreased in acetone and finally dried in air.
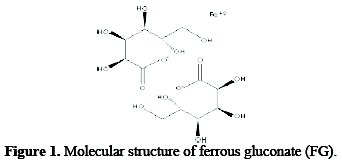
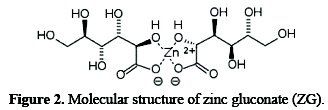
The FG (Fig. 1) and ZG (Fig. 2) test inhibitors were used as received from the supplier.
The stock solution of FG and ZG was prepared in 3.5 % NaCl and 0.5 M H2SO4 and desired concentrations were obtained by appropriate dilutions. The concentrations of the inhibitor used for the study range from 0.5:0.5 to 2.0:2.0 g/v with an interval of 0.5:0.5. Distilled water was used to prepare the solutions. The study was carried out at 28 °C.
Weight Loss Measurements (WLM)
In the weight loss tests, the cleaned mild steel samples were suspended in 200 ml of sodium chloride and sulphuric acid solutions at 28 °C. All tests were carried out in aerated solutions. The weight loss test readings were taken at an interval of 48 hours, rinsed with distilled water, degreased in acetone, dried and reweighed. The weight loss was taken as the difference between the weight at a given time and the original weight of the specimens. The measurements were carried out for the solution without inhibitor and the solution containing the FG and ZG mixture. Weight loss tests were carried out for the duration of 28 days. Weight loss, corrosion rate, degree of surface coverage (θ) and percentage inhibition efficiency (% IE) were calculated from the equation [24].
Electrochemical Studies
Electrochemical measurements were carried out in a conventional three-electrode cell of capacity 150 ml. Mild steel coupons were used as working electrode, while a platinum electrode and saturated Ag/AgCl were used as counter and reference electrodes, respectively. The potentiodynamic polarization analysis was carried out using a Potentiostat Model Reference 668, and the data were analyzed using the NOVA version 1.8 software provided by AUTOLAB. The polarization measurement was carried out from a cathodic potential of -1.5 V to an anodic potential of +1.5 V at a scan rate of 0.0016 Vs-1. The linear Tafel segments of cathodic and anodic curves were extrapolated to obtain the corrosion current density (icorr). The inhibition efficiency (IE) was obtained from the measured icorr using the relationship described elsewhere [25].
Morphology analysis
The surface morphology of the samples before and after adding an inhibitor in the medium was observed by JEOL JSM-7600F Scanning Electron Microscopy (SEM) coupled with EDS analysis.
Results and Discussion
Weight Loss Measurement
WLM result - weight loss versus exposure time in 3.5% NaCl medium
Fig. 3 shows the variation of weight loss against exposure time for mild steel coupons in sodium chloride medium with different concentrations of ferrous gluconate (FG) and zinc gluconate (ZG) mixed in the same proportion.
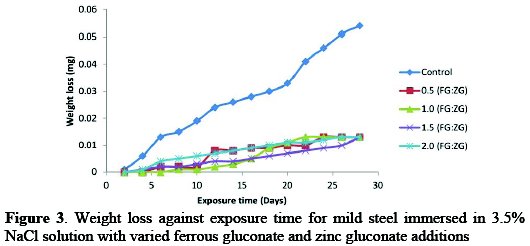
The weight loss values of the mild steel increased with an increase in the time of exposure in saline medium during the control experiment. In the presence of FG mixed with ZG in equal proportion the weight loss values varied from 0.5:0.5 g/v each to 2.0:2.0 g/v with an interval of 0.5:0.5*, and they were significantly reduced given the highest value of 0.019 gm at 0.5:0.5 inhibitor's concentration. This clearly indicates a 65% reduction in weight loss value in the presence of FG+ZG. With the synergetic effect of the inhibitors, there was a significant reduction in weight loss, with the following values after 28 days exposure time: 0.019 gm, 0.018 gm, 0.017 gm and 0.017 gm, at 0.5:0.5 g/v,1.0:1.0 g/v, 1.5:1.5 g/v and 2.0:2.0 g/v, respectively. The values translated to 65% for 0.5:0.5 g/v, 67% for 1.0:1.0 g/v, 69% for 1.5:1.5 g/v and 69% for 2.0:2.0 g/v, when the values for the inhibited samples were compared with those obtained during the control experiment, and it was also noticed that the weight loss was lower than when each one of the inhibitors was separately used [21-22].
WLM result - weight loss versus exposure time in 0.5 M H2SO4 medium
Fig. 4 shows the plot of weight loss against exposure time of mild steel coupon in acidic medium with different concentrations of FG+ZG in the same proportion.
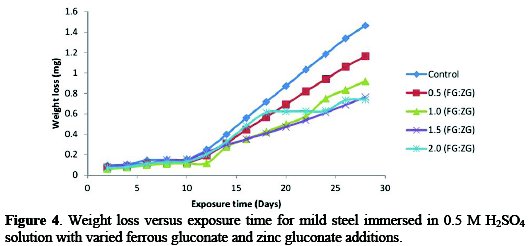
The weight loss of mild steel increased with an increase in exposure time in acid medium during control experiment.
The weight loss value at the beginning of the experiment was 0.093 gm, and increased to 1.465 gm at the end of 28 days of exposure time. In the presence of FG mixed with equal proportion of ZG, the weight loss values varied from 0.5:0.5 g/v each to 2.0:2.0 g/v*, and they were reduced, given the highest value of 1.165 gm at 0.5:0.5 g/v. This clearly indicates a 20% decrease in the weight loss value in the presence of a 0.5:0.5 g/v concentration of FG and ZG. The lowest weight loss value recorded at the end of 28 days of exposure time was 0.740 gm in the presence of 2.0:2.0 g/v concentration of inhibitor, showing a 49% decrease in the weight loss value. In the presence of the inhibitor at equal proportion, there was a significant decrease in weight loss, with the following values after 28 days exposure time: 1.165 gm, 0.920 gm, 0.764 gm and 0.740 gm at 0.5:0.5 g/v, 1.0:1.0 g/v, 1.5:1.5 g/v and 2.0:2.0 g/v inhibitor's concentrations, respectively. The values translated to 20% for 0.5:0.5 g/v, 37% for 1.0:1.0 g/v, 48% for 1.5:1.5 g/v and 49% for 2.0:2.0 g/v, when the values of inhibited samples were compared with those obtained during the control experiment.
WLM result - corrosion rate versus exposure time in 3.5% NaCl medium
The corrosion behavior of mild steel in the absence and presence of an equal proportion of FG and ZG in a saline medium was demonstrated in Fig. 5.
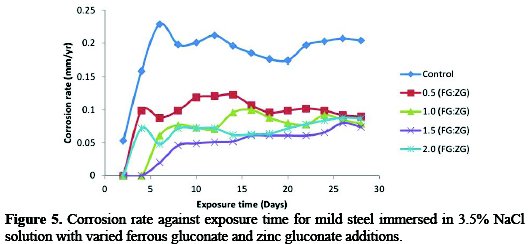
In the absence of the inhibitor, the corrosion rate value of the mild steel increased rapidly to 0.229 mm/yr at the end of 6 days of exposure time. While in the presence of a 0.5:0.5 g/v concentration of the inhibitor, there was a reduction in the corrosion rate value to 0.088 mm/yr at the end of 6 days of exposure time. After 6 days of exposure of the mild steel coupon to the corrosive environment, the graph shows a sinusoidal trend giving the final value of the corrosion rate of 0.204 mm/yr. In the presence of the inhibitor, the corrosion rate value was reduced from 0.204 mm/yr to 0.090 mm/yr at 0.5:0.5 g/v FG:ZG, 0.079 mm/yr at 1.0:1.0 g/v FG:ZG, 0.074 mm/yr at 1.5:1.5 g/v FG:ZG and 0.087 mm/yr at 2.0:2.0 g/v FG:ZG, at the end of 28 days of exposure time.
WLM result - corrosion rate versus exposure time in 0.5 M H2SO4 medium
The corrosion behaviour of mild steel in the absence and presence of different concentrations of inhibitors in an acidic medium was demonstrated in Fig. 6.
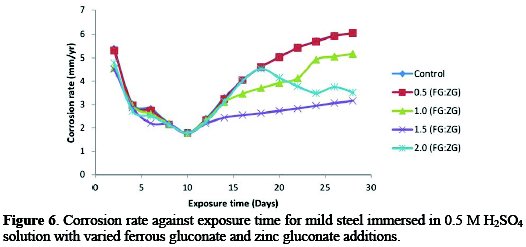
In the absence of the inhibitor, the corrosion rate of the mild steel increased with an increase in exposure time from 5.384 mm/yr to 6.058 mm/yr, after 28 days of exposure time. In the presence of inhibitor, the corrosion rate increased from 5.312 mm/yr to 6.055 mm/yr at 0.5:0.5 g/v concentration of the inhibitor, and also increased from 4.564 mm/yr to 5.170 mm/yr at 1.0:1.0 g/v FG:ZG. However, at 1.5:1.5 g/v of FG:ZG, the corrosion rate reduced from 4.515 mm/yr to 3.159 mm/yr, and also reduced at a 2.0:2.0 g/v concentration of inhibitor from 4.789 mm/yr to 3.516 mm/yr. The percentage reductions in the corrosion rate value of the mild steel in the presence of the inhibitor are 0.005% at 0.5:0.5 g/v, 15% at 1.0:1.0 g/v, 48% at 1.5:1.5 g/v and 42% at 2.0:2.0 g/v. This result shows that the inhibitor perform fairly good on the mild steel in a 0.5 M H2SO4 medium. The percentage reductions in the corrosion rate value of the mild steel in the presence of FG+ZG are 56% for 0.5:0.5 g/v, 61% for 1.0:1.0 g/v, 64% for 1.5:1.5 g/v and 57% for 2.0:2.0 g/v inhibitor's concentrations.
Inhibition efficiency versus exposure time in 3.5% NaCl medium
Shown in Fig. 7 is the curve of the variation of the inhibition efficiency (IE) with exposure time for mild steel at different concentrations of the combined inhibitor in a saline medium.
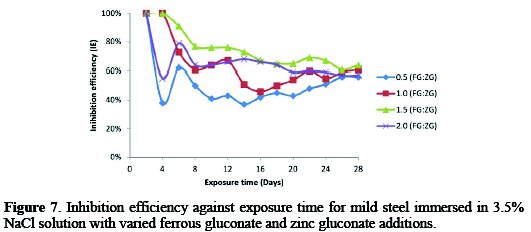
It was found that a decrease in IE occurred from 100%, depending on the concentration of the inhibitor added to the corrosive environment.
The increase in IE with an increase in the inhibitor's concentration show that more inhibitor molecules are adsorbed on the mild steel surface, leading to the formation of a protective film of the steel surface [26]. The further increase in the concentration causes a slight decrease in IE, possibly due to the dissolution of the adsorbed inhibitor film [27].The IE at 0.5:0.5 g/v concentration of FG:ZG reduced to 56%, 1.0 g/v reduced to 61%, 1.5 g/v reduced to 64% and 2.0 g/v reduced to 57%, after 28 days exposure time. It was observed that the mixture of FG+ZG increases the IE more than either FG or ZG alone, indicating a significant synergistic performance between FG and ZG. From the graph below, the optimum IE was observed at a 1.5:1.5 g/v concentration of combined inhibitor.
Inhibition efficiency versus exposure time in 0.5 M H2SO4 medium
Fig. 8 illustrates the performance of the inhibitors at 28 °C, in the presence of different concentrations of FG+ZG.
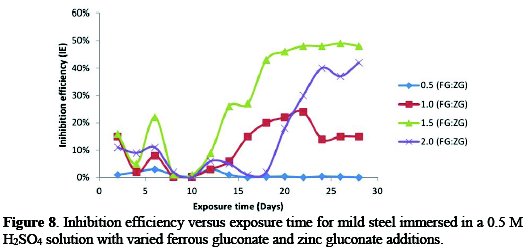
The result showed a reduction in the percentage inhibition efficiency (%IE) value, depending on the concentration of combined inhibitors added to the acidic medium. The IE at 0.5:0.5 g/v was 0.05%, 1.0:1.0 g/v was 15%, 1.5:1.5 g/v was 48% and 2.0:2.0 g/v was 42% at the end of the 28 days exposure time. The optimum inhibition efficiency was 48% at 1.5 g/v concentration of FG+ZG.
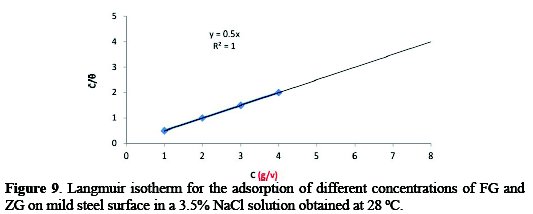
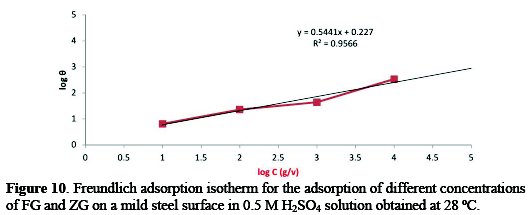
Adsorption studies
Corrosion inhibition of mild steel in the presence of combined FG+ZG has been attributed to the adsorption of these inhibitors on the steel surface, and this was generally confirmed from the fit of the experimental data to different adsorption isotherms [28]. The adsorption isotherms give useful information on the mechanism of corrosion inhibition. The adsorption isotherm explains the interaction between inhibitor molecules and the mild steel surface. The values of surface coverage (θ) at different concentrations of the combined inhibitor were calculated from the weight loss method. The data were tested graphically by fitting to different isotherms, and the Langmuir adsorption isotherm was found to provide the best description of the adsorption behavior of the synergistic effect of FG+ZG as inhibitor. Plot C/θ against C yields a straight line equal to 1. The result plotted in Fig. 9 suggests that the inhibitor in a 3.5% NaCl solution at 28 °C follows Langmuir adsorption isotherm, and that of the inhibitor in 0.5 M H2SO4 medium in Fig. 10 follow Freundlich adsorption isotherms.
Potentiodynamic polarization method
The potentiodynamic polarization measurement data for mild steel in a 3.5% sodium chloride medium is shown in Table 2, consisting of the data collected and calculated for electrochemical parameters such as corrosion potential (Ecorr), polarization resistance (Rp), corrosion current density (icorr), corrosion rate (CR), anodic and cathodicTafel slopes (βa and βc).
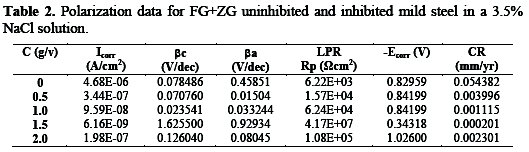
Fig. 11 shows the potentiodynamic polarization curves for the mild steel corrosion inhibition in the absence and presence of different concentrations of a combined inhibitor in a saline solution at 28 °C.
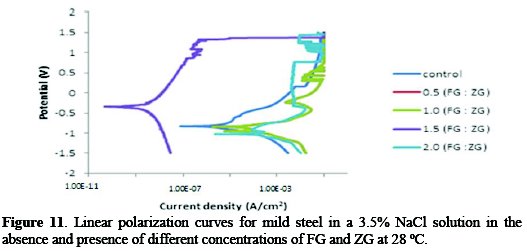
In the presence of different concentrations of FG+ZG, the corrosion current density (icorr) decreases compared to the absence of the combined inhibitor. Also, the shift in Ecorr values towards the more positive directions shows an improvement at a 1.5:1.5 g/v concentration of the FG:ZG.
From the polarization results, the corrosion rate decreased in the presence of all the studied inhibitor's concentrations. The synergistic effect of the inhibitor suppressed both anodic and cathodic reactions on the mild steel surface blocking the active sites, and no definite trend was observed in the shift of Ecorr values. Therefore, the combination of FG and ZG inhibitors can be classified as a mixed- type inhibitor.
Polarization result in a 0.5 M H2SO4 medium
Table 3 shows polarization data, which details the electrochemical corrosion kinetics parameters obtained during experiment and Fig. 12 shows the cathodic and anodic polarization curves obtained for mild steel in 0.5 M sulphuric acid solution in the absence and presence of different concentrations of FG and ZG at 28 °C.
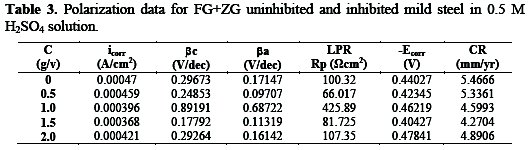
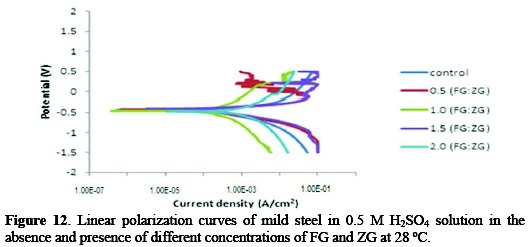
Both cathodic and anodic reactions of the mild steel corrosion were inhibited in the presence of different concentrations of the studied inhibitor. From Table 3, it can be seen that on increasing the inhibitor's concentration, the corrosion rate decreased unto a 1.5:1.5 g/v concentration of FG:ZG. Also, the corrosion current density (icorr) reduced slightly in the presence of inhibitor. Conclusions can be made that the combined inhibitor has very little effect on the corrosion reactions taking place in the acidic medium, while, on the contrary, the inhibition effect is positively significant in a saline medium.
Correlation between weight loss and electrochemical corrosion test methods
The computed data for the %IE using linear polarization resistance (LPR), potentiodynamic polarization-corrosion current density (PP-icorr), potentiodynamic polarization-corrosion rate (PP-CR) and weight loss methods (WLM) are presented in Fig. 13 and 14 for 3.5% sodium chloride and 0.5 M H2SO4 solutions at different concentrations of the studied inhibitors, respectively.
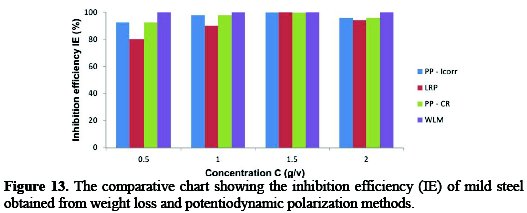
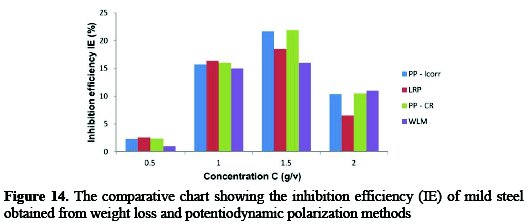
From the given graphs, it is evident that the data obtained from the different investigative methods are in good correlation with all concentrations of the studied combined inhibitor.
Scanning electron microscopy (SEM) and energy dispersive X-ray (EDX)
Investigations of Fig. 15 show (a and b) the SEM micrograph obtained for the mild steel surface after its immersion in 0.5 M H2SO4 and 3.5% NaCl for 28 days and the corresponding EDX profile analysis.
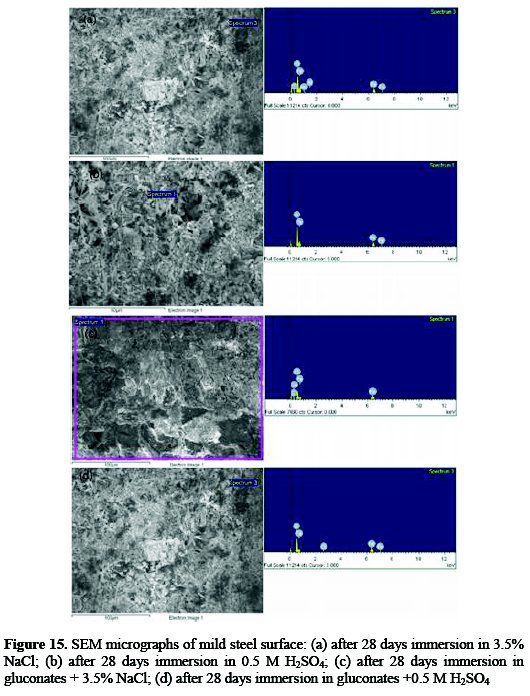
In order to investigate the effect of gluconate molecules on the mild steel surface in the presence of 0.5 M H2SO4 and 3.5% NaCl test solution, SEM micrograph and EDX profile analysis were also used for the steel surface that was immersed for 28 days in a solution containing gluconates. SEM images are shown in Fig. 15 c and d, with the corresponding EDX profile. The SEM micrograph, Fig. 15 a and b, shows that the surface of mild steel is totally corroded as a result of the aggressiveness attack of the chloride and sulfuric acid solution. Furthermore, the corrosion products appear very uneven and the surface layer is relatively rough. The EDX analysis shows that the surface has the main elements as the major constituents in addition to carbon, oxygen and sodium (3.5 % NaCl) and oxygen (0.5M H2SO4). The presence of addition constituents (C, O, and Na) on the surface of the mild steel was due to the effect of sodium chloride and sulphuric acid solutions. On the contrary, Fig. 15 c and d show that there is much less damage on the mild steel surface in the presence of an inhibitor, which further confirms the inhibition ability of the gluconate. The SEM images shown in Fig. 15 a and b confirm that the surface of the steel is completely different from the SEM image shown in Fig. 15 c and d, where the surface in Fig. 15 c is fully covered with an adsorbed layer.
The presence of the whitish substance confirms that the gluconate molecules are included in the layer present on the surface of the mild steel. The small detected amounts of Fe and O also indicate that gluconate layer is homogenously distributed on the mild steel surface. This proves that the presence of gluconate molecules within the sodium chloride and sulphuric acid solution inhibits the corrosion of the steel as a result of the adsorption of its molecules on the steel surface protecting it from being attacked.
Numerical analysis for Grey relational model
Grey relational analysis
In the grey relational analysis, experimental data, i.e. measured responses, are first normalized in the range of 0 to 1. This process is called Grey relational generation. Based on this data, Grey relational coefficients are calculated to represent the correlation between the ideal (best) and the actual normalized experimental data. Overall, Grey relational grade is determined by averaging the grey relational coefficient corresponding to selected responses. The overall quality characteristics of the multi-response process depend on the calculated grey relational grade.
Grey relational generations
In Grey relational generation, the normalized values corresponding to the smaller-the-better (SB) criterion can be expressed as
The larger-the-better criterion can also be expressed as:
where xi(k) is the normalized value after the Grey relational generation; k th min yi(k) is the smallest value of yi(k) for the response; and max yi(k) is the k th largest value of yi(k) for the response [29]. An ideal sequence is ( x0 (k)(k = 1,2,3..........5) ) for the responses.
Grey relational coefficient and Grey relational grade
The Grey relational coefficient ξi(k) can be calculated as:
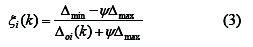
where Δoi(k) = ∥ xo(k) - xi(k) ∥ is the absolute value of the difference of xo(k) and xi(k); ψ is the distinguishing coefficient 0 ≤ ψ ≤ 1.
ψ = 0.5 is generally used.
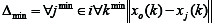 is the smallest value of Δoi; and
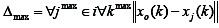 is the largest value of Δoi.
After averaging the Grey relational coefficients, the Grey relational grade γi can be computed as:
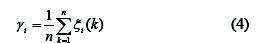
where n is the number of process responses. The higher value of Grey relational grade corresponds to an intense relational degree between the reference sequence xo(k) and the given sequence xi(k).
The reference sequence xo(k) represents the best process sequence. Therefore, a higher Grey relational grade means that the corresponding parameter combination is closer to the optimal [29]. The mean response for the Grey relational grade with its grand mean and the main effect plot of Grey relational grade are very important, because optimal process condition can be evaluated from this plot [29].
According to the experimental design, it is clearly observed from Table 4 that run order 4 with 1.5 conc. (g/v) has the highest grey relational grade.
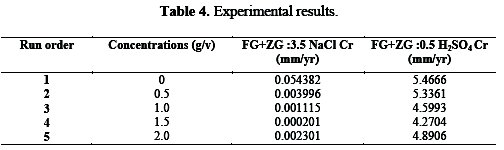
This model corresponds the experimental results. Since the experimental design is orthogonal, it is then possible to separate the effects of each concentration at different levels. The mean of the relational grade for each level of the concentration is summarized in the multi-response performance index table (Table 5).
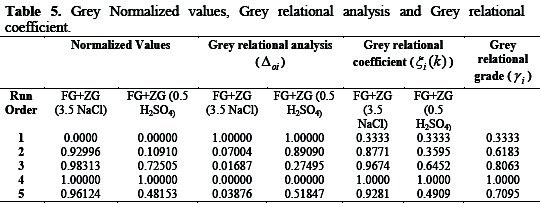
In addition, the total mean of the grey relational grade of the five experiments is also calculated, as shown in Table 5. In its turn, Fig. 16 shows the grey relational grade.
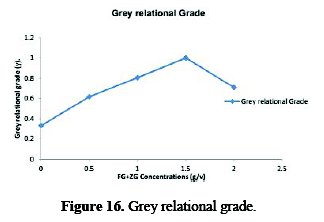
Basically, the larger the grey relational grade is, the closer will be the product quality to the ideal value. Thus, the larger grey relational grade is desired. Since the grey relational grades represented the level of correlation between the reference and comparability sequences, the larger grey relational grade means the comparability sequence exhibits a stronger correlation with the reference sequence. Therefore, the comparability sequence has a larger value of grey relational grade for the average concentration of FG+ZG.
Conclusions
The synergistic performances of the combined inhibitor (FG+ZG) on mild steel in different media were extensively studied with the following deductions:
- The combined effect of the inhibitors showed an excellent performance as a corrosion inhibitor for mild steel in 3.5% NaCl, and performed fairly in 0.5 M H2SO4 medium.
- The data obtained from weight loss measurements suggested corrosion inhibition by an adsorption mechanism and fit well to the Langmuir and Freundlick adsorption isotherms in an 3.5 % NaCl and 0.5 M H2SO4 solution, respectively, at all the concentrations and temperature studied.
- Tafel polarization curves showed that ferrous gluconate and zinc gluconate acted as a mixed type in both NaCl and H2SO4 solutions.
- 100 and 48 percent efficiency was observed in 3.5% NaCl and 0.5 M H2SO4, respectively. Therefore, combined FG+ZG should preferably be used as an inhibitor for mild steel in a saline environment at an optimum concentration of 1.5:1.5 g/v.
- The performance of multiple characteristics, i.e. concentrations of FG+ZG (3.5 NaCl) and FG+ZG (0.5 H2SO4), can be optimized by the Grey relational model. The predicted results were checked with experimental results and a good agreement was found.
References
1. Loto C A, Popoola A P I. Can J Pure Appl Sci. 2012;6:1973. [ Links ]
2. Syed S. Emirates J Eng Res. 2006;11:1. [ Links ]
3. Wang X, Wan Y, Wang Q, et al. Int J Electrochem Sci. 2013;8:2182. [ Links ]
4. Bregmann J I. Corrosion inhibitor. New York: Macmillan; 1963. [ Links ]
5. Hackermann N. Langmuir. 1987;3:922. [ Links ]
6. Nathan C C. Organic Inhibitor. Houston, TX: NACE; 1977. [ Links ]
7. Girciene O, Nauskar R, Gudaviciute R, et al. Corrosion. 2011;67:12. [ Links ]
8. Valcarce M B, Vazquez M. Electrochim Acta. 2008;53:5007. [ Links ]
9. Musa Y A, Muhamad N, Tien L, et al. Int J Electrochem Sci. 2011;6:5298. [ Links ]
10. Saremi M, Parsi N, Dehghanian C. Corrosion. 2009;65:778. [ Links ]
11. Puckorius P R, Strauss S D. Power. 1995;5:17. [ Links ]
12. Touir R, Cenoui M, El Bakri M, et al. Corrosion Sci. 2008;50:1530. [ Links ]
13. Singh I B, Venkatachari G, Balakrishnan K. J Appl Electrochem. 1994;24:179. [ Links ]
14. Mahdavian M, Naderi R. Corrosion Sci. 2011;53:1194. [ Links ]
15. Cicek V, Ozdemir M. Int J Chem. 2013;5:1916. [ Links ]
16. Lahodny-Sarc O, Kapor F, Halle R. Mater Corrosion. 2000;51:147. [ Links ]
17. Touir R, Cenoui M, El Bakri M, et al. Corrosion Sci. 2008;50:1530. [ Links ]
18. Nagiub A, Mansfeld F. Corrosion Sci. 2001;43:2147. [ Links ]
19. Mahdavian M, Attar M M. Prog Organic Coat. 2009;66:137. [ Links ]
20. Zhang D Q, Xie B, Gao LX, et al. J Appl Electrochem. 2011;41:491. [ Links ]
21. Sanni O, Loto C A, Popoola A P I. Res Chem Intermed. 2015;41:191. [ Links ]
22. Sanni O, Loto C A, Popoola A P I. Int J Electrochem Sci. 2013;8:5506. [ Links ]
23. Singley J E, Beaudet B A, Markey P H, et al. Corrosion monitoring and treatment. In: corrosion prevention and control in water treatment and supply systems. Noyes Publications; 1985. pp 3450. [ Links ]
24. Vishnudevan M. Iran J Mater Sci Eng. 2012;9. [ Links ]
25. Wang X, Wan Y, Wang Q, et al. Int J Electrochem Sci. 2013;8:2182. [ Links ]
26. Rao V S, Singhal L K. J Mater Sci. 2009;44:2327. [ Links ]
27. Zhang D Q, Gao L X, Zhou G D. J Appl Electrochem. 2005;35:1081. [ Links ]
28. Mobin M, Parveen M, Rafiquee MZA. JMEPEG. 2013;22:548. [ Links ]
29. Datta S, Bandyopadhyay A, Pal PK. Int J Adv Manufact Tech. 2008;39:1136. [ Links ]
Acknowledgements
This material is based upon work supported financially by the National Research Foundation. The authors also acknowledge the support from Tshwane University of Technology Pretoria, South Africa, which helped to accomplish this work.
*Corresponding author. E-mail address: popoolaapi@tut.ac.za
Received 20 January 2015; accepted 13 October 2015
