


Serviços Personalizados
Journal
Artigo
 Inglês (pdf)
 Artigo em XML
 Referências do artigo
 Enviar este artigo por email
Indicadores
-
 Citado por SciELO
 -
 Acessos
Links relacionados
-
 Similares em
SciELO
Similares em
SciELO
Compartilhar

 Permalink
Portugaliae Electrochimica Acta
versão impressa ISSN 0872-1904
Port. Electrochim. Acta vol.34 no.5 Coimbra set. 2016
https://doi.org/10.4152/pea.201605295
The Need for a more Comprehensive Model for the Current Transient in Anomalous Electrochemical Deposition of Metal
Alloys Exemplified by Ni-Fe Co-deposition
M. J. M. Pires*
Instituto de Ciencia e Tecnologia - Universidade Federal dos Vales do Jequitinhonha e Mucuri (UFVJM), CEP 39100-000 Diamantina, Brazil
Abstract
Measurements of the electric current as a function of time during the electrochemical deposition of metals are usually treated considering models based on the Kolmogorov- Avrami theory or alternatives to it including hierarchical overlap of diffusion zones. These models explain the main tendencies of the nucleation and growth of the metallic deposits but still do not include details related to the anomalous deposition of metallic alloys, although the electrochemical methods are widely used for their production. In this work, a discussion of the several factors involved in this issue is presented to evidence the need for a more comprehensive model that may reach a complete quantitative description of electrodeposition of alloys including the anomalous phenomenon. Cyclic voltammetry as well as chronoamperometry measurements in a sulfate solution for Ni-Fe deposition were used to exemplify several aspects to be better understood and included in the model. Some Ni-Fe films were also deposited and characterized by scanning electron microscopy and ferromagnetic resonance to discuss some additional aspects as final composition and structure.
Keywords: electrochemical deposition; anomalous co-deposition; Ni-Fe alloys.
Introduction
The electrochemical deposition of metals is employed for several purposes, from the strictly academic researches to the industrial usage. An area seen with particular interest by both the academic and industrial worlds is the manufacturing of electronic devices by electrochemical deposition of conductors. By the end of nineties, major manufactures of these devices changed from physical vapor methods of deposition to electrochemical deposition [1, 2]. Since then, another high-tech research and development field has emerged, the spintronics [3], which allies magnetic and electronic properties of miniaturized devices. In most of the cases these devices are based on thin films of metallic alloys of the iron group, and therefore can be also electrochemically produced. Despite of the vast use of the electrochemical deposition for the production of these alloys, there is still a number of issues not completely understood, as for instance details of the reactions involved in anomalous co-deposition [4-11]. Anomalous co-deposition is a common phenomenon occurring in several alloys, investigated mainly in alloys with elements of the iron group. The ''anomaly'' in this case is the preferential deposition of the less noble metal of the alloy, which incurs in relative concentrations in the deposits different from the ones in the solutions [2, 12, 13].
Along the years, several studies have been made to explain the anomalous codeposition. Focusing on aqueous electrolytes, the studied aspects involve for instance the influence of the pH of the solutions [5, 11], the species which can possibly adsorb on the electrodes surfaces as hydroxyl and other ions present in the electrolytes [7, 10, 13, 14], the hydrogen evolution reactions [1, 7], the temperature of the ''bath'' (electrolyte solution) [5, 9], the dynamics of the solution [11, 13], and so on. Naturally, the physical properties of the deposits are affected by all these aspects, in particular the magnetic properties are sensibly altered by small changes of them [1, 4, 6, 15]. Therefore the strict control of the deposition conditions is essential for the adequate production of samples and devices intended to be used in spintronics, but also in other areas, of course. The way the deposits grow, mainly when we are dealing with thin films, has also great influence on their final physical properties. The characteristics of growth cannot be separated from the aspects commented in the previous paragraph, and also here some issues are not completely understood [16-18]. The metal incorporation from the solution to the electrode is normally treated through the Erdey-Gruz and Volmer approaches, which are used as base for the studies of the nucleation of the deposits [2]. Specific models for the nucleation can include progressive and or instantaneous nucleation, two or three dimensions for each nuclei, their overlap or not, etc. A direct way to follow these aspects is through in situ high resolution microscopy (e.g., AFM and STM), but much information can be also obtained studying the transient curves, i.e., curves of current as a function of time during deposition under constant electric potentials, a far more accessible technique than in situ microscopies. The theoretical model most used to deal with transient curves is known as ''standard model'' [18, 19], which provides a description of the growth process in good agreement with the experimental results. One of the basic principles of this model is the Kolmogorov-Avrami description for metal ions incorporation but considering planar diffusion zones [18-21]. Despite of the achievements of this approach in many aspects, it carries some imprecision by assuming uniform height for all diffusion zones [18]. An improvement of this approach is obtained when the model includes Monte Carlo simulations of the growth in the case of diffusion-controlled deposition [18, 22]. Although well succeed, these models have been used in the majority of the cases for the deposition of a single metallic element. A relatively smaller number of works presents transient curves for anomalous co-deposition of alloys and rarely analyzed with the standard model or its variations [17, 6, 23].
In the present work, a study of the anomalous electrochemical deposition of Fe- Ni alloys is presented. A sulfate solution has been employed for the deposition of thin films on Au substrates. Potentiostatic current-time transient curves are analyzed in the context discussed above. In the literature there is a large number of works on electrochemical deposition of these alloys, but few addressing the transient curve in more detail. Our motivation is to discuss these issues trying to bring to light the necessity of a more comprehensive model for the transient curves of growth, including the anomalous deposition of alloys. As the magnetic properties of these alloys are among the main motivations for their use in magneto-electronic devices, a magnetic characterization is also presented.
Experimental
Fe-Ni thin films have been electrochemically deposited in aqueous solutions on Au electrodes using a conventional three electrode cell with bi-distilled water. The electrolyte solutions (''baths'') were prepared with H3BO3 (0.4 M; J. T. Backer), FeSO4.7H2O (ACROS) and NiSO4.6H2O (J. T. Backer). Two concentrations of Fe and Ni sulfates, which will be called ''high'' (hc) and ''low'' concentrations (lc), have been used: hc corresponds to FeSO4.7H2O 0.02 M and NiSO4.6H2O 0.5 M, and lc corresponds to FeSO4.7H2O 0.007 M and NiSO4.6H2O 0.2 M. The pH was maintained in 3, corrected in some cases with drops of H2SO4.
A pure Pt sheet was used as counter-electrode and Au films as working electrodes. These Au films were previously evaporated over sheets of mica cleaved immediately before the Au evaporation. The mica/Au substrates prepared in this way were flame annealed before to be immersed in the deposition solution. This kind of annealing is known to provide flat terraces on the Au surfaces which can reach hundreds of nanometers of extension [24, 25]. The electrode remained fixed during the procedures.
An AMEL General-Propose potentiostat/galvanostat (Model 2029) has been used for the measurements of transient curves, cyclic voltammograms and control of the deposition. The electric potentials were measured relative to an AMEL saturated mercury-mercurous sulfate electrode (MSE). A scan rate of 20 mV/s was used for the acquisition of the voltammograms. Before each test and deposition procedures, the solutions were submitted to N2 bubbling for about 15 minutes in order to reduce the amount of dissolved O2 gas.
In the case for which more homogeneous films were deposited with sequences of 60 s stages at constant potentials, scanning electron microscopy (SEM) and energy dispersive X-ray spectroscopy (EDX) analysis were performed with a Hitachi TM3030 microscope (15 kV). Ferromagnetic resonance was also used for the characterization of some of the samples; this analysis employed a Varian E15 resonance spectrometer (9.4 GHz). All samples have been prepared and analyzed at room temperature.
Results and discussion
Electrochemical deposition
Typical cyclic voltammograms obtained are presented in Fig. 1.
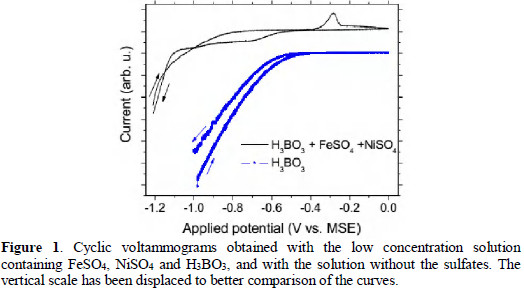
Comparing the results for the pure H3BO3 solution and the one including nickel and iron sulfates, we can see the ''peaks'' located between -1.2 and -0.5 V (MSE) are associated with the presence of the sulfates, whereas the downturn below -0.4 V (MSE) occurs also in the case without sulfates. This downturn in the curves is attributed to hydrogen evolution. In most of the cases, bubbles could be observed on the work electrode surface when the potential reached about -1 V (MSE). Hydrogen evolution is known to be concurrent with Fe and Ni electrodeposition in these conditions [7, 26], but its rate is retarded by the presence and deposition of the metallic ions [26, 27].
Formerly, boric acid has been argued to act as a selective membrane which blocks the passage for the reduction of nickel but permits the reduction of iron in a retarded rate [27]. Nevertheless, more detailed studies [26] have indicated the presence of boric acid leading to an extension of the potential range of proton discharge to more negative potentials, which provides a wider potential range for plating without hydroxide precipitation. Indeed we have obtained Fe-Ni deposits at potentiostatic conditions for the whole range between -1.2 and -0.5 V (MSE), being the more homogeneous films prepared with constant potentials of -1 V (MSE), indicating this is a deposition peak overlapped with hydrogen evolution, whereas the peak at about -0.28 V is attributed to the dissolution of the Ni-Fe deposit. The hydrogen evolution increases rapidly as the potential reaches more negative values. The results presented here do not show any effect of the boric acid or borate ions involving electrons from the external circuit since no rise of the current has been measured other than the one associated to hydrogen evolution. Such effects would be expected for potential below -1 V MSE [26].
A series of consecutive cyclic voltammograms in ranges at low potentials is presented in Fig. 2.
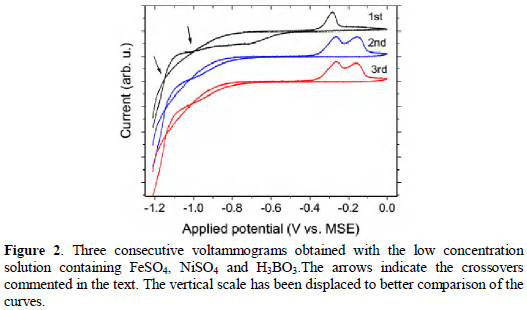
A second dissolution peak at -0.15 V appears in the second voltammogram. There are also changes in the region below -0.5 V. From the 2nd up to the 5th voltammogram there were no significant changes. Then, for this range of potentials and velocity of scans (20 mV/s), the first step of deposition is not reversible as the next step, being also an indication that a significant coverage of Au electrode has been promoted in the 1st stage and not completely removed in the cycle under the employed conditions. Furthermore, in the 1st cycle, the deposition extends along the range between -1.2 and -0.5 V MSE, while from the second on, the rise in the amount of current associated to deposition is seen only from -0.7 V (MSE) and below. The total charge associated to the deposition in the 1st cycle is significantly larger than in the next cycles, showing a maximum growth rate has occurred in the 1st cycle.
Another aspect to be noted in these voltammograms is the occurrence of crossovers between the cathodic and anodic branches approximately at -1.15 and -1.00 V (MSE), which is a common phenomenon in electrodeposition of a metal-ion on a foreign substrate [2, 6, 28-30]. The deposition potential of metal- ion on a substrate of the same metal is usually smaller than its deposition potential on substrates of distinct metals, therefore in cyclic voltammogram in which the deposit is not completely removed, there is the occurrence of crossovers. For this reason crossovers are normally considered as diagnostic for the nuclei formation on the electrode surface [2, 6, 28-30].
In the cases the potential was maintained constant around -1 V, which will be discussed later, the maxima of the nucleation rate were observed between 3 and 40 s. In the case presented in Fig. 2, the system spends 35 s between -1.2 and -0.5 V.
Typical transient curves obtained at constant potentials are presented in Fig. 3.
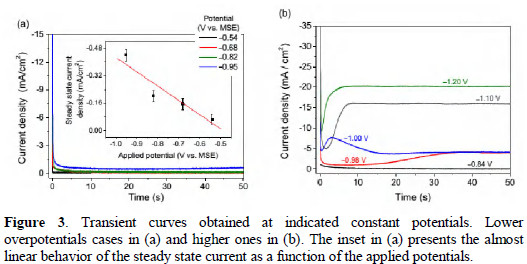
For small values of the overpotentials, the curves have similar behaviors, as can be seen in Fig. 3(a). The initial peak in the current is associated to the charging of the double-layer and fast after it there is stabilization, with the current reaching a steady state value. This ending stable current is proportional to the applied potential (see inset in Fig. 3(a)), following closely the expected behavior for small values of the overpotential [2]. For larger overpotentials, the transient curves change significantly as can be seen in Fig. 3(b). Typical current-time transient under a constant applied potential can be separated in three regions [6, 31]. The first one, immediately after the turning on of the potentials, reflects the charging of the double layer (electrode-solution interface) and is a very sharp peak. After that, the deposition starts itself by the formation and growth of spread nuclei which increases the modulus of the current up to a local maximum where overlapping of the nuclei begins. This happens because when the overlaps take place, the electroactive area of the electrode will be smaller than in the instants before. The third region usually shows a decreasing behavior tending to a stable value of current which can occurs with some oscillations or in a more smooth way. The results of Fig. 3 show this typical behavior only for the applied potentials of -0.98 and -1.00 V, being more clear for -1.00 V. For -1.10 V and -1.20 V the maximum current modulus and the steady state value are practically the same. Following the conventional interpretation, this behavior can be indicating a tendency for instantaneous layer growth [2, 6, 31].
Fig. 4 presents a comparison between the experimental transient for a Ni-Fe film deposited at a constant potential of -1.0 V (MSE) in the conditions commented above and theoretical transients following the Scharifker and Hills approach [18, 32].
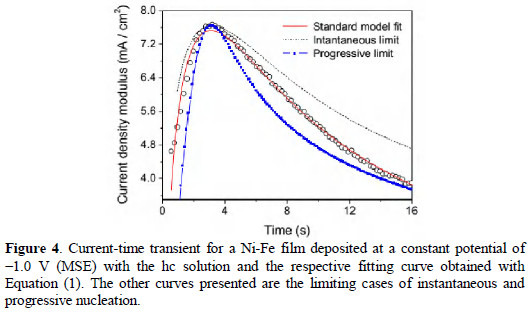
Three curves are presented for comparison, two representing the limiting cases for progressive and instantaneous nucleation and a third one, which has been fitted using Equation (1), for current density as a function of time t [18].
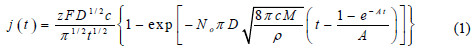
Simplified expressions for the limiting cases can be obtained using the experimental values of current and time corresponding to the maximum current, and calculating the limits when the ratio No/A tends to infinity (progressive) or to zero (instantaneous). No representing the initial number of electroactive sites per area of the electrode surface, A representing the nucleation frequency (nucleation rate constant), D the diffusion coefficient of the electrodepositing species in solution, and the product zF is the molar charge transferred. For the calculation of the limiting curves for progressive and instantaneous nucleation, the experimental values of the current density and time of point of maximum must be used.
One can see our experimental results for Ni-Fe alloy are between the expected behaviors for the limiting cases, closer to the progressive behavior after the local maximum, but before the maximum we cannot say the results are clearly closer to instantaneous or to progressive nucleation. A better agreement between model and experimental results was clearly obtained when the expression has been fitted, without taking the limits. In the fitting procedure the metal ion concentration c, and molar volume of the deposit have been maintained fixed considering the values of the real experimental concentration and the estimated molar volume for permalloy (M/ρ = 0.15 cm3/mol) [33]. The remained parameters were permitted to vary through a Levenbeg-Marquardt non-linear least squares fitting. The obtained parameters were: D = 1.0×10⁻⁵ cm2 s-1, No = 1.8×105 cm-2 and A = 11 s-1. The initial guess value for D in the fitting procedure has been 2.0×10⁻⁵ cm2 s-1, value which converted in the first step to 1.0×10⁻⁴ cm2 s-1. The behavior was similar to several initial values in the range between 10-4 cm2 s-1 and 10-6 cm2 s-1, but presents poor convergence for initial guess out of this range. Since Equation (1) includes two exponential terms and the time interval is relatively short, not reaching asymptotical values, the numerical uncertainties of the fit are relatively large, and the values obtained must be taken only as estimates for the real parameters. These values correspond to a ratio No/A of 1.6×104 cm-2 s1, which for sure is closer to the progressive than to the instantaneous growth limits [18, 23, 32].
Although the approach above provides an adequate description of the experimental observations, not only for the Ni-Fe case exemplified here, some aspects of the model and its precision should be improved. In this sense, several works have been published recently addressing different aspects of the model [18, 23]. A first aspect to be noted is that not all the current flowing in the external circuit is related to ion deposition, since some intermediate reactions can be occurring, physisorption is very likely, some electrons can participate on the hydrogen evolution catalysis, etc. The current directly related to the deposit can be much lower than the total measured [1, 13]. Furthermore, as the system involves the deposition of two species, the diffusion coefficient of each one is not expected to be the same or even of the same order, particularly in the cases where anomalous deposition is significant. Diaz-Morales et al. [23] have recently proposed a model including the distinctions of the ions for diffusion-controlled growth of bimetallic phases. They have obtained Equation (2), where Dw = (z1D1γ+ z2D2)/(γ(z1x1 + z2x2)), Da = (γD1 + D2)/(γ+ 1), C* = γC2*= C1* and k = (8πC*(x1vm,1 + x2vm,2))1/2, the subscripts 1 and 2 referring to each ion. vm,i are molar volumes, Ci* the bulk concentrations, and xi the relative concentrations.

Equations (1) and (2) have the same mathematical form, in a way that fits obtained with any one of them are numerically equivalent for a bimetallic alloy. Providing a distinct result that shows the two species were deposited, naturally, Equation (2) will be the most adequate one, but the individual diffusion coefficients must be known independently in order to use this equation for the determination of the separated parameters of each component. The authors of Ref. [23] have used independent results for Ag and Hg deposition in that case. The fundamental arguments to derive Equations (1) and (2) are essentially the whole process is diffusion-controlled, the diffusion of the nuclei is radial on flat surfaces following the Avrami theorem, and the rate of conversion (A) of active sites into growing nuclei is constant. The fitting of experimental results is usually very good numerically, but detailed analysis have shown there is an error of the order of few percent [18, 22], one of the motivations for the use of Monte Carlo simulations for the nucleation kinetics dealing hierarchically with the overlap of the diffusion zones of the deposits. Another important motivation for the use of these simulations is to avoid the assumption of uniform heights for all diffusion zones. The presence of microsteps in the electrode surface is not taken into account, usually.
The use of a constant rate of conversion (nucleation rate) is questionable, especially when we know that the substrate is changing and when the electrode and deposits are composed by different metals or alloys. During the process, a number of ions (not only metallic ions) will reach the electrode surface, part of those ions will remain in contact with the electrode a certain time interval and may be incorporated or not, and all these stages will change along the time, and consequently A will be changed. These changes can be more significant if the adsorptions of intermediate species take part in the deposition. Practically all the proposed explanations for the anomalous deposition of alloys include one or more adsorbed intermediate species [5-13]. As the fitting of the transients involves exponential functions, if the changes in A are not abrupt, the numerical convergence tends to be good. The inclusion of a time dependence smooth in A will lead to expressions similar to Equations (1) and (2), which would hardly provide additional information on this parameter. But the implications are analogous to the case of consider the partial currents in alloy deposition: if we know the effect is present, it is reasonable to include it in the approach, even if the numerical analysis does not furnish a direct evidence of the effect. Concerning the cause of the anomalous deposition itself, one can find different interpretations in the recent literature [5-11], which shows there is still some controversy about the phenomenon. Some works quote the formation of hydroxide of the less noble metal in the electrolyte hinders the discharges of the nobler one [11]. The hydrogen evolution is also argued to enhance the anomalous deposition [5, 7]. A more comprehensive work has been published previously by Zech et al. [12,13]. In this case the anomalous deposition was attributed to the adsorption and partial reduction of the ions followed by a second reaction of complete reduction and incorporation to the electrode surface, the rate of these side reactions are distinct for each metal-ion, in a way the deposition of the nobler ion is inhibited by the adsorption of the less noble and furthermore the presence of the nobler one in the electrolyte accelerate the deposition of the other, as a catalyst. These authors also presented experimental results corroborating their model with a final remark that, for the quantitative prediction of alloy composition, the application of the model is limited due to uncertainties in the reaction mechanisms [13]. In 2008, a similar model but including three adsorbed intermediates has been applied to the study of Fe deposition [14], and two of these intermediates species catalyze the H+ reduction. In this last case, the anomalous deposition is not treated but, if the mechanism proposed is valid, that should modify the model from Zech et al.
More recently, another model for Co-Ni anomalous deposition has been presented [10], following a description similar to the one from Zech et al. with intermediate adsorption of partially reduced metal-ions. The use of this model on Co-Ni deposition on copper rotating disk electrode indicated the first reduction of Co(II) to Co(I)ads is much faster than the equivalent reduction of Ni(II), and the anomalous character of the deposition is essentially attributed to this aspect. Saying in another way, the anomalous deposition would be caused by the much faster charge transfer from the electrode to the less noble metal-ion than to the nobler one. In their analysis [10], those authors also bring to attention that the metal-ions are not the majority species in the solution, fact not always considered, and they also comment on the role B(OH)3 concluding its adsorption is negligible. The solution they have used is similar to the solutions employed here, as well as to the one employed by Zech et al.
The faster or slower reduction of the intermediate species is naturally related with the heat of adsorption in each case. The reaction rates can be analyzed considering the energies of the ions in the solution via Maxwell distribution of velocities and comparing these energies with the heat of adsorption. Also the rate of collisions with the electrode surface of each ion can be inferred and details of the process discriminated. Concentrations and residence time of each adsorbate on the electrode surface should be also included in the description.
In each of the cases discussed above, there is some intermediate adsorbed species which can affect the way of nucleation and growth process and the properties of the final deposited material. One can say these aspects are embedded in some extent in the parameters D and A of the standard model and its variations. D and A are global rates resulting in average from several intermediate stages of the deposition process. Although the major aspects of the current-time transients can be explained by these models, it is clear that for better understand of the phenomenon of anomalous deposition they should include the proposed causing mechanisms. The proposal from Diaz-Morales et al. [23], resulting in Equation (2), is a step forward such an improved model, but the other details commented above will certainly improve it further and may provide a complete understanding of each factor involved.
Sample characterization
Some Ni-Fe films (labeled samples #A, #B, #C, and #D) were produced by three successive steps of 60 s of electrochemical deposition at constant potentials with the high concentration solution, as discussed in the previous section. These films are intended to further studies of magneto-electronic devices and in this way are exploratory samples.
Magnetic characterization has been made by FMR; Fig. 5 presents some of the results.
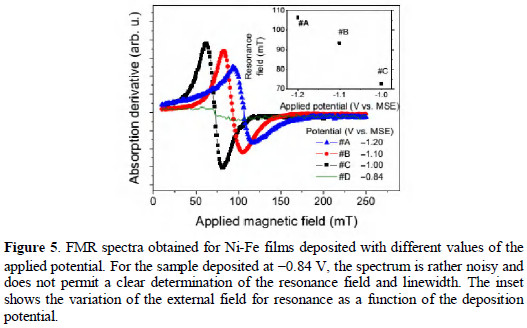
FMR is known to be a technique very sensitive for the local magnetic environment reflecting not only the magnetic ordering and anisotropies but also, indirectly, the crystalline structure of the samples [34, 35]. One can see in Fig. 5 the external field for resonance (''resonance field'') increases from about 0.073 to 0.106 T when the deposition potential becomes more negative from -1.0 to -1.2 V (MSE), the relation is approximately linear. The peak-to-peak linewidth remains between 0.018 and 0.024 T, which are values relatively small and of the same order of the ones obtained in polycrystalline Ni-Fe films produced by electron beam evaporation [36] and sputtering [37]. Since the magnetic inhomogeneity of the local field is mainly related to the polycrystallinity [34, 35], the obtained linewidths indicate these films have a homogeneous crystalline structure. The change of the external field for resonance in its turn is related with the change in the composition of the samples as will be discussed below.
In Fig. 6 are presented EDX spectra obtained with the representative films quoted above.
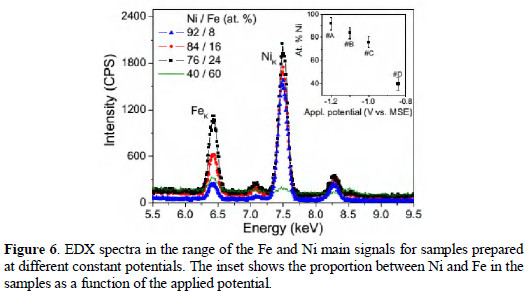
The relative proportions of the Ni and Fe sulfates in the solutions were chosen based on the literature to provide the permalloy final composition Ni80Fe20 [8, 12, 15, 17, 38]. The Ni/Fe overall composition determined by EDX for these samples were: sample #A 92/8, sample #B 84/16; and sample #C 76/24 at.% (uncertainties of the order of 5 at.%). These measured Ni/Fe proportions are the fingerprint of the anomalous deposition since a ratio of 96/4 has been used in the solution (sample #A can be seen as an exception because the values are approximately equivalent considering the EDX uncertainties). The applied potential for these samples were -1.20, -1.10 and -1.00 V (MSE), respectively for samples #A, #B and #C. Therefore, less negative was the applied potential, larger was the amount of Fe deposited. This is the same tendency reported by Llavona et al. in similar solutions but with saccharin as additive and pH = 2.3 [7]. Sample #D has been deposited with a constant potential of -0.84 V, resulting in a less uniform film with overall composition of 40/60 at.%, it is the same sample for which no clear FMR signal has been obtained, as commented. The films with 84 and 76 at.% of Ni are the ones which presented more uniform deposits, i. e., more homogeneous composition along the sample area and smooth surface under typical MEV analysis. As the saturation magnetization of Ni-Fe alloys decreases almost linearly with the increase of the amount of Ni from 50 at.% to pure Ni [33], the change of the resonance field presented in Fig. 5 agrees with the compositions determined by EDX.
MEV representative images for samples #C and #D are presented in Fig. 7(a).
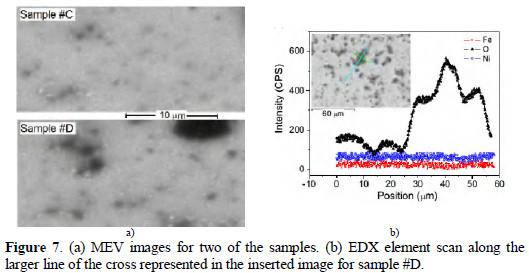
One can see sample #D presents more irregularities and large dark spots. Line EDX scans were collected along some of these spots and indicate a significant amount of oxygen on them, as shown in Fig. 7(b). Since oxygen is present in several components of the solution and can be also present as a dissolved gas not totally eliminated by the N2 bubbling, we cannot determine unequivocally the origin of the oxygen detected in the spots, however one has to note oxygen has fixed in significant amounts in the deposits only for applied potential of -0.84 V (MSE). As the measurement has been made ex situ, the samples were exposed to the air and an unavoidable adsorption of oxygen occurs, then a certain amount of oxygen is detected at any point of the sample surface (the equipment vacuum is of the order of 10-5 mbar).
Concluding remarks
Due to the vast use of metallic alloys for technological applications, particularly the alloys of elements of the iron group, a better understanding of the process of their electrochemical deposition is of great interest, since electrodeposition is one of the methods most used for the production of these alloys. The composition and crystalline characteristics can be tuned varying the deposition parameters, as exemplified by the samples produced in this work, for which the applied potential during the deposition is the decisive parameter.
From the presented results and from the literature, one realizes the main aspects of the nucleation and growth of metallic films electrochemically produced can be explained by the available models, particularly the so called standard model and its variations. However, there is not a universally accepted description for the causes of the anomalous deposition of alloys. In this way, the models for nucleation and growth must be extended to include different aspects of the anomalous deposition, as the distinct behavior of the parameters A and D for each metal of the alloy, as well as the influence of the intermediate adsorbates on them. A more comprehensive model including these features can be used to verify the several hypotheses for the anomaly leading to a better description of the process from both quantitative and qualitative points of view.
References
1. Andricacos PC, Robertson N. IBM J Res Develop. 1998;42:671. [ Links ]
2. Paunovic M, Schlesinger M. Fundamentals of electrochemical deposition. New York: John Wiley & Sons; 1998. [ Links ]
3. Fert A. Rev Mod Phys. 2008;80:1517. [ Links ]
4. Tebbakh S, Messaoudi Y, Azizi A, et al. Trans IMF. 2015:196. [ Links ]
5. Yang Y. Int J Electrochem Sci. 2015;10:5164. [ Links ]
6. Tebbakh S, Beniaiche A, Fenineche N, et al. Trans IMF. 2013:17. [ Links ]
7. Llavona A, Perez L, Sanchez MC, et al. Electrochim Acta. 2013;106:392. [ Links ]
8. Su X, Qiang C. Bull Mater Sci. 2012;35:183. [ Links ]
9. Lee T, Chang L, Chen C. Surf Coat. Tech. 2012;207:523. [ Links ]
10. Vazquez-Arenas J, Pritzker M. Electrochim Acta. 2012;66:139. [ Links ]
11. Abou-Krisha MM, Assaf FH, El-Naby SA. J Coat Technol Res. 2009;6:391. [ Links ]
12. Zech N, Podlaha EJ, Landolt D. J Electrochem Soc. 1999;146:2886. [ Links ]
13. Zech N, Podlaha EJ, Landolt D. J Electrochem Soc. 1999;146:2892. [ Links ]
14. Diaz SL, Calderon JA, Barcia OE, et al. Electrochim Acta. 2008;53:7426. [ Links ]
15. Gao LJ, Ma P, Novogradecz KM, et al. J Appl Phys. 1997;81:7595. [ Links ]
16. Guo L, Searson PC. Electrochim Acta. 2010;55:4086. [ Links ]
17. Su C, He F, Ju H, et al. Electrochim Acta. 2009;54:6257. [ Links ]
18. Mazaira D. BorrAs C, Mostany J, et al. The development of theoretical models for multiple nucleation with diffusion-controlled three dimensional growth. In: Huizar LHM, editor. Theoretical and experimental advances in electrodeposition. Kerala: Research Signpost, 2008; 1-23. [ Links ]
19. Schariffker BR, Mostany J. J Electroanal Chem. 1984;177:13. [ Links ]
20. Bostanov V, Obretenov W, Staikov G, et al. J Cryst Growth. 1981;52:761. [ Links ]
21. Bostanov V, Obretenov W, Staikov G, et al. J Electroanal Chem. 1983;146:303. [ Links ]
22. Matthijs E, Langerock S, Michailova E, et al. J Electroanal Chem. 2004;570:123. [ Links ]
23. Diaz-Morales O, Mostany J, Borras C, et al. J. Solid State Electrochem. 2013;17:345. [ Links ]
24. Bucher JP, Santesson L, Kern K. Langmuir. 1994;10:979. [ Links ]
25. Bubendorff JL, Beaurepaire E, Meny C, et al. Phys Rev B. 1997;56:R7120. [ Links ]
26. Zech N, Landolt D. Electrochim Acta. 2000;45:3461. [ Links ]
27. Yin K-M, Lin B-T. Surf Coat Technol. 1995;78:205. [ Links ]
28. Bento FR, Mascaro LH. Surf Coat Technol. 2006;201:1752. [ Links ]
29. Yang M, Hu Z. J Electroanal Chem. 2005;583:46. [ Links ]
30. Grujicic D, Pesic B. Electrochim Acta. 2002;47:2901. [ Links ]
31. Bort H, Juttner K, Lorenz WJ, et al. Electrochim Acta. 1983;28:985. [ Links ]
32. Scharifker BR, Hills G. Electrochim Acta. 1983;28:879. [ Links ]
33. Bozorth RM. Ferromagnetism. New York: IEEE Press; 1993. [ Links ]
34. Farle M. Rep Prog Phys. 1998;61:755. [ Links ]
35. Sparks M. Phys Rev B. 1970;1:3856. [ Links ]
36. Pires MJM, Oliveira Jr RB, Martins MD, et al. J Phys Chem Solids. 2007;68:2398. [ Links ]
37. Pires MJM, Araujo-Filho MS, Tedesco JCG, et al. J Phys Chem Solids. 2014;75:1124. [ Links ]
38. Leith SD, Ramli S, Schwartz DT. J Electrochem Soc. 1999;146:1431-1435. [ Links ]
Acknowledgements
The financial support from the agencies FAPEMIG (CEX -APQ-01341-14) and CAPES (PDEE BEX: 2459/35) is acknowledged. The author is grateful to Prof. E. C. da Silva and to former group of Prof. J. Pelzl (Experimentalphysik III, Festkorperspektroskopie Ruhr-Universitat Bochum). Analysis involving MEV/EDX was performed in the Laboratorio Multiuso de Microscopia Avancada - UFVJM.
*Corresponding author. E-mail address: manoel.pires@ict.ufvjm.edu.br
Received May 13, 2016; accepted October 12, 2016

