


Serviços Personalizados
Journal
Artigo
 Inglês (pdf)
 Artigo em XML
 Referências do artigo
 Enviar este artigo por email
Indicadores
-
 Citado por SciELO
 -
 Acessos
Links relacionados
-
 Similares em
SciELO
Similares em
SciELO
Compartilhar

 Permalink
Portugaliae Electrochimica Acta
versão impressa ISSN 0872-1904
Port. Electrochim. Acta vol.35 no.2 Coimbra mar. 2017
https://doi.org/10.4152/pea.201702117
Corrosion Inhibition of Brass in 0.5 M HNO3 by 3-hydroxy-3( 4-chlorophenyl-1-(4-sulphonato (sodium salt)) Phenyl Triazene (HCST): Adsorption and Thermodynamic Study
Alpana Soni* , Pratibha Sharma, Monika, Rekha Dashora and A.K. Goswami
Coordination Laboratory, Department of Chemistry, Mohanlal Sukhadia University, Udaipur, 313001, Rajasthan, India
Abstract
The effect of the concentration and nature of novel 3-hydroxy-3-(4-chlorophenyl-1-(4sulphonato (sodium salt)) phenyl triazene (HCST) on corrosion and dezinfication of 70/30 brass in 0.5 M HNO3 solution has been investigated by weight loss method. Inhibition efficiency of this corrosion inhibitor was also evaluated at different temperatures ranging from 303 K-333 K. It was observed that HCST showed 88.13% inhibition efficiency at 303 K up to 0.005 M concentration of inhibitor. Weight loss method has been used to analyze the corrosion behavior of the brass in the absence and presence of different concentrations of inhibitor. The corrosion inhibition efficiency increases with increasing concentration of inhibitor and decreases with rise in temperatures. Activation energy (Ea), enthalpy (ΔH), entropy (ΔS) and Gibbs free energy (ΔG) for corrosion process have also been calculated. The adsorption behavior of HCST on brass surface has been found to obey Langmuir adsorption isotherm. Results reveal that hydroxytriazenes can be potential corrosion inhibitors.
Keywords: Hydroxytriazene (HCST), corrosion inhibitors, weight loss method, brass, nitric acid.
Introduction
Dezincification of brass is one of the well-known and common processes by means of which brass loses its valuable physical and mechanical properties leading to structural failure [1]. Corrosion has two specific forms: direct chemical attack and electrochemical attack, and in this both types of corrosion the metal is converted into a metallic compound such as an oxide, hydroxide, or sulfate. Brass has been the most commonly used material for fittings such as stop valves and control valves, shipboard condensers, power plant condensers and petrochemical heat exchangers [2-4]. Due to various industrial applications and economic importance of brass, its protection against corrosion attracts much attention. One of the most important methods in corrosion protection is the use of inhibitors [5-8].
Many organic compounds, especially those containing polar groups and/or substituted heterocycle including nitrogen, sulphur and oxygen in their structures, have been reported to inhibit the corrosion of copper [9-12]. The inhibiting action of these organic compounds is usually attributed to the formation of donor-acceptor surface complexes between the free or π electrons of an inhibitor and the vacant d-orbital of a metal [13-14].
Hydroxytriazenes have been extensively used as spectrophotometric and complexometric reagents for estimation of almost transition metal series. A number of reviews have been published by our laboratory on application of hydroxytriazenes [15-21]. They have also been screened for their biological activities. However, very few studies have been done on their corrosion inhibitive properties. Studies have been done on their behavior for protection of brass in HNO3 medium. It is proven that hydroxytriazenes are potential corrosion inhibitors for brass and copper in ammoniacal medium.
This paper focuses on application of hydroxytriazenes for their corrosion inhibition.
Experimental section
Materials and methods
Synthesis of 3-hydroxy-3-(4-chlorophenyl-1-(4-sulphonato (sodium salt)) phenyl triazene
Step I: Reduction of nitro compounds In this step 0.05 moles of p-chloronitrobenzene were reduced with Zn dust in the presence of NH4Cl in water-alcohol medium using a mechanical stirrer at 40-60 °C to obtain phenyl hydroxylamine. The resulting mixture was filtered under suction and the filtrate was kept in fridge to cool.
Step II: Diazotisation of sulphanilic acid In this step 0.05 mole sulphanilic acid was dissolved in solution of sodium carbonate and cooled to 0-5 °C. Sodium nitrite solution was added to sulphanilic acid solution in acidic medium at 0-5 °C under constant mechanical stirring to obtain p-sulphonatophenyldiazonium chloride.
Step III: Coupling The diazonium compound prepared in step II was added slowly to the phenylhydroxylamine (product of step a) solution under constant stirring at 0-5 â°C and the pH was maintained among 5-6 by adding solid sodium acetate. The reaction mixture was further stirred for 15 minutes after complete addition of diazonium compound. Sodium chloride was added in sufficient quantity to saturate the solution. The final product obtained was soluble in water, so washing with H2O was avoided. The crude compound was recrystallized from double distilled water. Purity of the compounds was checked by recording melting points and other physical characterization methods such as IR, element analysis, 1H NMR and Mass. It was found that the compounds synthesized are in pure state.
Characterization
IR spectral analysis and following bands were observed. IR in cm-1: 3463 (O-H str.), 3207(N-H str.), 3050 (C-H str. Ar), 2948 (C-H str., CH3), 1632 (N=N str.), 1419 (N-Nstr.), 1320 (N-O str), 737(C-Cl str.Ar.). The spectra showed the compound to be in pure state. IR spectra were recorded on FT IR. NMR-Δ (ppm) -12.17 (O-H, s), 7.47-8.11 (multiplet, 8H).
Specimen preparation
The brass specimens having the chemical composition of Cu ~70% and Zn~ 30% from commercial material were used for experiments by weight loss method with specimens of the dimensions (2.5 × 2.5 × 0.1) cm. Each specimen was polished with emery paper, washed with acetone and rinsed by distilled water and dried in an oven and then accurate weight of specimens was determined using an analytical balance of 0.0001 gm accuracy. These specimens were placed in a beaker having 100 mL solution of 0.5 M HNO3 with and without inhibitor using 'V' shape hanging capillary.
Weight loss method
After initial weighing, the specimens in duplicate were immersed in 100 mL of acid solution in the presence and absence of different concentrations of the inhibitor at various temperatures ranging 303-333 K. Thermostated water bath was used to maintain temperature; after 24 hours immersion, the specimens were taken out, washed, dried, and the final weight were noted. From initial and final weight of the brass specimen, weight loss in gm, corrosion rate (CR) in gm cm-2h-1 , inhibition efficacy percentage (IE), and surface coverage (θ), were determined using equations 1, 2 and 3, respectively [22-24].
where CR is the corrosion rate (mg cm-2h-1), ΔW is the weight loss (g), A is the surface area, and t is the immersion time in hours.

where W0 and W are the weight-loss in absence and presence of the inhibitor, respectively.
Atomic adsorption spectroscopy
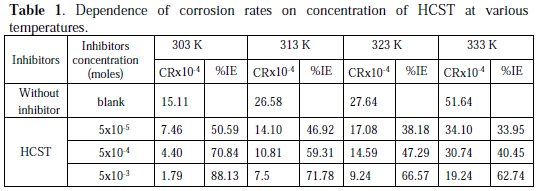
The spectroscopy has been used to find out the concentration of dissolved copper and zinc in medium solution in which metal / alloy get corroded in the absence and presence of the inhibitor. The concentrations of dissolved copper and zinc in mg/L in blank solutions and in solution containing 5&time;10-3 moles of the HCST after corrosion at 303 K are shown in Table 1, and IE percentages have been calculated using equation (4) and are also given in Table 1.

where Co is the concentration of Cu and Zn in solution without inhibitor (Blank), and Ce is the concentration of Cu and Zn in solution with inhibitor.
Results and discussion
Effect of concentration of HCST on corrosion rate and inhibition efficiency
The effect on corrosion rate of brass i n the absence and presence of various concentrations of the inhibitor (HCST) w a s studied from 303 to 333 K in 0.5 M HNO3 medium. The result (Fig. 1) shows that the corrosion rate of brass decreases with increasing the concentration of the inhibitor at all temperatures in 0.5 M HNO3, which shows an increase in adsorptions of the inhibitor on the surface of the brass.
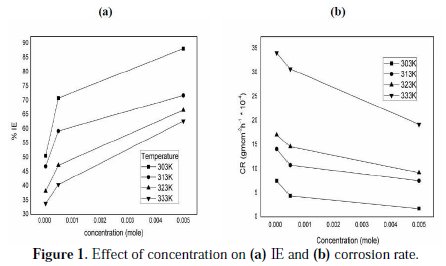
The corrosion inhibition efficiency of the inhibitor for brass increases as the concentration of inhibitor increases and decreases with increasing temperature. The IE of HCST is due to the adsorption of its molecules on the brass metal surface. This also depends on the number of active sites in the molecule, molecular size and mode of interaction between metal and inhibitor.
Effect of temperature on inhibition efficiency and corrosion rate
The temperature dependence of IE has been worked out by plotting graphs between temperature and % inhibition efficiency (IE). The corrosion rate of brass in nitric acid solutions with and without inhibitors (HCST) has also been studied at different temperatures ranging from 303 to 333 K. The resultant observations are shown in Table 1. Fig. 2, is a typical plot of HCST showing that as the temperature increases the inhibition efficiency decreases.
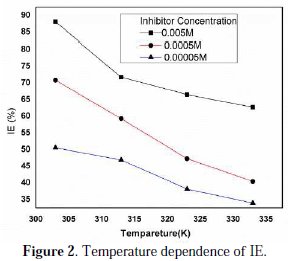
The maximum percentage inhibition is 88.13% at the highest concentration 0.005 M at 303 K.
Adsorption isotherm
Adsorption isotherms are used in determining the mechanism of any organoelectrochemical reaction. Inhibition efficiency (%) is directly proportional to the surface covered by the adsorbed molecule (θ). The adsorption isotherm shows the relationship between the surface coverage with the adsorbed species and the concentration of inhibitor in solution. The value of the surface coverage (θ) at different concentrations of the inhibitors in 0.5 M HNO3 acid solution was fit to adsorption isotherms. HCST inhibitor is found to obey Langmuir adsorption isotherm because the plot of C/θ vs. C is linear. The isotherm is described by equation (5) [25-26].

where C is the inhibitor concentration, K is the adsorption equilibrium constant and θ is the surface coverage.
Thermodynamic parameters
Determination of activation energy
The temperature dependence of the inhibition efficiency and activation energy in the presence and absence of the inhibitor gives the mechanism of the inhibitor adsorption. Inhibition efficiency decreases with increasing temperature, and activation energy (Ea) increases in the presence of the inhibitor compared to that in the absence of the inhibitor [27]. Thus the activation energy (Ea) for the corrosion process with and without the corrosion inhibitor was evaluated from Arrhenius equation (eq. (6)).
The mathematical expression between the corrosion rate (CR) and temperature (T) is generally expressed by the Arrhenius equation [28-29]

where CR is the rate of corrosion, A is the frequency factor, Ea is the apparent activation energy, R is the molar gas constant and T is the absolute temperature. Fig. 3 curves show the Arrhenius plot in absence and presence of the inhibitor in solutions.
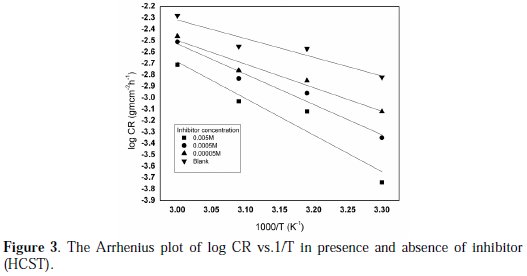
Regression coefficients were found to be very close to 1, which shows a good relationship between log CR and 1/T. Straight lines were obtained with slope of -Ea/2.303R. The activation energy (Ea) was calculated from the slope of Arrhenius plot (Ea = 2.303 × 8.314 × slope). The activation energy increases as the concentration of the inhibitors (HCST) increases, which indicated physical adsorption on the brass surface. The activation energy of the corrosion process was greater than 20 kJ mol-1 [30]. Values of Ea for the corrosion reaction were calculated and have been given in Table 2.
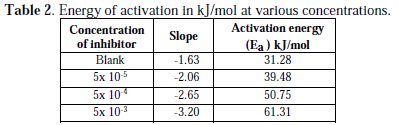
The values of activation energy (Ea) for brass corrosion in the presence of HCST in 0.5 M HNO3 are shown in the Table 2. The data show that the activation energy (Ea) in the presence of HCST is higher than without the inhibitor. Activation energy Ea was found to be 31.28 kJ/mol for 0.5 M HNO3 and increased to 61.31 kJ/mol in the presence 0.005 M concentration of inhibitor at 303 K, showing that the adsorbed organic molecule provided a physical barrier to the charge and mass transfer, leading to reduction in corrosion rate [31].
Determination of enthalpy and entropy
Other thermodynamic parameters such as enthalpy (ΔH) and entropy (ΔS) of activation of the corrosion process may be evaluated from the effect of temperature. The enthalpy (ΔH) and entropy (ΔS) of activation of the corrosion process was calculated from eq. (7) (Transition state theory) [32]:

where CR is the corrosion rate (gm cm-2h-1), h is the Plank's constant (6.62×10⁻³⁴ J.s), N is the Avogadro's number (6.022×10⁻²³ mol-1), R is the universal gas constant (8.3144 J.K-1.mol-1), and T is the absolute temperature.
A plot of log CR vs. 1000/T (Fig. 4) is a straight line graph with a slope of (ΔH /2.303R) and an intercept of (logR/Nh + ΔS /2.303R) from which the values of ΔH (ΔH = Slope×R) and ΔS(ΔS=(Intercept-lnR/Nh) 2.303R) were calculated [33-34].
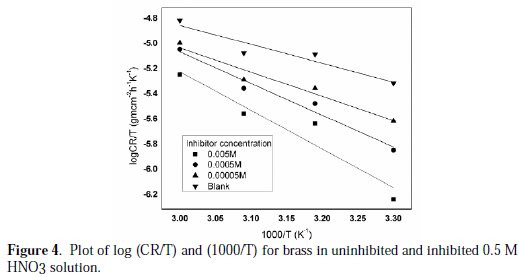
The results presented in Table 3 show that the enthalpy of activation values is positive, which reflects the endothermic nature of metals or brass dissolution process [35].
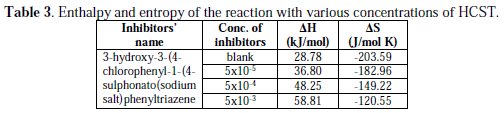
Also, the entropies of activation energy were positive, indicating that the activation complex represents association steps and that the reaction was spontaneous and feasible [36].
Determination of Gibbs free energy
The Gibbs free energy of adsorption (ΔG) characterizes the interaction of adsorption molecules and metal surface, which was calculated by equation (8).
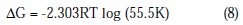
The values of ΔG obtained are presented in Table 4.
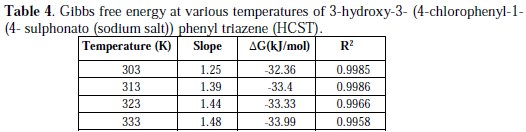
The negative values of ΔG ensure the spontaneity of adsorption process and stability of the adsorbed layer on the brass surface. Generally, the values of ΔG around -20 kJ/mol or lower are consistent with physisorption, while those around -40kJ/mol or higher involve chemisorption. As shown in the Table 4, results obtained indicate that the values of ΔG are negative. This implies that the HCST is adsorbed on the surface of brass specimen and so gives a very strong inhibition of corrosion. The values of ΔG were calculated by the slope of plot of C/θ vs. C, Fig. 5, which shows Langmuir adsorption isotherm.
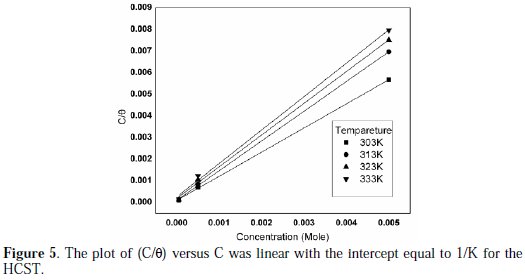
Compound HCST, used as an inhibitor, is found to obey Langmuir adsorption isotherm because the plot of C/θ vs. C is linear.
The values for slope and correlation coefficient (R2) for the HCST at various temperatures are shown in the Table 4.
Atomic adsorption spectroscopy
These corrosion studies the concentration of corroded and protected Cu and Zn were determined by AAS and the results have been shown in Table 5.
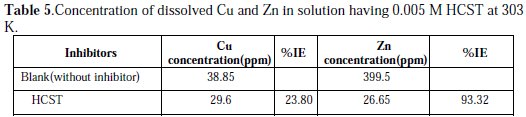
The results indicate that out of brass sample Zn is corroded at higher rate than Cu. Further, the inhibitors are more effective to protect corrosion in case of Zn than in copper. The % IE by this HCST is 93.29%. We conclude that we can explore this corrosion inhibitor for brass and zinc.
Conclusions
The main conclusions are as follows:
1. 3-hydroxy-3-(4-chlorophenyl-1-(4-sulphonato (sodium salt)) phenyl triazene (HCST) shows strong inhibitive action against the corrosion of brass in 0.5 M HNO3.
2. The inhibition efficiency increases with increasing the inhibitor concentration up to 0.005 M and decreases as the temperature increases.
3. The adsorption of hydroxytriazene on brass obeys Langmuir adsorption isotherm.
4. Hydroxytriazenes are better corrosion inhibitors due to the π-electrons contribution of benzene ring and presence of more adsorption sites. And these significands are introducing phenyl group and SO3 H group in compounds.
References
1. Xavier JR, Nallaiyan R. J Solid State Electrochem. 2012;16:391. [ Links ]
2. Warraky A, Shayeb HA, E.M. Sherif EM. Anti-Corros Methods Mater. 2004;51:52.
3. Sherif EM, Erasmus RM, Comins JD. J Colloid Interface Sci. 2007;309:470. [ Links ]
4. Quartarone G, Moretti G, Bellomi T. Corrosion. 1998;54:606. [ Links ]
5. Asan A, KabasakaloÄlu M, IÅıklan M, et al. Corros Sci. 2005;47:1534.
6. Sherif EM, Erasmus RM, Comins JD. Corros Sci. 2008;50:3439. [ Links ]
7. Babic-Samardzija K, Hackerman N. J Solid State Electrochem. 2005;9:483. [ Links ]
8. Ranjana RB, Nandi MM, Indian Inst Technol. 2010;17:176. [ Links ]
9. Abd El-Maksoud SA. J Electroanal Chem. 2004;565:321. [ Links ]
10. Christy AG, Lowe A, Otieno-Alego V, et al. J Appl Electrochem. 2004;34:225. [ Links ]
11. Elmorsi MA, Hassanien AM. Corros Sci . 1999;41:2337. [ Links ]
12. Bouklah M, Benchat N, Hammouti B, et al. Mater Lett. 2006;60:1901. [ Links ]
13. Bastidas JM, Pinilla P, Cano E, et al. Corros Sci. 2003;45:427. [ Links ]
14. Bentiss F, Traisnel M, Lagrene M. J Appl Electrochem. 2001;31:41. [ Links ]
15. Kumar S, Goswami AK, Purohit DN. Revs Anal Chem. 2003;22:73. [ Links ]
16. Ram G, Chauhan RS, Goswami AK, et al. Revs Anal Chem. 2003;22:255. [ Links ]
17. Khan S, Dashora R, Goswami AK, et al. Revs Anal Chem. 2004;23:1. [ Links ]
18. Dalawat DS, Chauhan RS, Goswami AK. Revs Anal Chem. 2005;24:75. [ Links ]
19. Singh K, Chauhan RS, Goswami AK. Met Chem. 2005;28:119. [ Links ]
20. Upadhyaya M, Chauhan RS, Goswami AK. Met Chem. 2005;28:301. [ Links ]
21. Khan R, Mehta A, Dashora R, et al. Revs Anal Chem. 2005;24:149. [ Links ]
22. Forty AJ, editor. Physical Metallurgy of Stress Corrosion Fractures. New York: Inter Science; 1959.
23. Uhlig HH, Revie RW. Corrosion and Corrosion Control. New York: Wiley; 1985. [ Links ]
24. Abdallah M, Al-Agez M, Fouda AS. Int J Electrochem Sci. 2009;4:336. [ Links ]
25. Al-Mhyawi SR. Orient J Chem. 2014;30. [ Links ]
26. Blaedel WJ, Meloche VW. Elementary Quantitative Analysis; Theory and Practice. 2nd edition. New York: Harper & Row, Publ, Inc. 1963. Pp. 684-698. [ Links ]
27. Ebenso EE. Mater Chem Phys. 2003;79:58. [ Links ]
28. Rani PD, Selvaraj S. J Phytology. 2010;2:58. [ Links ]
29. Gupta SL, Dandia A, Singh P, et al. J Mater Einviron Sci. 2015;6:168. [ Links ]
30. Larabi L, Benali O, Mekelleche SM, et al. J Appl Surf Sci. 2006;253:1371. [ Links ]
31. James AO, Oforka NC, Abiola OK. Bull Electrochem. 2006;22:111. [ Links ]
32. Haladky K, Collow L, Dawson J. Br Corros J. 1980;15:20. [ Links ]
33. Al-Dokheily ME, Kredy HM, Al-Jabery RN. J Natur Sci Research. 2014;4:17. [ Links ]
34. Behpour M, Ghoreishi SM, Gandomi-Niasar A, et al. J Mater Sci. 2009;44:2444. [ Links ]
35. Quraishi MA, Khan S. J Appl Electrochem. 2006;36:539. [ Links ]
36. Umoren AU, Obot IB, Ebenso EE, et al. Port Electrochim Acta. 2008;26:267. [ Links ]
*Corresponding author. E-mail address: alpana.soni94@gmail.com
Received September 30, 2015; accepted November 25, 2016

