


![Experimental and Theoretical Studies of the Corrosion Inhibition of 4-amino-2-(4-chlorophenyl)-8-(2, 3-dimethoxyphenyl)-6-oxo-2, 6-dihydropyrimido [2, 1-b][1, 3] thiazine-3,7-dicarbonitrile on Carbon Steel in a 1.0 M HCl Solution](/img/en/prev.gif)


Services on Demand
Journal
Article
 English (pdf)
 Article in xml format
 Article references
 Send this article by e-mail
Indicators
-
 Cited by SciELO
 -
 Access statistics
Related links
-
 Similars in
SciELO
Similars in
SciELO
Share

 Permalink
Portugaliae Electrochimica Acta
Print version ISSN 0872-1904
Port. Electrochim. Acta vol.36 no.1 Coimbra Jan. 2018
https://doi.org/10.4152/pea.201801053
Tetrahedral Finite Element Modeling of UNS S31600 Stainless Steel Corrosion Behavior under Superfinish Turning Conditions
Y. Ech-Charqya,b,* , A. Samiha , H. Gzirib and M. Essahlia
a University Hassan 1, Laboratory of Applied Chemistry and Environment, Faculty of Science and Technology, Settat, Morocco
b University Hassan 1, Laboratory of Mechanic, Industrial Management and Innovation, Faculty of Science and Technology, Settat, Morocco
Abstract
The objective of this work is to achieve an analytical predictive model to study the influence of surface topography on the corrosion resistance of UNS S31600 stainless steel, in a solution of sodium chloride NaCl, at 6% by weight as electrolyte, applying the finite element method. The surface topography was given by the average roughness variation of a UNS S31600 work piece in superfinish turning, of which correlation with the corrosion resistance was examined. The analytical results show that corrosion physico-chemical parameters, polarization resistance, corrosion rate, corrosion potential, and current density have a very remarkable correlation with the surface roughness obtained by the superfinish turning. This is due to a very significant affinity between the plastic deformation depth obtained by turning, and the pits development on the work piece surface.
The whole work was completed by an empirical analysis, in order to validate the analytical results obtained in comparison with the experimental results.
Keywords: Pitting corrosion; finite elements; arithmetic roughness; superfinish turning; potentially dynamic test.
Introduction
Superfinish turning is a machining process that has become more important in the mechanic industry. It consists in avoiding the rectification phase, in order to have a good machined surface quality. This process is developed in mechanical engineering, especially when the work piece's functional performance and lifetime are essential requirements. Numerous experimental and analytical studies have been carried out to quantify the influence of these cutting conditions on the surface texture [1, 2, 3], residual stresses [4, 5, 6] and microstructure [7, 8] of metals and metal alloys.
In literature, numerous studies claim that cutting turning conditions induce a field of residual stresses in the work piece's interior surface [9]. They significantly modify the work piece's microstructure, texture and mechanical properties [10], as well as its electrochemical behavior and corrosion resistance.
Some research has testified that the specimen's corrosion behavior is influenced by machining [11, 12]. Szklarska-Smialowska has confirmed that the more the surface is chemically and physically homogeneous, the more the pitting potential is increased, and the number of pits is weaker; consequently, the better is the metal corrosion resistance [13]. Zuo et al. [14] have affirmed that the number of stainless steels' metastable pits decreases with an increasing number of the paper's grains at a given potential. Similar results were obtained by Sasaki and Burstein [15], who reported that the pitting potential is lower for rougher surfaces than for smoother ones. This observation was confirmed by Zatkalikova and Liptakova [16]. They have noted that the potential and the corrosion rate are lower with a decrease in the average UNS S30400 roughness value. This corrosion rate was studied by M.
Prakash et al. [17], and they have found that it decreased with an increasing cutting speed of the turning, and increased with the decreasing of the cutting tool's cutting angle. However, Sang Mok Lee et al. [18] have found that the polarization resistance no longer was significantly correlated with the average roughness. Gravier et al. [19] have observed that the electrochemical behavior of machined surfaces is influenced by mechanical and microstructural properties in NaClO4 at 25 °C, and have adapted the electrochemical microcell technology to their research. Similarly, Bissey-Breton et al. [20] have found that the surface roughness and residual stresses are strongly correlated with the corrosion potential. Yin et al. [21] have also shown that the granular microstructure affects the residual stresses distribution at depth, which has an impact on the corrosion wear of copper surfaces, when exposed to a NaCl solution. Thus, Robin et al. [22] have found that copper corrosion resistance decreases with an increasing stress intensity induced by the stamping process.
Previous simulations prove that there is a remarkable relationship between the work piece surface deformations (of which roughness is a special form) and pitting corrosion. Szklarska-Smialowska [23] has mentioned that surface gaps in metals similarly act to the interstices between two metal parts where local acidification occurs.
The previous models [24, 25, 26] have treated pit propagation, which is based on the numerical solution of equilibrium chemical species' mass transport equations across a one-dimensional cavity. Laycock and White [27] have studied pit propagation in austenitic stainless steel series 300, under potentiostatic control in a deaerated sodium chloride solution. The model was based on the requirement of local chemistry being almost saturated in the pit. The authors have taken into account salt film precipitation, electrolytes migration and transport outside the pit. Burstein et al. [28] have stated that stainless steel behavior in concentrated chlorine is similar to that of iron. Sharland et al. [29] have described the pit development in a localized corrosion process, based on a mathematical representation of the physical mechanisms controlling the process. Using the finite element method, they have solved a series of mass conservation equations describing a system in an active cavity. Gartland [30] has developed a model for the processes of corrosion by crevice. His work resembled that of Walton, who has taken into account a pH-dependent active-passive transition, has considered the appearance of a salt film on a metal surface during propagation, and [31] has also developed a mathematical model to evaluate mass transport processes and chemical reactions in iron pits and surface vacancies. The electrolytes used in the experiments were acetate and sulfuric acid. Turnbull and Thomas [32] have modeled electrochemical conditions in a static puncture. It is one of the first presented works that have taken into consideration transport equations' solution, considering electrochemical kinetics inside the crack. They have studied steel in a chloride solution, based on the species' equilibrium mass transport, by diffusion and ion migration. The envisaged reactions are metal anodic dissolution, ferrous ions hydrolysis, and hydrogen ions and water cathodic reduction. They have stated that bite propagation depended on the anodic process speed, that is, on the metal dissolution and hydrogen ion production rate.
Malki and Baroux [33] have studied stainless steels metastable pits in an aqueous sodium chloride solution, focusing in particular on the critical conditions of the active/passive transition, independently of the pits geometry. Repassivation is studied by making the initial geometry to have active limits with dissolution flows, according to Tafel's law, and passive limits with zero dissolution flux. Blondel and Girardin [34] have constructed a pitting corrosion one-dimensional model using FEMLAB. They have studied iron pitting corrosion in a sodium chloride solution, with an initial pH=8 at 25 °C. The aim of the work was to ensure FEMLAB reliability to produce results that are consistent with experimental results and other published publications. Amri et al. [35] have been working on the numerical simulation of the corrosion behavior of carbon steel dioxide and aqueous acetic acid environments. They have studied stable chemistry and kinetics inside the active cavity. The model has considered the species mass transfer with the two- dimensional axial symmetry geometry of a cylindrical pit. The authors have concluded that acetic acid plays a major role in the corrosion pitting growth mechanism, and that carbon dioxide in depth depletion leads to reduced metal dissolution, and, therefore, to an increase in the polarization resistance. Stroe et al. [36] have investigated stainless steel pitting corrosion in chloride electrolytes. Their model is solved in a single dimension, using the Nernst-Planck equations in the stationary state. The result has indicated that there is a relationship between puncture geometry and corrosion potential. Krawiec et al. [37] have carried out experiments to study the stainless steel electrochemical behavior in 1.7 M sodium chloride in an environment at pH=3. A numerical model was set up to determine the parameters involved in mass transport and species distribution. The numerical model provides results that are in good agreement with the experimental curves. Therefore, this review will focus on carbon steel and stainless steel. Their models were made with an aqueous solution with a supporting electrolyte such as sodium chloride. This observation allowed us to adapt iron physical parameters to this study, in order to describe roughness impact on austenitic stainless steel behavior. In this work, a finite element modeling has been established, in order to find a correlation among the corrosion physicochemical parameters (polarization resistance, corrosion potential, and corrosion current density), surface roughness and cutting parameters obtained by the superfinish machining.
Presentation of the analytical analysis by finite elements
The electrolyte
A model of iron pitting corrosion growth in solutions in an aerated environment is shown in Fig. 1.
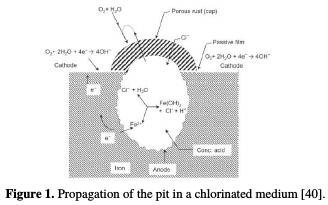
The low-potential pits growth is controlled by electrochemical kinetic parameters such as charge transfer, mass transport or ohmic effects. Mass transport of a chloride or oxidant to the pit bottom controls pits growth at high potentials.
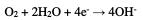
During pits growth, oxygen reduction occurs in the passive region, while ferrous ions formed at the anode penetrate the solution under the hydrated oxide film [38, 39].

Anodic metals dissolution rate is controlled by oxygen reduction in the passive cathode's outer surfaces. Positively charged ferrous ions attract negatively charged chloride ions from the solution, and accumulate at the initial pit site.
Then, the ferrous ions react with the OH- ions to form ferrous hydroxide:
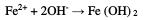
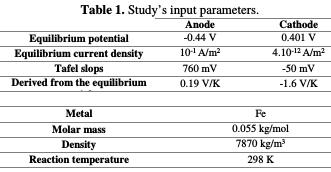
Table 1 shows the different input values of the finite element analysis, describing the behavior of stainless steel corrosion, machined under different cutting parameters.
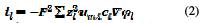
In this research, the model was constructed from a NaCl 6% by weight as electrolyte, which is characterized by its conductivity, σl. The electrolyte node defines a current balance in the electrolyte (equation 1).

where il designates the current density vector. In the free electrolyte, there is no charge source.
Distributions equations of primary and secondary current density The current density vector in an electrolyte:
Assuming an almost constant charge carriers composition, a constant electrolytic conductivity can be defined as:
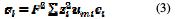
The current density in the electrolyte is written as:
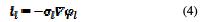
The charge conservation gives the domain equation usually used for the electrolyte in the primary and secondary current distribution interfaces:
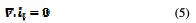
The primary and secondary current distribution interfaces define two dependent variables:
• The electrolyte potential.
• The electrode potential.
Conduction of the current in the electrolyte is assumed to take place by ion transport, while the electrons conduct current into the electrode. Since Ohm's law is also used for current conduction in the solid electrode phase, the general equations in these interfaces are equations 6 and 7.
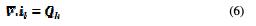

where Qk denotes a term from a general source, k denotes an index which is l for the electrolyte or s for the electrode, σk denotes the conductivity (unit S / m) and φk the potential (unit V).
Model geometry
The modeling is presented as an electrolyte with a rectangular shape with a width of 5 μm and a height of 2 μm (Fig. 2), and a deformation of different depths, which presents the different machined surface average roughness values in finishing and superfinishing operations.
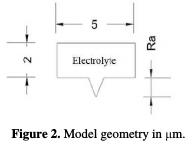
The roughness depth varies between 0 μm and 2 μm, with a pitch of 0.1 μm. So, the finite element analysis is going to be parametric, and it takes place by changing the surface roughness.
Governance equations
Modeling generally assumes that the reactions within the pit are in equilibrium. The current density on an electrode depends on the electrode potential. Since anodic and cathodic reactions can occur on the same electrode, a general representation of an electrode polarization is described in the Butler-Volmer equation:

where: I is the charge transfer current density (A.m-2), Z is the metal valence, F the Faraday constant (96500 C.mol-1), α is the anode charge transfer coefficient (0 < α < 1), η = E - Erev, overvoltage or deviation potential with respect to the equilibrium value, Erev, for which Ia | = | Ic | = | I0 |, and I = 0; and I0: exchange current density of the electrode reaction at equilibrium.
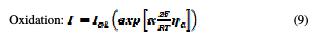
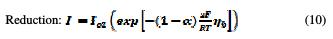
When η is positive (anodic reaction), the first term in the Butler-Volmer equation becomes negligible and, therefore, only the second term is significant. However, when η is negative (cathodic reaction), the second term in the Butler-Volmer equation becomes negligible and, therefore, only the first term is significant. Thus, the two equations (9 and 10) of the current of oxidation reactions, and of the reduction are written as follows [41, 42]:
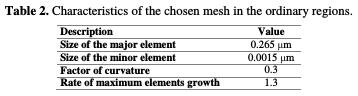
Choice of mesh
The electrolyte is meshed in the x and y directions using the triangular parameters (and Fig. 3 and Table 2).
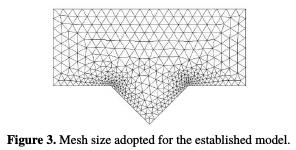
However, for the roughness depth region, the maximum size of the element was set to 10-4, reflecting smaller meshes than the overall mesh (Table 3).
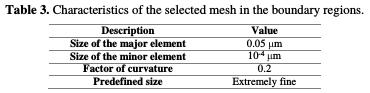
This is due to the shape obtained from the pit after the corrosion simulation. Therefore, the smaller is the element's size, the more accurate are the results.
The adapted equations softly deform the mesh, given the constraints imposed on the boundaries. Let x and y be the spatial coordinates of the spatial frame, and let X and Y be the reference coordinates of the material's frame.
Laplace's smoothing is the least complex option in terms of computation, since it is linear and uses an equation for each coordinate direction, which are not coupled to each other. On the other hand, there is no mechanism in Laplace's smoothing that prevents the elements inversion. Therefore, the process is most appropriate for small deformations in a linear regime, as the case of our study.
Winslow, hyperelastic and Yeoh smoothing methods are increasingly non-linear, and create a single coupled system of equations for all coordinate directions, making them more complex to solve. They also share the theoretical property that makes that continuous solutions to these equations always have everywhere a positive volume. Unfortunately, this is not necessarily true for discrete finite element solutions. In addition, a positive volume is not sufficient to maintain the elements quality.
So, Laplace's smoothing was selected.
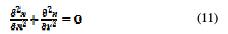
The model is supposed to solve equation 11, and in the transient case it will solve equation 12
Similar equations hold for y coordinates.
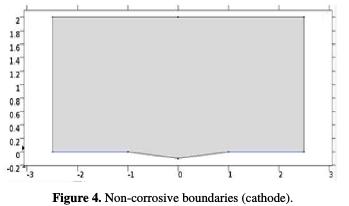
The boundary conditions
Non-corrosive boundaries can be applied to the outer boundaries of an electrolyte or electrode domain, and are typically used to specify a non-corrosive isolator (or symmetry limit) in a problem. The geometric deformation of a non-corrosive boundary is zero in the normal direction of the boundary.
The zero-normal displacement is implemented using point constraints, which are numerically stable. It has been used in our study, since the model's boundaries are planar.
The normal zero displacement equation is:
The electrolyte potential will directly establish the potential value, while the total current density or the average current density will add an additional global degree of freedom to the potential in the electrolyte phase adjusted to conform to the selected condition (Fig. 4).
These conditions are described under these equations:
The model does not contain any film, and the analysis is carried out in an ambient temperature equal to 298 K, and with a zero-external electrical potential.
Presentation of experimental tests
Studied material
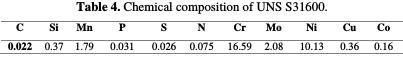
This is a UNS S31600 type 16Cr-10NI stainless-steel alloy, with austenitic structure. It comes in rolled form. The stainless steel chemical composition is given in Table 4.
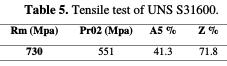
UNS S31600 stainless steel was subjected to a tensile test, to determine its mechanical behavior. Table 5 shows that the selected steel has 730 MPa high tensile stress, and its elastic limit has reached 551 MPa.
Superfinish turning
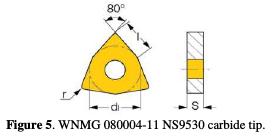
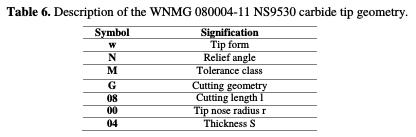
The experiment was conducted on a CNC lathe. Specimens were machined from a blank of four cylindrical bars, with 0.5 m in length, and 11 mm in diameter. They were machined using a dressing tool with a carbide tip (Fig. 5), of which geometry is described in Table 6.
The tool penetrates the work piece by minimizing the friction with the lubricant. For a superfinishing surface quality in the turning operation, it is necessary to choose a suitable cutting parameter.

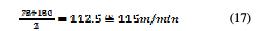
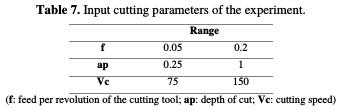
A. Chevallier [43] has mentioned that austenitic stainless steel must be machined with a feed superior to 0.04 mm/rev, and a cutting speed environs 115 m / min. In the one hand, the field experiment uses feed values within the interval of 0.05 mm/tr; 0.2 mm/tr. The upper value of the range (0.2 mm/tr) was selected to remain in the finishing operation, and to avoid the roughing feed range. Based on the feed interval (0.125 mm/tr) average value, corner radius can be calculated according to equation 16 used in mechanical industry. This value is equal to 0.2 mm (0.125*2=0.25&aprox;0.2 mm). In the other hand, the cutting speed adopts a 115 m/min value as the arithmetic average of the selected range, so the interval [75 m/min - 150 m/min] has been chosen (equation 17). Thus, the cutting parameters' experimental design is presented in Table 7.
Localized corrosion tests
Corrosive solution
A 6% NaCl solution was obtained by diluting sea salt with distilled water.
Electrochemical measurements
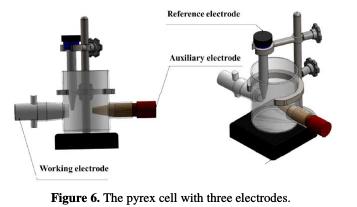
The electrochemical experiments were performed in a pyrex cell with three electrodes (Fig. 6): stainless steel UNS S31600 (1 cm2) as working electrode, platinum as auxiliary electrode and a saturated calomel electrode, SCE, as reference electrode.
The current-potential curve was obtained by operating in potentiodynamic mode; the potential applied to the sample continuously varied with a scanning rate of 5 mV / min. A relatively low scanning rate was chosen to remain in a quasi-stationary regime. The measurements were performed with an assembly comprising a PGZ100 potentiostat-galvanostat, associated with ''voltamaster4'' software. Before curve plot, the working electrode was maintained at a potential of -800 mV for 15 minutes. The tests were carried out maintaining the electrolyte temperature at 25 °C ± 0.1 °C.
Results and discussion
Finite element modeling
The corrosion resistance evolution was studied with the machined surfaces behavior, by a finite element analysis. This study consists in examining the variation of the polarization resistance, Rp, the corrosion potential, Ecorr, and the current density, Icorr, with the average arithmetic roughness, Ra, of the work piece dressed in superfinishing operations under different cutting conditions. A superfinish interval was chosen as study range parameter, of which the corroded model behavior was influenced by the roughness values.
The roughness depth varied between 0 μm and 2 μm, with a 0.1 μm step. So, the finite element analysis was parametric, and it took place by changing the surface roughness.
Fig. 7 (a, b and c) shows the deformation field of the electrolyte potential, according to the three different average roughness values: 2 μm, 1 μm and 0.1 μm, respectively, of the rectangle with 5 μm width and 2 μm height.
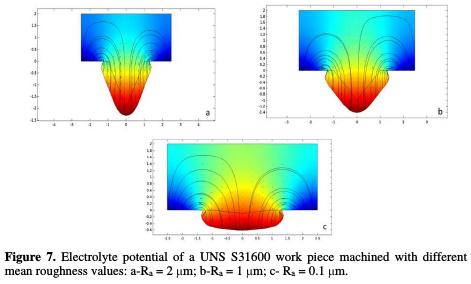
It can be clearly seen that the greatest deformation is localized at the arithmetic roughness value of 2 μm (a).
Fig. 8 shows the evolution of the current-potential characteristic (Tafel trace) of the UNS S3 1600 series stainless steel, in NaCl at 6% by weight solution, for different arithmetic roughness values.
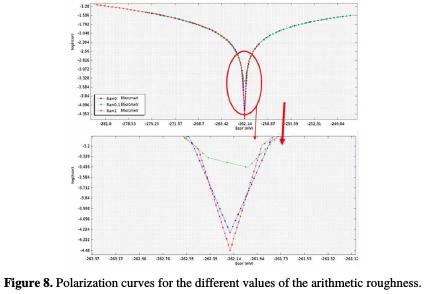
The stainless-steel activity increases with an increase in the arithmetic roughness; therefore, the transition zone of the anodic reaction towards the cathodic reaction proceeds in an irreversible and slow manner, being influenced by the arithmetic roughness of the samples manufacture. The response of the current density, I, as a function of the potential, E, is clearly modified as a function of the roughness, Ra. The field of inertia is the same for all parts; however, the active range is different according to the UNS S31600 surface roughness.
On the Tafel plot, we clearly observe the impact of the average roughness on the corrosion potential shift to k negative values, which will induce a larger and easier chloride ions incorporation or diffusion. In other words, this enlargement conducts to an increase in this stainless-steel alloy dissolution rate (Fig. 8).
The corrosion current density varies with the increase in surface condition (Fig. 9).
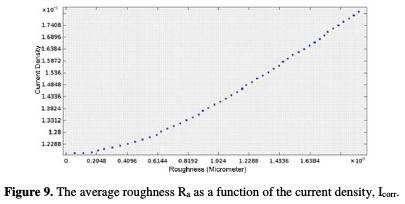
The higher is the surface quality over the current density, the lower is the latter. The average roughness of 2 μm corresponds to a current density of 181.284 mA / m2. The average roughness of 1 μm corresponds to 140.144 mA / m2, and the average roughness of 0.1 μm has a current density equal to 119.152 mA / m2. This variation confirms the impact of surface roughness on the corrosion current density and, consequently, on the UNS S31600 corrosion rate, which increases with an increased pitting and decreased corrosion potential, with the surface quality degradation. The curve (Ra, Icorr) follows a polynomial interpolation, with a correlation of 0.9992, of which variation of the current density with the mean roughness is described by equation 18.

The finite element study shows that the corrosion potential of a work piece in superfinish turning positively increases (Fig. 10).
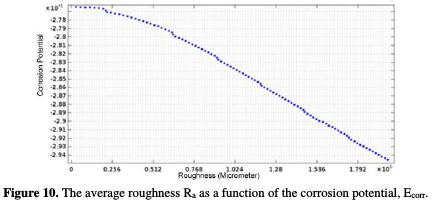
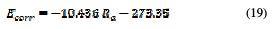
The corrosion potential of Ecorr is positively increased with the decrease in arithmetic roughness values. The lower is the surface quality, the lower is the Ecorr. The curve (Ra, Ecorr) follows a linear interpolation, with a correlation of 0.9952, of which variation of the potential with the average roughness is described by equation 19.
The polarization resistance, Rp, increases with an increasing surface quality. The smaller is the arithmetic roughness, the greater is the polarization resistance. This variation follows a polynomial correlation curve of 0.91 (Fig. 11).
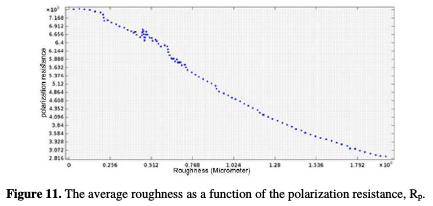
The improvement in the UNS S31600 corrosion resistance is due to the high quality of the machined surface, and to the residual stresses reduction, mainly influenced by the variation in the selected cutting conditions. The curve (Ra, Rp) follows a linear interpolation, with a correlation of 0.974, of which variation of the potential with the average roughness is described by equation 20.

Fig. 12 confirms that the corrosion rate increases with an increasing average surface roughness.
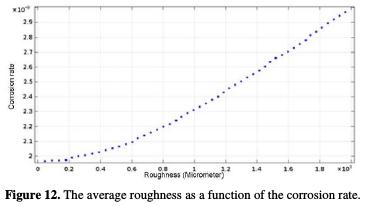
The curve (Ra, Vcorr) follows a linear interpolation, with a correlation of 0.9959, of which variation of the potential with the mean roughness is described by equation 21.

These findings are confirmed in literature by other authors. M. Prakash et al. [17] have showed that the cutting speed affects the machined surface deformation rate and the work piece corrosion rate. They have revealed that the corrosion exposure rates decrease with an increasing cutting speed, thus causing the increase in surface roughness generated by shooting in superfinish. This increase in velocity results in an evolution in the machined surface plastic deformation and, consequently, in the appearance of a β phase which acts as a non-protective film for pitting corrosion. This thin layer characterizes the less smooth surfaces. Hence, the roughness impact on the nobility of the material (the higher the surface quality, the higher is the nobility of the material). On the other hand, for smoother surfaces, α and γ phases occupy more space in the machined surface, acting as protective films against corrosion.
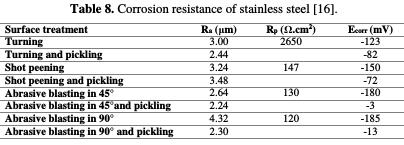
Similarly, V. Zatkalikova et al. [16] have showed that the physical parameters of pitting corrosion were impacted by the average surface roughness of the manufactured parts (Fig. 13).
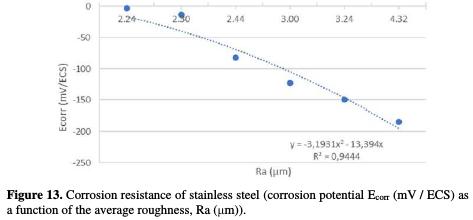
They argue that the nobility of stainless steel decreases (decrease in corrosion potential) with the increase in the average surface roughness value (Table 8).
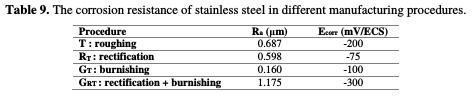
W. Bouzid Sai et al. [11] have arrived at identical results. They have revealed that the decrease in average roughness results in improved corrosion resistance, and, consequently, in an increased pitting potential, which is mainly due to the decrease in residual stress. This may be due to the decrease in the thickness of the smoother surfaces' cold-worked layer (Table 9).
In addition, the surface roughness impacts the pits development. Fig. 14 shows that, as long as the surface quality is high (lower average roughness), the deformation generated by the corrosion decreases, and its depth is reduced.
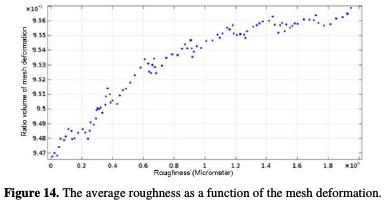
In order to study this development, a volumetric ratio of the mesh geometric deformation was admitted in the study. According to Fig. 14, the pit improvement varies from a value to another. The corroded surface has progressively manifested a low surface quality (Ra = 2 μm). However, as long as the machining generates a higher surface quality (roughness towards zero), the surface is protected against pitting corrosion. Therefore, the cutting parameters are very important. They directly impact the work piece, and it contributes to the fight against the degradation [44].
Similarly, finite element analysis confirms that the electrochemical reaction rate of the individual components is influenced by the average roughness, and, consequently, by the machining cutting parameters (Fig. 15).
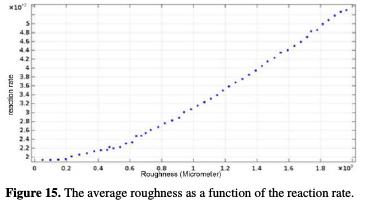
It increases with an increasing roughness. The curve (Ra, Vreaction) follows a linear interpolation, with a correlation of 0.9979, of which variation of the potential with the mean roughness is described by equation 22.

Experimental validation
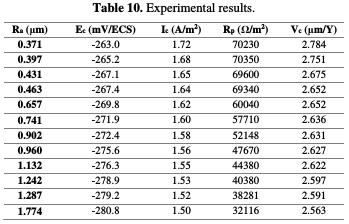
The corrosion potential, corrosion current density, polarization resistance and corrosion rate values, for the various superfinished turning specimens, are reported according to their surface roughness in Table 10.
The comparison between the experimental results (Table 11) and the modeling results was carried out, in order to test the model performance, to predict the alloy corrosion behavior.
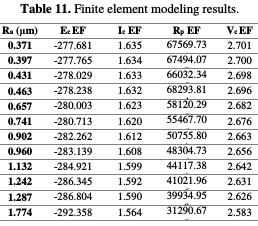
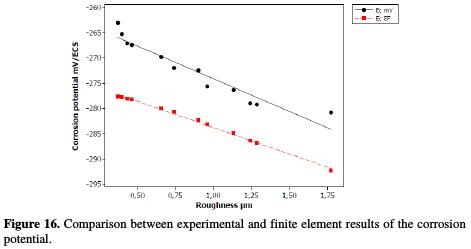
Table 12 shows that the finite element corrosion potential values do not exceed a 6% error, and Fig. 16 illustrates that the corrosion potential has a remarkable correlation (0.9176) with the roughness, in a linear interpolation, which is described by the following equation:
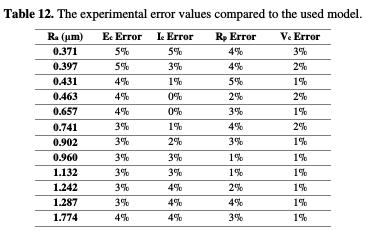

With regard to the corrosion current density, the variation of the modeled and practical values does not exceed 5%. Fig. 17 illustrates this difference between the adapted model values and the practical current density values.
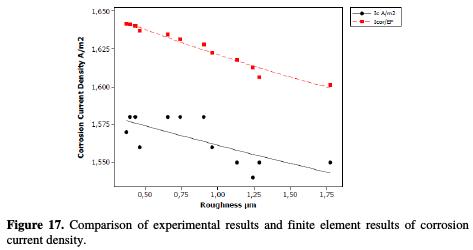
The polynomial regression of the practical currents density points' distribution approximates the theoretical values distribution, with a correlation of 0.9553. Its equation of variation is:

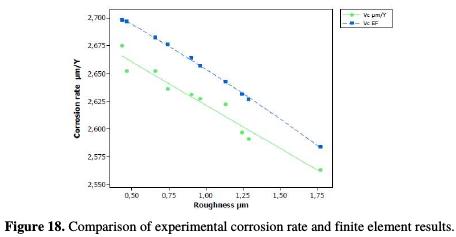
Consequently, the actual corrosion rate follows a linear interpolation on the roughness with that of the values generated by the finite element model, with a correlation of 0.951. Its distribution follows the following equation (Fig. 18):

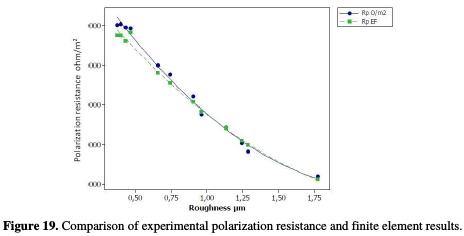
The same observation was made for the polarization resistance, with a correlation of 0.9564 and a distribution of points that follow the following linear equation (Fig. 19):

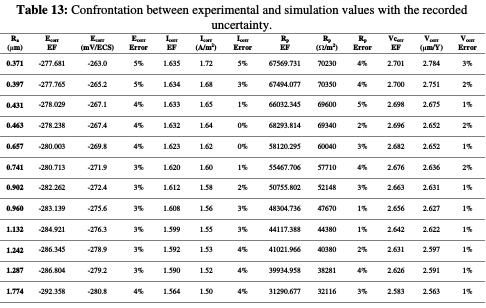
The difference between the theoretical and practical values refers, on the one hand, to the chemical additives found in the UNS S31000 stainless steel alloy. Nickel and chromium [45, 46], as well as molybdenum [47, 48, 49], influence the alloy's physical parameters and its electrochemical behavior. Consequently, the theoretical results, compared to the practical ones, have been excluded from a minor error. On the other hand, the increase in the depth of cut and the cutting speed generates a remarkable vibration at the level of the cutting tool, accompanied by an increase in the temperature produced by the tool friction with the workpiece. Stainless steel is known for its poor temperature dissipation [50]. The cutting edges formation, generated by the machining process, is accompanied by high cutting forces and heat dissipation, due to its low thermal conductivity; then, it generates residual stresses that accelerate corrosion [51], and, consequently, these constraints negatively influence the nobility of the material, and generate an active behavior, translated by a potentials shift towards the electronegative values with the increase in constraints and depth of pass. These interpretations were approved by Bissey-Breton et al. [20]. They have found that the surface roughness and the residual stresses are strongly correlated with the corrosion potential (Table 13).
Conclusion
In this work, we have tested an austenitic stainless-steel alloy UNS S31600 in a NaCl solution at 6% by weight, in order to identify the alloy pitting localized corrosion behavior with the machining average roughness.
The results presented in this study confirm that the stainless steel superfinish turning impacts the localized corrosion resistance, and that the activation is indicated by the corrosion potential shift towards more negative values.
The electrochemical analyzes have revealed the following points:
• The physico-chemical parameters of corrosion, polarization resistance, corrosion rate, corrosion potential, and current density have a significant correlation with the surface roughness obtained by superfinishing machining operation.
• A remarkable affinity between finite element modeling results and practical results. The model we have developed in this study is used to describe the behavior towards corrosion of a UNS S31600 part, machined in superfinish, in a reliable, efficient manner, and with a deviation not higher than 5%.
• Finite element modeling confirms that the Fe / H2O (chlorinated) electrochemical cell is adequate to predict UNS S31600 stainless steel corrosion behavior.
• A good confrontation between the plastic deformation depth obtained by the machining, and the pit development on the surface machined in superfinish operation.
• The reaction rate has a significant influence on the work piece surface quality.
Nomenclature
Ra: Average Roughness (μm)
f: Feed per revolution (mm/tr)
rε: Corner Radius. (mm)
ap: Depth of cut. (mm)
Vc: Cutting speed. (m/min)
I: Charge transfer current density (A.m-2)
I0: Current density of the electrode reaction at equilibrium (A.m-2)
Ia: Anodic partial Current density. (A.m-2)
Ib: Cathodic partial Current density. (A.m-2)
il: Current density vector.
itotal: Total interface current density in EF. (A.m-2)
iloc: Local current density. (A.m-2)
idl: Inward electrolyte current density. (A.m-2)
Z: valence of metal
F: Faraday constant (96500 C.mol-1)
α: the anode charge transfer coefficient (0 <α <1)
η : overvoltage. (mV)
βa : Tafel slope of anodique process
βc: Tafel slope of cathodique process
Vcorr: Corrosion rate. (μm/Y)
φl: corrosion potentiel in EF.
σl: Electrolyte conductivity.
Rp: Resistance dof polarization (Ω.cm2)
Ecorr: corrosion Potential (mV/ECS)
Qk : Term from a general source
k: Index which is l for the electrolyte or s for the electrode
σk: denotes the conductivity (unit S / m)
φk: the potential (unit V)
T: Temperature (Kelvin)
x and y: Spatial coordinates of the spatial frame
X and Y: Reference coordinates of the frame of the material
N and n: Normal vector in Noncorroding Boundary
Ci: Concentration of the ion i (mol/m3)
um,i: its mobility. (s.mol/kg)
u: the velocity vector. (m/s)
zi: charge number.
References
1. Endrino J, Fox-Rabinovich G, Gey C. Surf Coat Technol. 2006;200:6840. [ Links ]
2. Asilturk I, Cunkas M. Expert Syst Appl. 2011;38:5826. [ Links ]
3. Grzesik W, Zak K. J Mater Proc Technol. 2012;212:315. [ Links ]
4. Valiorgue F, Rech J, Hamdi H, et al. Int J Machin Tools Manuf. 2012;53:77. [ Links ]
5. Stenberg N, Proudian J. Procedia CIRP. 2013;8:258. [ Links ]
6. Abboud E, Shi B, Attia H. Procedia CIRP. 2013;8:63. [ Links ]
7. Caruso S, Di Renzo S, Umbrello D, et al. Adv Mater Res. 2011;223:960. [ Links ]
8. Pu Z, Umbrello D, Dillon Jr O, et al. J Manuf Proc. 2014;16:335. [ Links ]
9. Liu CR, Mittal S. Rob Comp lnteg Manuf. 1995;12:15. [ Links ]
10. Navas GV, Gonzalo O, Bengoetxa I. Int J Machin Tools Manuf. 2012;61:48. [ Links ]
11. Sai WB, Triki E. Trans Canad Soc Mechan Eng. 2006;30:183. [ Links ]
12. Gurvich L, Shubadeeva L. All-Union Aviation Materials Scientific-Research Institute, Translated from FizikoKhimicheskaya Mekhanika Materialov. 1971;7:23. [ Links ]
13. Szklarska-Smialowska S. Pitting and crevice corrosion. Houston, Texas: NACE Int; 2005. [ Links ]
14. Zuo Y, Wang H, Zhao J, et al. Corros Sci. 2002;44:13. [ Links ]
15. Sasaki K, G. Burstein G. Corros Sci. 1996;38:2111.
16. Zatkalikova V, Liptakova T. Mater Eng. 2011;18:115. [ Links ]
17. Prakash M, Shekhar S, Moon A, et al. J Mater Proc Technol. 2015;219:70. [ Links ]
18. Lee SM, Lee WG, Kim YH, et al. Corros Sci. 2012;63:404. [ Links ]
19. Gravier J, Vignal V, Bissey-Breton S, et al. Corros Sci. 2008;50:2885. [ Links ]
20. Bissey-Breton S, Gravier J, Vignal V. Procedia Eng. 2011;19:28. [ Links ]
21. Yin S, Li D. Mater Sci Eng A. 2005;394:266. [ Links ]
22. Robin A, Santana-Martine GA, Suzuki PA. Mater Design. 2012;34:319. [ Links ]
23. Szklarska-Smialowska Z. Pitting corrosion of metals. United States: NACE; 1986. [ Links ]
24. Sharland SM, Jackson CP, Diver AJ. Corros Sci. 1989;29:1149. [ Links ]
25. Mousson J, Vuillemin B, Oltra R, et al. Corrosion. 2004. [ Links ]
26. Galvele J. Corros Sci. 1981;21:551. [ Links ]
27. Laycock N, White S. J Electrochem Soc. 2001;148:B264. [ Links ]
28. Burstein G, Pistorius P, Mattin S. Corros Sci. 1993;35:57. [ Links ]
29. Sharland S, Jackson C, Diver A. Corros Sci. 1989;29:1149. [ Links ]
30. Gartland P. Modeling of crevice corrosion. Proceedings of Corrosion; 1996; Denver. [ Links ]
31. Walton JCK. Corros Sci. 1996;38:1. [ Links ]
32. Turnbull A, Thomas JGN. J Electrochem Soc. 1982;129:1412. [ Links ]
33. B. Malki B, Baroux B. COMSOL Multiphysics User's Conference; 2005; Grenoble, France.
34. Blondel P, Girardin G. COMSOL's Multiphysics User's Conference; 2005; Paris. [ Links ]
35. Amri J, Gulbrandsen E, Nogueira R. Corros Sci. 2010;52:1728. [ Links ]
36. Stroe M, Oltra R, Vuillemin B et al. COMSOL Multiphysics Users Conference; 2007; Grenoble, France. [ Links ]
37. Krawiec H, Vignal V, Akid R. COMSOL Multiphysics Users Conference; 2007; Grenoble, France. [ Links ]
38. Li L, Wang C, Chen S, et al. Electrochim Acta. 2008;53:3109. [ Links ]
39. Pourbaix A, L'Hostis V. J Phys IV. 2006;136:71.
40. Popov BN. Corrosion engineering; principles and solved problems. Amsterdam: Elsevier; 2015. [ Links ]
41. Caceres L, Vargas T, Herrera L. Corros Sci. 2009;51:971. [ Links ]
42. Galvele J. Corros Sci. 2005;473053. [ Links ]
43. Chevalier A, Bohan J. Guide du technicien en productique. Paris: Hachette Livre; 1996. [ Links ]
44. Ech-Charqya Y, Gzirib H, Essahli M. Port Electrochim Acta. 2016;34:143. [ Links ]
45. Zhang Z, Jing H, Xu L, et al. Appl Surf Sci. 2017;394:297. [ Links ]
46. Qu H, Chen H, LangY. Construction Build Mater. 2016;125:427. [ Links ]
47. Li D, Chen D, Liang P. Ultrasonics Sonochem. 2017;35:375. [ Links ]
48. Loable C, Vicosa IN, Mesquita TJ, et al. Mater Chem Phys. 2017;186:237. [ Links ]
49. Jinlong L, Tongxiang L, Chen W. Mater Lett. 2016;171:38. [ Links ]
50. Fernandez-Abia AI, Garcia JB, de Lacalle LNL. High-performance machining of austenitic stainless steels. Leon: Woodhead Publ Ltd; 2013. [ Links ]
51. Tampu NC, Chirita B, Herghelegiu E, et al. Indian J Eng Mater Sci. 2014;21:283. [ Links ]
*Corresponding author. E-mail address: y.echcharqy@uhp.ac.ma
Received June 4, 2017; accepted August 8, 2017

