


Serviços Personalizados
Journal
Artigo
 Inglês (pdf)
 Artigo em XML
 Referências do artigo
 Enviar este artigo por email
Indicadores
-
 Citado por SciELO
 -
 Acessos
Links relacionados
-
 Similares em
SciELO
Similares em
SciELO
Compartilhar

 Permalink
Portugaliae Electrochimica Acta
versão impressa ISSN 0872-1904
Port. Electrochim. Acta vol.36 no.3 Coimbra maio 2018
https://doi.org/10.4152/pea.201803197
Adsorption and Corrosion Inhibition Effect of 2-Mercaptobenzimidazole (Surfactant) on a Carbon Steel Surface in an Acidic Medium: Experimental and Monte Carlo Simulations
F. El-Hajjajia , M.E. Belghitib , B. Hammoutib , S. Jodehc,* , O. Hamedc , H. Lgazd,e and R. Salghid
a Laboratory of Electrochemistry Engineering, Modelling and Environment (LIEME), Faculty of Science/University Sidi Mohammed Ben Abdellah, Fes, Morocco
b Laboratory of Applied Chemistry, Materials and Environment (LC2AME), COSTE, Faculty of Science, Oujda, Morocco
c Department of Chemistry, An-Najah National University, P.O. Box 7, Nablus, Palestine
d Laboratory of Applied Chemistry and Environment, ENSA, Ibn Zohr University, P.O. Box 1136, 80000 Agadir, Morocco
e Laboratory of Separation Processes, Faculty of Science, Ibn Tofail University, P.O. Box 242, Kenitra, Morocco
ABSTRACT
Experimental electrochemical methods, combined with Monte Carlo simulations, have been employed to investigate the possibility of using 1-decyl-2-(decylthio)-1H- benzimidazole (T2) as corrosion inhibitor for mild steel in a 1 M HCl medium. This inhibitor was found to be of the mixed type. The results derived from EIS indicate that the charge transfer resistance has increased with the increase in the inhibitor concentration. The inhibitory mechanism was explored by the potential of zero charge (Epzc) measurement at the solution/metal interface. The inhibitor adsorption has followed Langmuir adsorption isotherm. Surface morphology results showed the compound adsorbed film on a mild steel surface. The molecule interactions with the mild steel surface were simulated based on Monte Carlo simulation approach using Fe(111) crystal surface as a representative metallic surface.
Keywords: C-steel; HCl; corrosion inhibitor; EIS; benzimidazole; Monte Carlo simulation.
Introduction
Corrosion is an electrochemical interaction between metals and the environment. It is an undesirable phenomenon, as it can cause severe harm to metals and alloy structures, and economic significances in terms of damaged products replacement. Among metals, steel is most widely used in industries, and it suffers from a certain type of corrosion within some environments. For instance, hydrochloric acid is one of the most aggressive industrial acids, and only few materials, such as glass, can withstand it. It is widely used as a solution for removing undesirable flaking and rusting at several industrial processes [5-7]. So, the industries that involve hydrochloric acid have to search for methods to insulate the steel and prevent it from getting onto a direct contact with HCl. As a result, several approaches were developed for steel protection against corrosion [1-4]. One of the most acceptable approaches is the use of chemical inhibitors. The inhibitors function as an insulator for steel, preventing it from getting into contact with aggressive chemicals. Examples of chemical inhibitors are N- containing organic compounds, which have been widely used as corrosion inhibitors for different metals in distinct corroding media [8-10]. Surfactants have been also used for the same reason; they are composed of hydrophobic moiety and a hydrophilic head. The hydrophilic moiety of the surfactants adsorbs onto the metal surface, while the hydrophobic moiety extends into the solution phase.
Surfactant inhibitors are attractive, since they are available at reduced prices, have low toxicity, and some of them have showed high corrosion inhibition efficiency [1-3, 5, 18].
The adsorption onto the metal surface can be interpreted in two ways: (I) chemical adsorption takes place through charge transfer amidst certain delocalized π-electrons of the molecule and the empty d-orbital of the iron area atom; (II) physical adsorption is carried out viaxthe forces of Van der Waals or electrostatic attraction [11-15]. The combination of the azole ring with the surfactant compounds reinforces the inhibition process, which is interpreted by the intermolecular synergistic effect of various groups of the inhibitor [16-18]. The promising results obtained by a new surfactant called 1-tetradecyl-2- (tetradecylthio)-1H-benzimidazole [19] have led us to prepare another one, 1- decyl-2-(decylthio)-1H-benzimidazole (T2), in which the carbon chain was reduced from 13 to 9; this is the aim of the present study. Potentiodynamic polarization and EIS measurements, as well as SEMxinvestigation and dynamic simulation, were used to explain the inhibitory action at the iron surface.
Experimental details
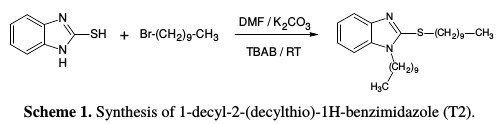
Synthesis of inhibitors
To a solution of 2 g (133×10-4 mol) of 2-mercaptobenzimidazole and 80 mL of N,N-dimethylformamide, 3.67 g (266×10-4 mol) of potassium carbonate, (133×10-4 mol) of tetra-n-butylammonium bromide and 8.8 g (399×10-4 mol) of 1- bromodecane were added. The reaction mixture was stirred at room temperature for 24 hours. After rearward filtration, the solvent was removed under reduced pressure. The residue was taken up in dichloromethane and filtered, and the solvent was evaporated under reduced pressure (Scheme 1).
This product was characterized by interpreting 1H NMR, 13C NMR and mass spectral data (Fig. 1).
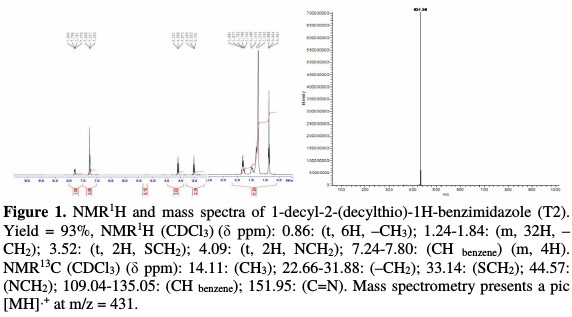
Thus, the 1H-NMR spectrum taken in CDCl3 showed a multiple between 7.24 ppm and 7.80 ppm for the aromatic protons, triplet at 4.09 ppm for NCH2 and at 3.52 ppm for SCH2, a multiple between 1.24 ppm and 1.84 ppm, corresponding to the protons carried by the methylene groups of the hydrocarbon chain, and a triplet at 0.86 ppm for CH3.
Inversely, the 13C NMR spectrum taken in CDCl3 presents a signal at 151.95 ppm for the carbon bonded to the sulfur atom, signals between 31.88 ppm and 22.66 ppm corresponding to the carbon of the methylene groups, and signals at 14.11 ppm for CH3. The mass spectrum shows a molecular pic [MH]•+ at m / z = 431.
Electrochemical experiments
A set of three-electrode cells containing C-steel coupons with a surface of 1 cm2 was incorporated in the specimen holder as working electrode (WE); a large area platinum mesh was used as counter electrode (CE), and saturated calomel as reference electrode (RE) . Electrochemical experiments were conducted at room temperature (308 ± 2 K) using 100 mL of 1 M HCl electrolyte in a stationary state. Before each potentiodynamic polarization (Tafel) and electrochemical impedance spectroscopy (EIS) experiments, the electrode was allowed to freely corrode, and its open-circuit potential (OCP) was written down as ax function of time, for periods smaller than 30 min, but for this time, there was a steady-state OCP, corresponding to the corrosion potential (E) of the working electrode that was obtained. The potentiodynamic Tafel measurements were initiated from the cathodic to the anodic mean, between -800 mV and -200 mV, with a scan rate of 0.6 mV/s. The above procedures were repeated for each T2 concentration. Electrochemical impedance spectroscopy (EIS) measurements were carried out using ac signals of 10 mV peak to peak amplitude, in the frequency range of 100 KHz -10 MHz.
Simulation details
Monte Carlo (MC) simulations have been carried out using adsorption locator modules executed in the BIOVIA Material Studio 8.0 software, commercialized by Accelrys Inc. USA [20, 21]. Geometrical optimization of all compounds has been performed using a DMol3 module in the said software. The involved methodology and course of action using MC simulations can be found elsewhere [22-23]. The simulation of the interaction between the single inhibitor molecule (T2) in the neutral form and the iron (111) surface in an acidic medium was carried out in a simulation box (3.517 × 3.537 × 4.026 nm3) with periodic boundary conditions, to model a general case when the interface has any arbitrary boundary effects. The iron surface Fe(111) was first built and relaxed by minimizing its energy using molecular mechanics; then, it was increased, and its periodicity was changed by constructing a super cell (7×7 nm) and, afterwards, a vacuum slab with 30 Å thicknesses [24]. The whole simulation procedure has used COMPASS Force-Field [25-26], which is an ab-initio force field that makes accurate and simultaneous predictions of gas-phase and condensed-phase properties for a broad range of organic molecules; metal was used for all systems geometrical optimization [25]. The liquid phase, composed of 50 water molecules and 10 HCl molecules, was added to simulate the impact of a solvent, since corrosion takes place in the solution.
Results and discussion
Potentiodynamic polarization
Both anodic and cathodic polarization curves of C-steel in 1 M HCl, for different concentrations of the prepared surfactant, are shown in Fig. 2.
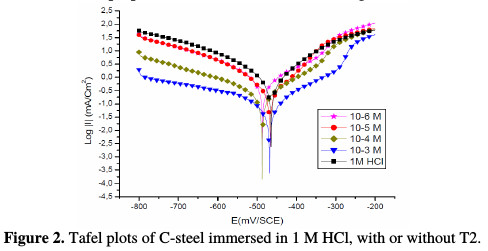
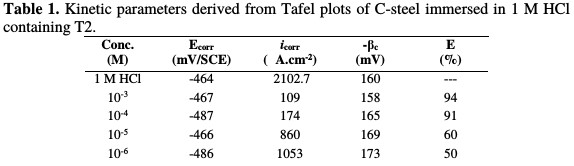
It is clear that the inhibitor presence causes a distinguished decrease in the corrosion rate, that is, decreases the anodic and cathodic curves to lower current densities. This may be due to the inhibitor adsorption onto the corroded surface [26]. The values of the corrosion current densities (icorr), corrosion potentials (Ecorr) and cathodic Tafel slopes (βc) were calculated from Fig. 2, and are depicted in Table 1.
From these results, it is clear that the corrosion current decreases with an increase in the inhibitor concentration. The anodic and cathodic branches change with the increase in the inhibitor concentration. For that reason, the prepared surfactant can be classified as a mixed-type inhibitor in 1 M HCl.
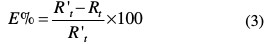
The inhibition efficiency (E %) was calculated by the following expression:
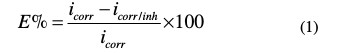
where i corr and icorr/inh are the corrosion current density of C-steel, with and without T2, respectively.
The cathodic Tafel lines were almost parallel upon the increase in inhibitor concentrations, indicating that the hydrogen reduction in the metal surface is activation controlled, and that the mechanism is not impacted by the inhibitor presence [27]. The anodic and cathodic current densities are decreased in the inhibitor presence, while the corrosion potential is almost constant, and the change in Ecorr value is around 20 mV/ SCE, indicating that the inhibitor acts as a mixed-type inhibitor.
Examination of Table 1 reveals that the cathodic Tafel slope (βc) shows slight changes with T2 addition, which suggests that the inhibiting action has occurred by simple blocking of the available cathodic sites on the metal surface, which has led to a decrease in the exposed area, necessary for hydrogen evolution. In addition, the inhibitory action increases with an increased inhibitor concentration. At a concentration of 10-3 M or more, T2 acts as a good inhibitor in a hydrochloric acid solution, with an inhibition efficiency of about 94%.
Electrochemical impedance spectroscopy (EIS)
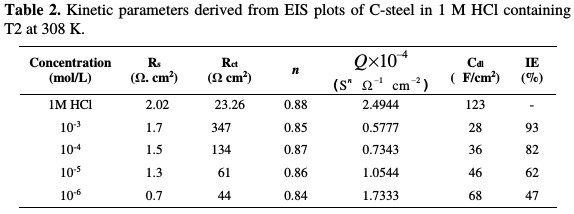
The effect of each acid additive on the performance of T2 as a corrosion inhibitor for C-steel immersed in molar acid concentration was investigated by EIS experiment. The data obtained by EIS measurements are graphically represented by the Nyquist plot (Fig. 3) and the impedance parameters of each solution, such as polarization resistance (Rp), double layer capacitance (Cdl), and inhibition efficiency (IE %)) are given in Table 2.
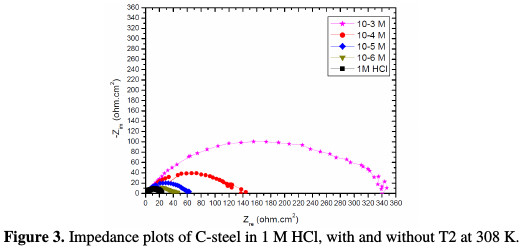
The Nyquist impedance semicircles increase with an increased content of T2, indicating an increase in the diameter of the capacitive loop. T2 acts by adsorption, to cover the metal surface, and then retard the corrosion phenomenon [28].
The impedance diagrams are semicircles, due to the frequency dispersion [29-31] caused by the roughness and inhomogeneity of the electrode surface. The increase in T2 concentration leads to the increase of transfer resistance, as well as to the decrease of capacitance, as a result of the change in the dielectric properties and the thickness of the barrier-adsorbed film [32-34]. Impedance parameters such as the charge transfer, Rt, and the double layer capacitance, Cdl, are derived from Nyquist plots, and are gathered in Table 2, for C-steel in an hydrochloric acid solution, in the presence and absence of T2. The decreased values of double layer capacitance, Cdl, can be due to water molecules that are substituted by organic inhibitor molecules at the electrode interface of lower dielectric constant through adsorption [35].
The equivalent circuit model shown in Fig. 4 was used to analyse the EIS experiments.
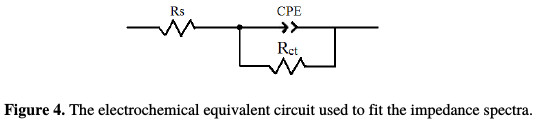
The parameters are collected in Table 2, while the double layer capacitance values are calculated using the Eq. (2):
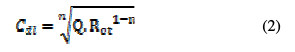
where Q is the CPE constant and n is a coefficient that can be used as a measure of surface inhomogeneity [27]. The inhibition efficiency was calculated using the charge-transfer resistance values in the following equation:
where Rt and R't are the charge-transfer resistance values, without and with inhibitor, respectively.
It is clear from the Table 2 data that Rt increases with T2 concentration, which causes an increase in the corrosion inhibition efficiency (E%). Double layer capacitance values are also brought down to the maximum extent in the inhibitors presence. The decrease in Cdl is due to the adsorption of this compound onto the metal surface, leading to the formation of a film from the acidic solution [36-38].
The potential of zero charge and the inhibition mechanism Corrosion inhibition mechanisms are interpreted by adsorption phenomena, which depend on the metal surface charge, the charge or dipole moment of the inhibitor ions/molecules, and the other ions that are specifically adsorbed onto the metal surface [39]. The metal surface charge is defined by the open circuit potential position, with respect to PZC [40]. The double layer capacitance value depends on the applied DC potential, which is graphically denoted in Fig. 5.
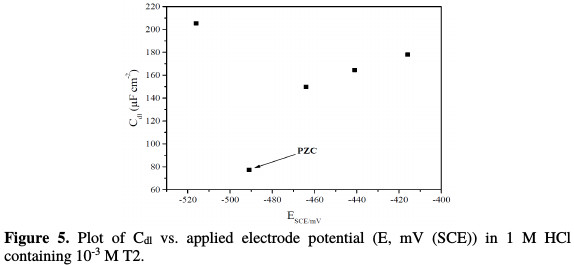
It can be determined, according to Antropov et al. [41], by comparing the potential of zero charge (PZC) and the corrosion potential of the metal in the electrolytic medium. As PZC corresponds to a state where the surface is free from charges - the stationary (corrosion) potential state -, the metal area will be positively or negatively charged. Hence, it is essential to have reliable data about PZC. When carbon steel is immersed in an acidic solution containing T2, three kinds of species can be adsorbed onto its surface, as described below: (1) if the metal surface is positively charged with respect to PZC, at first, the chloride ions will be adsorbed onto the metal surface. Then, after this adsorption step, the steel surface will become negatively charged. Hence, the positively charged derived 2- mercaptobenzimidazole cationic forms will form an electrostatic bond with the Cl- ions already adsorbed onto steel. Moreover, the excess positive charge on the electrode surface, Φ (Φ = EPZC - Ecorr) increases as more inhibitor molecules are adsorbed onto it [42]; (2) if the metal surface is negatively charged with respect to PZC, the protonated water molecules and derivedx2-mercaptobenzimidazole cationic forms will be directly adsorbed onto the metal surface. Increasing negative charges on the metal surface leads to an increased adsorption of derived 2-mercaptobenzimidazole molecules, hence, its concentration in the solution should decrease; (3) when the metal obtains the potential at which the surface charge becomes zero, none of the ions (neither cations nor anions) adsorb onto the surface through their ionic center. However, a few indole molecules may be physically adsorbed through their planar π orbitals onto the metal surface (with vacant π orbitals).
In this study, EPZC = -491 mV and Ecorr = -460 mV, for C-steel with the addition of 10-3 M of T2. It can be said that Φ (Φ = EPZC - Ecorr) potential is positive in this case. From the above result, it follows that anions (Cl- ions) in an aqueous hydrochloric acid solution will be first adsorbed onto the C-steel surface. After this first adsorption step, the C-steel surface will become negatively charged. Hence, the positively charged 2-mercaptobenzimidazole derivative cationic forms will form an electrostatic bond with the Cl- ions already adsorbed onto the steel surface.
Adsorption isotherm and adsorption parameters
The adsorption isotherms provide basic information about the interaction between the inhibitor and the C-steel surface. Attempts were made to fit the experimental data to various isotherms, including Langmuir, Frumkin, Temkin, etc. It has-been found that the experimental results for T2 in this study fit with Langmuir isotherm and the organic compound adsorption. The isotherm mostly used in biosensor research is the Langmuir isotherm, which is based on the following hypotheses: (i)-the surface supposed to be defined by a number of adsorption sites given by the surface concentration is totally covered; (ii)-there is an equilibrium between adsorbed and bulk target species and; (iii) there are no lateral interactions between the adsorbed target species [43].
Generally, the adsorption of an inhibitor occurs by two means: physisorption and/or chemisorption. The first one involves a weak undirected interaction, due to electrostatic attraction between inhibiting organic ions or dipoles and the electrically charged metal surface. The latter one occurs by sharing or charge transfer from the adsorbate to metal surface atoms, in order to form a coordinated bond; this interaction is known as chemical adsorption or chemisorption [44-46].
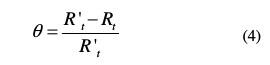
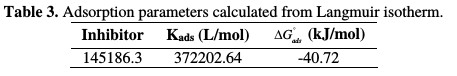
In order to obtain the adsorption isotherm, the degree of surface coverage (θ) for various inhibitor concentrations was calculated using the equation below, listed in Table 3.
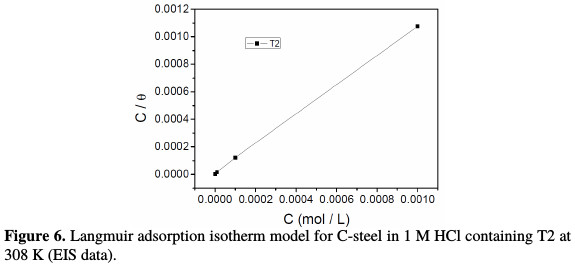
Langmuir adsorption isotherm was tested for its fit (Fig. 6) to the experimental data, and it is given by the following equation:
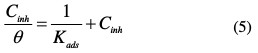
where Cinh is the inhibitor concentration, Kads the adsorptive equilibrium constant, and θ represents the degree of adsorption.
The equilibrium constant for the adsorption process was related to the standard free energy of adsorption by the expression
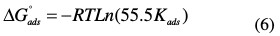
where R is the gas constant, T is the experiment absolute temperature, and the constant value of 55.5 is the concentration of water in a solution in mol L-1. The plot of the (Cinh /θ) vs. Cinh that fitted the experimental data follows well the Langmuir adsorption isotherm. The plot gives a straight line with a slope of 1.06 to close unity. The intercept that has obtained 6.8877 × 10⁻⁶ is the reciprocal of Kads. This shows that the experimental data fit the isotherm. The values of Kads and ΔGoads calculated from the isotherm model are listed in Table 3.
Generally, the energy values of -20 kJ moL-1 or less are associated with an electrostatic interaction between charged molecules and charged metal surface, i.e., physisorption; but those with energy values of -40 kJ moL-1 or less involve charge sharing or charge transferring from the inhibitor molecules to the metal surface, to form a coordinate covalent bond, i.e., chemisorption [47-49]. The value of ΔGads is equal to -40.72 kJ moL-1. The large value of ΔGads and its negative sign is usually characteristic of a strong interaction and a highly efficient adsorption [50]. The high value of ΔGads shows that, in the presence of 1 M HCl, T2 chemisorption may occur. The possible conception mechanisms can be attributed to the donation of π-electrons in the aromatic rings; the presence of two nitrogen atoms and one sulfur atom in an inhibitor molecule, as reactive centers, is an electrostatic adsorption of the protonated inhibitor compound in an acidic solution, onto the metal surface.
The results indicate that the increase in the inhibitor efficiency (IE%) with an increased concentration may be attributed to the formation of a barrier film, which prevents the acidic medium from attacking the metal surface, due to the inhibitor adsorption (T2) onto the C-steel surface, involving interactions between the π-electrons of the benzimidazole and phenyl rings heterocyclic structure, as well as (-S-, =N) between heteroatoms and iron surface atoms vacant orbitals (3d). We clearly assist to the intermolecular synergistic effect of various T2 adsorption centers [51].
SEM investigation
SEM photographs obtained from C-steel surface, after the specimen immersion in HCI (1 M) solution for 6 h, in the absence and presence of 10-3 M of T2, are shown in Fig. 7(a) and (b).
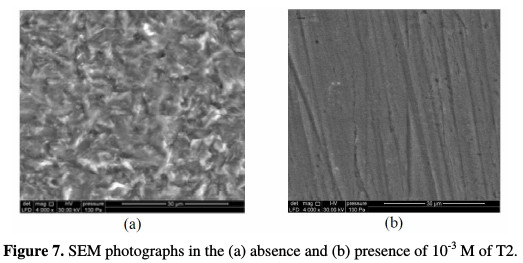
Fig. 7(a) shows that the C-steel surface was strongly damaged in hydrochloric acid, in the absence of T2 inhibitor; Fig. 7(b) shows that there is a good protective film against corrosion, adsorbed onto the C-steel surface, with 10-3 M of T2.
Monte Carlo simulations
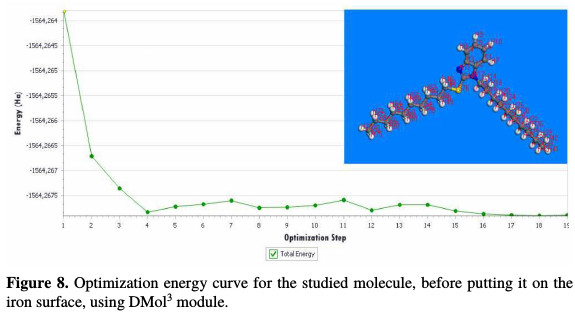
MC simulation has emerged as a modern tool to investigate the adsorption behavior of a single inhibitor in the neutral form, on an iron surface in an acidic medium [21, 22]. MC simulation can reasonably predict the most favorable configuration of the adsorbed inhibitor molecule on the iron surface. The geometry optimization process is carried out using an iterative process, in which the atomic coordinates are adjusted until the total energy of a structure is minimized, i.e., it corresponds to a local minimum in the potential energy surface. The optimization energy curve of the inhibitor (T2), before putting it on the iron surface, is calculated by DMol3 module at m-GGA-M11-L/ DNP+ basis set, as presented in Fig. 8.
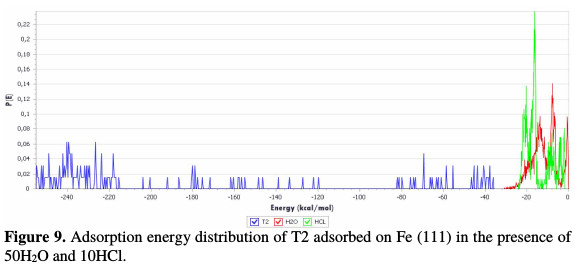
T2 optimization energy curve in the neutral form was done using adsorption locator module. The adsorption energy distribution of T2 adsorbed on Fe (111) in the presence of 50H2O and 10HCl, using adsorption locator module, is depicted in Fig. 9.
The selected inhibitor molecule (T2) was placed on the iron surface in a hydrochloric acid solution, optimized, and then run under quench molecular dynamics. A typical adsorption energy distribution of T2 adsorbed on Fe (111) in the presence of 50H2O and 10HCl consisting of the total energy, average total energy, Van der Waals energy, electrostatic energy and intermolecular energy, using Monte Carlo simulations, is depicted in Fig. 10.
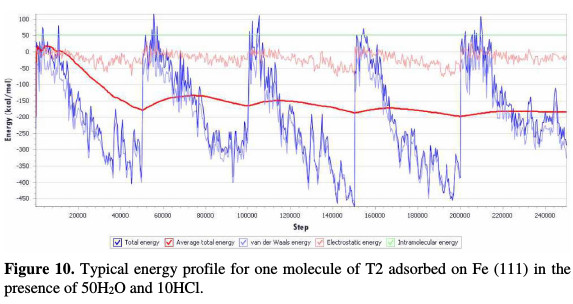
The Metropolis Monte Carlo method in adsorption locator calculation provides four step types for a canonical ensemble: conformer, rotation, translation and regrowth [52]. Fig. 10 shows the most suitable inhibitor molecule conformation adsorbed onto the substrate (111), obtained by adsorption locator module (COMPASS Force Field) [25]. Side and top views of stable adsorption configurations of T2 adsorbed on Fe (111) in the presence of 50H2O and 10HCl using adsorption locator is given in Fig. 11.
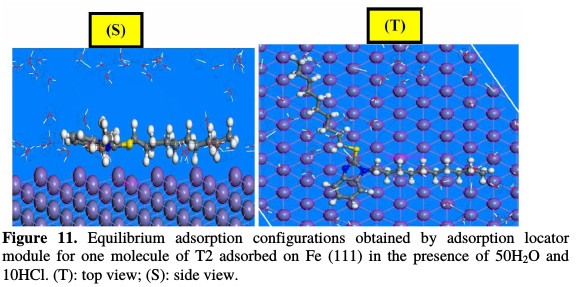
The equilibrium configuration of T2 adsorbed on Fe (111) in the presence of 50H2O and 10HCl as well as the close contact of the Fe-inhibitor complex, are depicted in Fig. 11. T2 is adsorbed onto the Fe(111) surface in a hydrochloric acid solution, with almost parallel or flat dispositions. This flat orientation is possibly due to the formation of coordination and back bonding for the Fe- inhibitor (T2) complex. It is also herein evident that unoccupied iron orbitals (3d) will prefer to accept electrons from the adsorbed T2. T2 has a lone pair of electrons on the active centres (=N11-, =N12, -S76-), as well as π-electrons in the benzimidazole ring. Those iron atoms and electrons (π) cloud in the aromatic rings provide sufficient electronic charge to the vacant orbitals (3d) of Fe, forming stable coordination bonds (chemisorption). The measured shortest bond distance between the closest heteroatoms (=N11-, =N12, -S76-) of the neutral form of T2 inhibitor and iron surface (111), in a hydrochloric acid solution at equilibrium, was as follows: Fe-inhibitor (T2) interaction: (dFe-S76-=3.294Å, dFe- N12=3.28Å and dFe-N11=3.38Å). All the shortest bond distances were less than 3.55A°, indicating a strong chemical bond formation between T2 and Fe (111) surface. However, vdW interactions were also involved in the adsorption process of the inhibitor with Fe (111). The outputs and descriptors using adsorption locator module, such as total adsorption, adsorption energy, rigid adsorption and deformation energies, are listed in Table 4.
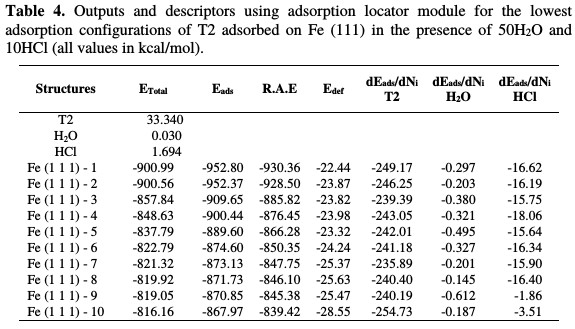
The parameters presented in Table 4 include total energy of T2 adsorbed on Fe (111) in the presence of 50H2O and 10HCl, which is defined as the sum of the T2 inhibitor energies, the rigid adsorption energy (RAE), and the deformation energy (Edef). The substrate energy (iron (111) surface) is taken as zero. In addition, adsorption energy (Eads) reports energy in Kcal/mol, released (or required) when the relaxed inhibitor, HCl and water molecules are adsorbed on the iron (111) surface. The adsorption energy is defined as the sum of the rigid adsorption energy and the deformation energy for T2 inhibitor. The rigid adsorption energy reports the energy in kcal/ mol, released (or required) when the unrelaxed inhibitor and water molecules (i.e., before the geometry optimization step) are adsorbed onto the iron surface. The deformation energy reports the energy in kcal/mol, released when the adsorbed molecules are relaxed on the substrate surface. Table 4 also shows (ΔEads/dNi), which reports the energy in kcal/mol, of inhibitor/iron surface configurations, where one of the inhibitors has been removed.
It is quite clear from Table 4 that the value of adsorption energy is negative, which denotes that the adsorption could spontaneously occur. The largest negative adsorption energies value is -871.73 kcal/mol, indicating the system with the most stable and stronger adsorption [53]. In all cases, the inhibitor adsorption energies are far higher than those of water molecules. This indicates the possibility of gradual substitution of H2O and HCl molecules from the iron surface, resulting in the formation of a stable layer, which can protect the iron from aqueous corrosion (chemical adsorption).
Conclusion
In this work, we have synthesized a new compound derivative of 2- mercaptobenzimidazole, susceptive to present interesting surfactant properties. We have shown that the compound presents a good inhibition property for the corrosion of C-steel in a hydrochloric acid solution; polarization curves have indicated that the inhibitor mainly behaves as a mixed-type inhibitor. EIS has showed that the charge transferring controls the corrosion inhibition process in the uninhibited and inhibited solutions. Different inhibition mechanisms were proposed for T2 molecules, based on their PZC value in the studied conditions. The adsorption of T2 has followed Langmuir adsorption isotherm model. Dynamic simulation confirms the displacement of water molecules by the organic inhibitor.
References
1. Hegazy M. J Mol Liq. 2015;208:227. [ Links ]
2. Qing W, Xuemei M, Haiyan S, et al. J Chin Soc Corros Prot 2015;35:49. [ Links ]
3. Qiu L-G, Xie A-J, Shen Y-H. Mater Chem Phys. 2005;91:269. [ Links ]
4. Maayta A, Bitar M, Al-Abdallah M. Br Corros J. 2001;36:133. [ Links ]
5. Villamil RF, Corio P, Agostinho SM, et al. J Electroanal Chem. 1999;472:112. [ Links ]
6. Branzoi V, Golgovici F, Branzoi F. Mater Chem Phys. 2003;78:122. [ Links ]
7. El Aal EA, El Wanees SA, Farouk A, et al. Corros Sci 2013;68:14. [ Links ]
8. Serreau L, Beauvais M, Heitz C, et al. J Colloid Interface Sci. 2009;332:382. [ Links ]
9. Gaysinski M, Le Forestier J, Cambon A, et al. J Fluor Chem. 1997;83:175. [ Links ]
10. Hosseini M, Mertens SF, Arshadi MR. Corros Sci. 2003; 45:1473. [ Links ]
11. Mu G, Zhao T, Liu M, et al. Corrosion. 1996; 52:853. [ Links ]
12. Elachouri M, Hajji MS, Salem M, et al. Corrosion. 1996;52:103. [ Links ]
13. Zarrouk A, Zarrok H, Salghi R, et al. J Mater Env Sci. 2013;4:177. [ Links ]
14. Manssouri M, El Ouadi Y, Znini M, et al. J Mater Env Sci. 2015;6:631. [ Links ]
15. Fouda A, Shalabi K, Ezzat R. J Mater Environ Sci. 2015;6:1022. [ Links ]
16. Abdel-Azim A, Milad R, El-Ghazawy R, et al. Egypt J Pet. 2014;23:15. [ Links ]
17. Benabdellah M, Tounsi A, Khaled K, et al. Arab J Chem. 2011;4:17. [ Links ]
18. Alaoui KI, El Hajjaji F, Azaroual M, et al. J Chem Pharm Res. 2014;6:63. [ Links ]
19. Chakib I, Elmsellem H, Sebbar N, et al. J Mater Env Sci. 2016;7:1866. [ Links ]
20. Metropolis N, Rosenbluth AW, Rosenbluth MN, et al. J Chem Phys. 1953;21:1087. [ Links ]
21. Accelrys Inc. san Diego: Materials Studio, Revision 6.0; 2013. [ Links ]
22. Belghiti ME, Karzazi Y, Tighadouini S, et al. J Mater Env Sci. 2016;7:956. [ Links ]
23. Belghiti ME, Karzazi Y, Dafali A, et al. J Mol Liq. 2016;216:874. [ Links ]
24. Karzazi Y, Belghiti M, El-Hajjaji F, et al. Environ. Sci. 2016;7:3916. [ Links ]
. Sun H, Ren P, Fried J. Comput Theor Polym Sci. 1998;8:229.
26. Sun H. J Phys Chem B. 1998;102:7338. [ Links ]
27. Lgaz H, Bhat KS, Salghi R, et al. J Mol Liq. 2017;238:71. [ Links ]
28. Enumula S, Pangal A, Gazge M, et al. Res J Chem Sci. 2014;4:78. [ Links ]
29. El-Hajjaji F, Greche H, Taleb M, et al. J Mater Env Sci. 2016;7:566. [ Links ]
30. Retzmann N, Maatz G, Ritter H. Beilstein J Org Chem. 2014;10:2480. [ Links ]
31. El-Hajjaji F, Belkhmima R, Zerga B, et al. Int J Electrochem Sci. 2014;9:4721. [ Links ]
32. Zouitini, Rodi YK, Elmsellem H, et al. Der Pharm Chemica. 2016;8:23. [ Links ]
33. Baba YF, Elmsellem H, Rodi YK, et al. Der Pharm Lettre. 2016;8:128. [ Links ]
34. El Ouasif L, Merimi I, Zarrok H. et al. J Mater Env Sci. 2016;7:2718. [ Links ]
35. Bourichi S., Rodi YK, Elmsellem H, et al. Der Pharm Chemica. 2016;8:179. [ Links ]
36. El-Hajjaji F, Belkhmima R, Zerga B, et al. J Mater Environ Sci. 2014;5:263. [ Links ]
37. Salim R, Ech-chihbi E, Oudda H, et al. Der Pharm Chemica. 2016;8:200. [ Links ]
38. Ech-chihbi E, Salim R, Oudda H, et al. Der Pharm Chemica. 2016;8:214. [ Links ]
39. Aoufir Y, Lgaz H, Bourazmi H, et al. J Mater Env Sci. 2016; 7:4330. [ Links ]
40. Karzazi Y, Belghiti ME, El-Hajjaji F, et al. J Mater Environ Sci. 2016;7:4011. [ Links ]
41. Shawali AS, Abdallah MA, Mosselhi MA, et al. Z Fur Naturforschung B. 2002;57:552. [ Links ]
42. Khadraoui A, Khelifa A, Hamitouche H, et al. Res Chem Intermed. 2014;40:961. [ Links ]
43. Ghazoui A, Benchat N, El-Hajjaji F, et al. J Alloys Compd. 2017;693:510. [ Links ]
44. Al Mamari K, Elmsellem H, Sebbar N, et al. J Mater Environ Sci. 2016;7:3286. [ Links ]
45. Khamis E. Corrosion. 1990;46:476. [ Links ]
46. El-Rehim SA, Ibrahim MA, Khaled K. J Appl Electrochem. 1999;29:593. [ Links ]
47. Moretti G, Quartarone G, Tassan A, et al. Mater Corros. 1994;45:641. [ Links ]
48. Obot I, Obi-Egbedi N, Umoren S. Int J Electrochem Sci. 2009;4:863. [ Links ]
49. Singh AK, Quraishi M. Corros Sci. 2011;53:1288. [ Links ]
50. Donahue FM, Nobe K. J Electrochem Soc. 1965;112:886. [ Links ]
51. Khamis E, Bellucci F, Latanision RM, et al. Corrosion. 1991;47:677. [ Links ]
52. Ebenso EE, Kabanda MM, Arslan T, et al. Int J Electrochem Sci. 2012;7:5643. [ Links ]
53. Bousskri A, Lgaz H, Jodeh S, et al. Appl J Environ Eng Sci. 2016;2:1. [ Links ]
*Corresponding author. E-mail address: sjodeh@hotmail.com
Received June 12, 2017; accepted September 08, 2017

