


 English (pdf)
 Article in xml format
 Article references
 Send this article by e-mail
 Cited by SciELO
  Similars in
SciELO
Similars in
SciELO 
 Permalink
Introduction
Heavy metals such as Cr, Zn, Pb, Cd, Fe are mostly disseminated in the environment through waterways, but can also be carried by soil and air. They also accumulate in the tissues of animals and plants that are then consumed by humans, resulting in accumulation in the human body with detrimental effects on health and development. If all components have been contaminated by inorganic compounds, they may contain various heavy metals such as Pb and Zn and so on [1].
Pb and its compounds can be naturally present in a body of water or as a result of human activity. Pb can precipitate in from polluted air in rain or be eroded from rocks and blown into water. Many industrial processes also discharge Pb into waterways as part of their waste. Large concentrations of Pb compounds or ions can be fatal for the aquatic biota, 188 mg L-1 Pb being enough to kill fish [2]. The Pb ion content in seawater ranges from 10-5 to 10-2 mg L-1. The high salinity levels of seawater, however, can make accurate measurement of heavy metal concentrations difficult to determine accurately. “A particularly difficult sample matrix for potentiometric detection is seawater, where the high saline concentration forms a major interfering background and reduces the activity of most trace metals by complexation” [3]. For that, we need a very sensitive method to detect the presence of several metals simultaneously [4].
Zn can also have a negative impact on health, especially if the levels exceed 3 mg L-1. Even at lower concentrations, Zn can accumulate in the food chain. As with other environmental pollution sources, Zn can be disseminated throughout the environment [1].
The determinations of Pb and Zn concentrations have been performed using various methods such as AAS, ICP and FAAS. These methods can quickly and accurately determine small concentrations of a large number of different metals [5]. However, they require prior extraction processes using many solvents, and the salinity of the seawater sample disrupts the atomization process. Therefore, alternative methods are needed for the determination of these concentrations in seawater. DPAdCSV has often been used as an alternative method of analysis, because it has a high sensitivity and selectivity. It has low detection limits on the scale of 50 ng L-1 to 1 ng mL-1 and can measure several metals simultaneously. Furthermore, it is easy to use, does not require complex sample preparation, and it is able to detect metals in seawater. For DPAdCSV, the pre-concentration stage generally takes less than 1 minute [6].
The sensitivity of Pb and Zn ion measurement using DPAdCSV and a hanging mercury drop electrode (HMDE) can be improved by using complexing agents such as alizarin [4, 7, 8], clioquinol [9], calcein [10-13,18], oxine [14], luminol [2] or xylenol orange [15]. This study used calcon complexing agent.
Calcon has a C20H13N2NaO5S molecular formula and a relative molecular mass of 416.39 g mol-1 (Scheme 1).
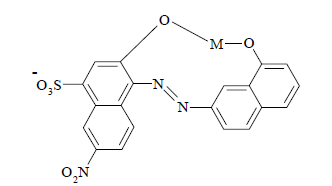
Calcon has a free electron pair on each hydroxyl group (O-H), so it can be used to form complexing compounds with metals [16, 17]. Calcon, as a complexing agent, can be used for the determination of lead and cadmium [16]. Nevertheless, choosing the right pH can increase calcon ability to complex the analyte. However, samples with a high matrix increase calcon concentration. To avoid this, it is necessary to increase the selectivity and sensitivity of the method by selecting the appropriate pH, buffer concentration, potential for adsorptive accumulation, right time for adsorptive accumulation and other supporting factors such as sweep rate, mode, and drop size [10].
The present work examines the reliability and validity of the DPAdCSV electrochemical method for the determination of trace amounts of Pb and Zn in seawater samples, using calcon as a complexing agent.
Experimental
Instrumentation
DPAdCSV calcon determination of Pb and Zn used a Trace Metal Analyzer (797 VA Computrace, Metrohm, Herisau, Switzerland) with the following three electrodes: working electrode, hanging mercury drop electrode (HMDE) and auxiliary Pt electrode. The reference electrode was Ag/AgCl (KCl 3 mol L-1). The pH was measured with a Metrohm 744 pH meter. DPAdCSV parameters of operation are: working electrode (HMDE), calibration (standard addition method), number of replication (4), drop size (7), stirrer speed (2000 rpm), mode (differential pulse), initial purge time (300 s), addition purge time (10 s), potential for adsorptive accumulation (-0.15 V), time for adsorptive accumulation (70 s), equallibration time (10 s), pulse amplitude ( 0.05 V), start potential (0 V), end potential (-1.2 V), voltage step (0.006 V), voltage step time (0.1 s), sweep rate (0.06 V s-1), peak current of Pb (-0.36 V) and peak current of Zn (-0.98 V).
Preparation of reagents
Stock solutions of 1000 mg L-1 Pb and Zn were prepared for the voltammetric analysis and stored in the dark in 25 mL volumetric flasks. Standard solutions of lower concentrations were prepared daily by diluting the stock solution with doubly distilled water, 0.01 mol L-1 of acetate buffer with pH 2 to 6 and 0.01 mol L-1 of phosphate buffer (pH 7-8). 100 mmol L-1 of calcon stock solution were prepared by dissolving calcon in ethanol. A Whatman filter paper was used to filter samples in the form of 1 mL of HNO3:1000 mL of seawater from Bungus, Padang.
DPAdCSV measurements
To determine the optimal concentration of calcon and the better buffer, 10 mL of the 10 ng mL-1 Pb and Zn solutions, 0.2 mL of calcon at concentrations ranging from 0.1 to 0.9 mmol L-1, and 0.2 mL of acetate or phosphate buffer (pH 3-9) were placed in the voltammetric vessel, and then the parameters shown in Table 1 were measured. After this, a voltammogram of a blank sample was recorded. The seawater sample taken from Bungus Padang was filtered using a Whatman filter paper, and 65% of HNO3 were added in the ratio of 1 mL of HNO3:1000 mL filtered seawater. 10 mL of filtered seawater were added to the voltammetric vessel and then a voltammogram of the sample solution was recorded under the conditions that had been determined as optimal from the initial DPAdCSV measurements with stock solutions. After the sample voltammogram was recorded, the measurements were conducted using standard addition technique. Measurements from a voltammogram of 0.02 mL of 1 ng mL-1 Pb and Zn diluted standard solutions were recorded. This procedure was repeated four times.
DPAdCSV is a two-step measurement: 1) Pb and Zn present in the test solution are deposited on the mercury electrode surface (amalgamation) at a deposition potential of -0.15 V; and then, 2) all the deposited ions are cathodically stripped by scanning the potential range from 0 to -1.2 V.
Results and discussion
Preliminary experiments were performed to identify the general features which characterize the behavior of the Pb and Zn systems on a mercury drop electrode. Fig. 1 shows DPAdCSV voltammograms of the Pb and Zn systems at pH 5.0 (acetate buffer), after accumulation at -0.1 V for 60 s, using a scan rate of 700 ms-1 and a size 8 drop on the HMDE. The Pb and Zn in the buffer showed small peak currents in the absence of calcon. The sample solutions containing 5 ngmL-1 of Pb and Zn, complexed with calcon, peaked at -0.339 V and -0.532 V. As the concentration of Pb and Zn was increased to 10 ng mL-1 and 20 ng mL-1, current peaks also increased.
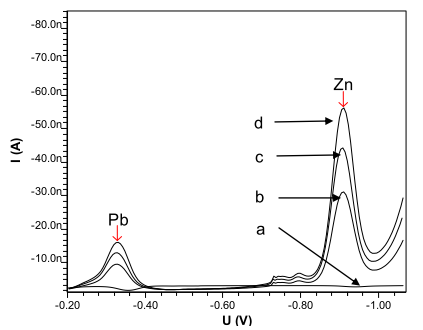
Figure 1 DPAdCSV scan of lead and zinc) in the presence of calcon: a = 0.3 mol L-1 of acetate buffer with pH 5 + 5 ng mL-1 of lead and zinc; b = a + 0.5 mmol L-1 of calcon; c = 0.3 mol L-1 of acetate buffer with pH 5 + 10 ng mL-1of lead and zinc + 0.5 mmol L-1 of calcon; d = 0.3 mol L-1 of acetate buffer with pH 5 + 20 ng mL-1 of lead and zinc + 0.5 mmol L-1 of calcon.
Optimum conditions
Effects of supporting electrolyte
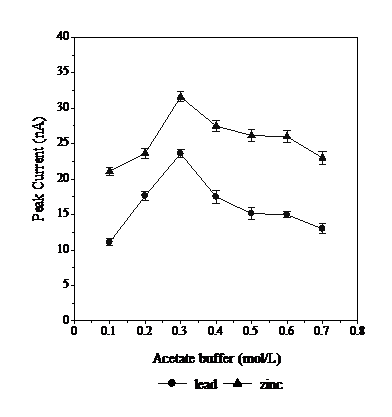
The effect of the buffer concentration on the stripping peak current of Pb and Zn was studied by varying the concentration of the acetate buffer within the range from 0.1 to 0.7 mol L-1 (Fig. 2). The maximum peak current was observed in 0.3 mol L-1 of acetate buffer. The peak current decreases from 0.4 to 0.7 mol L-1. An increase in the acetate buffer concentration was found to decrease the peak current due to the formation of weak complexes between the acetate buffer with Pb and Zn [16].
Effects of pH
pH serves to maintain the stability of Pb and Zn with calcon. The effect of pH on Pb and Zn-calcon measurements was determined from pH 3 to 9 (Fig. 3). In strong acidic conditions, pH 3 to 4, the peak current is small, due to the high concentration of H+, which binds with the calcon more readily than with Pb or Zn. A pH of 6 to 9 decreases the peak current, because the formation of Pb and Zn complexes with calcon is disturbed by the presence of many OH- ions. Calcon will compete with OH- to bind to Pb and Zn. The OH-1 ions readily bind to Pb and Zn ions forming hydroxides. The highest peak current occurs at pH 5, because this pH allows for the maximum formation of Pb and Zn-calcon complexes. This results in a greater number of complex analytes being deposited on the working electrode (8-9). The effect of pH also results in a shift in the potential of half-metal reaction of Pb and Zn, as indicated by the rise in Ep values with pH (Fig. 3). This suggests that simultaneous determination of metals using DPAdCSV will require the selection of complexing agents with the right pH, to avoid overlapping between peak currents, so as not to cause a peak current drop of one of the metals.
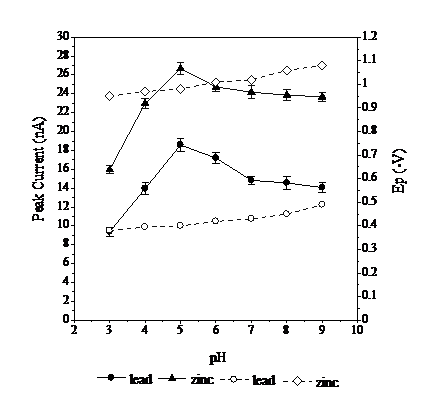
Figure 3 Effect of pH on the peak currents respectively, at optimal conditions: 0.02 mmol L-1 of calcon, 0.3 mol L-1 of acetate buffer, at -0.1 V Eads, at 70 s tads, with the scan rate of 800 mV s-1, and the 8 drop size of mercury. (Solid black data points indicate values for peak current and hollow data points indicate values for Ep).
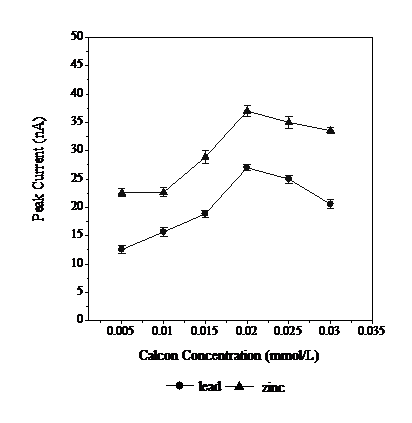
Effects of calcon concentration
The calcon concentrations used in this determination were 0.005, 0.01, 0.015, 0.02 and 0.025 mM. The results can be seen in Fig. 4. Calcon is a complex organic compound that is a Lewis base. Calcon provides free electron pairs to Pb and Zn to form chelates. In a class of ions with the same charge, the field strength arising from the interaction between central ions with the same ligands is higher with increasing atomic mass. As the atomic mass of Zn is smaller than that of Pb, Zn forms more readily chelates with calcon and produces a larger peak current. The stability of the complex will also determine the amount of analyte that is deposited on the working electrode. The more stable is a complex, the larger is the deposition. Fig. 4 indicates that a calcon concentration of 0.02 mmol L-1 has the highest peak current. Thus, this concentration deposits the largest amount of complex (Pb and Zn) on the electrode surface.
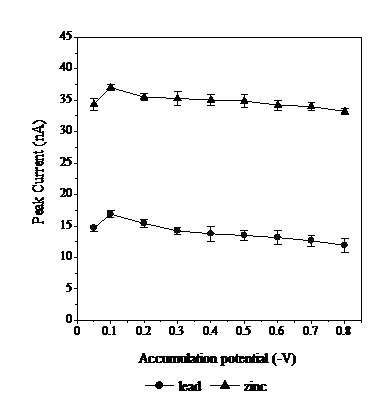
Effect of potential for adsorptive accumulation (E ads )
To determine the optimum conditions of Eads for Pb and Zn, the potential measurements were performed starting from -0.05 to -0.8 V (Fig. 5). The accumulation potential is the one provided to the analyte to enable deposition on the working electrode. Fig. 5 shows the peak current rising from -0.05 to -0.1 V, then dropping from -0.2 to -0.8 V. This indicates that -0.1 V maximizes the amount of Pb and Zn-calcon deposited. The optimum deposition voltage of -0.1 V was selected for the determination of Pb and Zn.
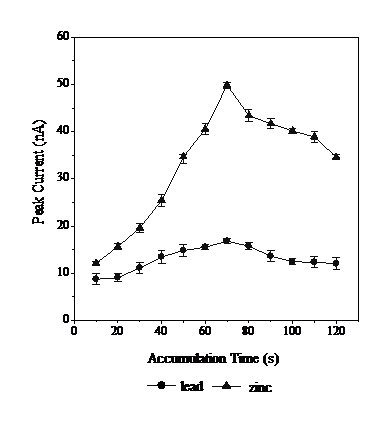
Effect of the time for adsorptive accumulation (t ads )
Deposition time for adsorptive accumulation on the working electrode (tads) of Pb and Zn-calcon complexes was tested from 10 to 120s (Fig. 6).
Fig. 6 shows the peak current increase from 10 to 70 s. Theoretically, the longer is the deposition time, the more Pb and Zn-calcon are deposited on the working electrode and the higher is the peak current. However, the peak current decreased at 80 s, as no further complexes could be accommodated on the electrode surface. This happens because when the deposition process takes place, the Pb and Zn-calcon complex will be difficult to produce at the resulting small peak currents. At 70 s, the maximum possible amount of analytes had already been deposited, the working electrode obtaining the highest peak current. Further investigation showed that this deposition time did not depend on mercury drop size, therefore the 70 s deposition time was chosen as the optimum accumulation time.
Effect of instrumental parameters
To improve the sensitivity for the determination of Pb and Zn-calcon, the influences of scan rate and mercury drop size during DPAdCSV measurements of Pb and Zn were investigated. The effect of scan rate and mercury drop size (1-9) on the peak current, in the range from 100 to 1000 mV s-1, is shown respectively in Fig. 7 and Fig. 8.
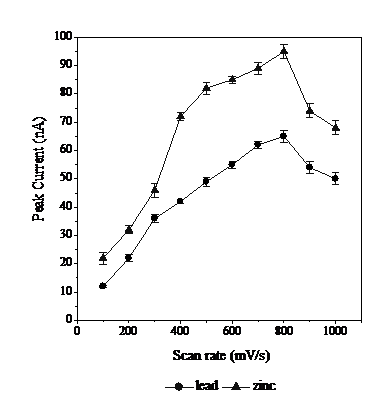
Figure 7 Effect of scan rate on the peak currents respectively, at optimal conditions: 0.02 mmol L-1 of calcon, 0.3 mol L-1 of acetate buffer with pH 5, at Eads= -0.1 V, at tads= 70 s, and the 8 drop size of mercury.
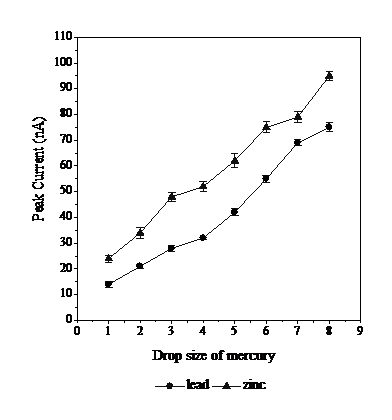
Figure 8 Effect of drop size of mercury on the peak currents, respectively, at optimal conditions: 0.02 mmol L-1 of calcon, 0.3 mol L-1 of acetate buffer with pH 5, -0.1 V Eads, 70 s tads, and the scan rate of 800 mV s-1.
Potential scan rate affects the formation of the analytical peak current [20]. The higher is the scan speed the higher is the electrolytic reaction rate, so that the peak current height increases; but, if the scan speed becomes too high, Pb and Zn peaks on the voltammogram curve widen and overlap, so the peak current for each metal is reduced. The 800 mV s-1 scan rate produces the best peak current for both Pb and Zn.
Drop size of HMDE can increase sensitivity. The greater is the size of the mercury droplet, the more analytes accumulate on the working electrode. However, if the size of the mercury droplets is too large, then the accumulation of mercury droplets will fall and no stripping will occur, so that no peak current is generated [20]. Size 8 provides the best condition as size 9 drops fall during the deposition process.
Linear range, detection limit and precision
To determine the relationship between DPAdCSV peak current and Pb and Zn concentration, a calibration graph was constructed using the established optimum conditions (Fig. 9).
A linear relationship was observed. Least squares analysis from 5 to 210 ng mL-1 yielded the following regression equation:
Ip = 1.0299 C + 1.0013 ( r = 0.9959, n = 4) for Pb
and
Ip = 1.1298 C + 1.9059 ( r = 0.9934, n = 4) for Zn
where Ip is the stripping voltammetric peak current in nanoamperes, C is the analysed Pb and Zn concentration in ng mL-1 and r is the correlation coefficient.
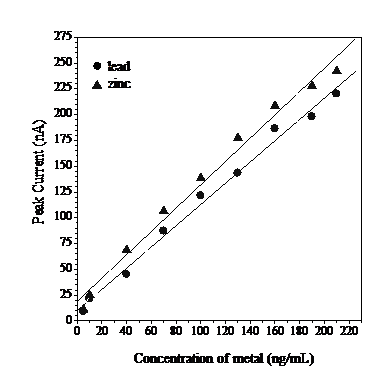
Figure 9 Calibration graph for ead and zinc in the presence of 0.02 mmol L-1 of calcon in 0.3 mmol L-1 of acetate buffer with pH 5, after 70 s tads, at -0.1 V Eads and 800 mV s-1 of scan rate.
The 3 standard deviation limit of detection for Pb and Zn is 0.01 and 0.05 ng L-1, respectively. The relative standard deviation (RSD) determines the reliability of the DPAdCSV method. RSD measurements were performed using 10 repetitions, at 10 ng mL-1, and were calculated to be 1.2% for Pb and 0.4% for Zn, respectively. This indicates considerable accuracy, exceeding the standard of the Association of Official Analytical Chemist (AOAC), which indicates that an RSD value for a standard solution concentration of 10 ng mL-1 is low from 15% (1.2% for Pb and 0.4% for Zn, respectively), this shows the DPAdCSV method has good accuracy [19].
Applications
The DPAdCSV method developed for Pb and Zn with calcon was applied to four seawater samples taken from different locations in Bungus Bay, Padang. The sample measurements were performed by standard addition. (Table 1). The recovery values were all in the range from 98 to 105% well exceeding the AOAC standard (70-120)% for 10 ng mL-1 solutions [19], which indicates an excellent degree of accuracy.
The accuracy of the electrochemical DPAdCSV method was measured by comparing the measurements of seawater samples using the AAS method (Table 2), while the comparison of the two methods was tested using t-test statistical approach [21]. However, the result of both methods showed no real differences, because t count is smaller than t table (2.45) at 95% accuracy (p = 0.05).
Table 1 Result of the determination of lead and zinc in seawater with DPAdCSV method
| Seawater Sample | Added (µg/L) | Found (µg/L) | Recovery (%) | |||
|---|---|---|---|---|---|---|
| Lead | Zinc | Lead | Zinc | Lead | Zinc | |
| Karolina | 0 | 0 | 182.31±0.13 | 262.13±0.19 | - | - |
| 5 | 5 | 186.32±0.14 | 265.16±0.2 | 99.47 | 99.26 | |
| 10 | 10 | 191.16±0.11 | 271.12±0.17 | 104.85 | 97.62 | |
| TelukBuo | 0 | 0 | 79.34±0.12 | 117.14±0.32 | - | - |
| 5 | 5 | 83.16±0.18 | 123.34±0.14 | 98.60 | 100.98 | |
| 10 | 10 | 92.23±0.12 | 126.11±0.33 | 103.23 | 96.18 | |
| Labuan cina | 0 | 0 | 131.77±0.13 | 213.23±0.51 | - | - |
| 5 | 5 | 135.78±0.11 | 217.32±0.13 | 99.27 | 99.58 | |
| 10 | 10 | 142.23±0.21 | 222.12±0.30 | 100.32 | 99.50 | |
| TPI | 0 | 0 | 334.45±0.27 | 422.45±0.11 | - | - |
| 5 | 5 | 338.18±0.48 | 426.11±0.50 | 99.62 | 100.86 | |
| 10 | 10 | 342.66±0.70 | 432.42±0.31 | 99.48 | 99.99 | |
Note : Mean ± SD (standard deviation) with 5 replicates
Table 2 Comparison of measurements of lead and zinc with DPAdCSV and AAS methods
| Seawater Sample | Method | Paired t-test value | ||||
|---|---|---|---|---|---|---|
| DPAdCSV | AAS | |||||
| Lead (µg/L) | Zinc (µg/L) | Lead (µg/L) | Zinc (µg/L) | Lead | Zinc | |
| Karolina | 182.31±0.13 | 262.13±0.19 | 181.11±8.2 | 263.22±9.6 | t = 0.4 | t = 0.5 |
| TelukBuo | 79.34±0.12 | 117.14±0.32 | 80.22±13 | 115.21±3.2 | t = 0.8 | t = 1.2 |
| Labuan cina | 131.77±0.13 | 213.23±0.51 | 133.01±11 | 215.14±5.6 | t = 0.6 | t = 0.7 |
| TPI | 334.45±0.27 | 422.45±0.11 | 332.11±7.1 | 423.44±12 | t = 0.2 | t = 0.3 |
Interference study
Possible interference of other species in the adsorptive stripping voltammetric determination values was studied by the addition of the putative interfering ion to a solution containing 10 ng mL-1 of Pb and Zn, using the optimized conditions (Table 3). It was found, using the criterion for interference, that there was a 5% error in the peak current; overall, foreign ions did not interfere with Pb and Zn determination. This is due to the optimum removal of the right conditions for determining Pb and Zn. For example, pH 5 is the optimum condition of calcon for complexing Pb and Zn, compared to other metals. 0.02 mmol L-1 of calcon concentration is the best condition for complexing all Pb and Zn in the sample; if the concentration used is lower, then, it will not be able to bind Pb and Zn maximally, because of the competition between anions to bind metals and cations with calcon. At the same time, -0.1 V Eads is the right potential to make the Pb and Zn -calcon complex to adsorb onto the working electrode; if the potential is lower or higher than that value, then, there will be a calcon complex with other metals being adsorbed. However, 70 s tads is the appropriate time for adsorption of Pb and Zn -calcon complex onto the working electrode [16].
Conclusion
The present study demonstrates that DPAdCSV using calcon as a complexing agent is an excellent method for the determination of trace amounts of Zn and Pb in seawater samples. The optimal conditions for this method are 0.3 mol L-1 acetate buffer concentration, with pH 5, at 0.02 mmol L-1 of calcon concentration, at -0.1 V Eads and at 70 s tads. These conditions gave an RSD from 10 replicates for Pb and Zn of 1.2 and 0.4%, respectively. Recovery of Pb and Zn was 98-105%. The calibration graphs were linear in the concentration range from 5 to 210 ng mL-1 and 5 to 200 ng mL-1 for Pb and Zn, respectively. The detection limits (LOD) are 0.01 ng mL-1 for Pb and 0.05 ng mL-1 for Zn. The method provides a swift, practical and economical way that does not require expensive equipment to estimate the presence of these potentially dangerous heavy metals.

