


 Inglês (pdf)
 Artigo em XML
 Referências do artigo
 Enviar este artigo por email
 Citado por SciELO
  Similares em
SciELO
Similares em
SciELO 
 Permalink
Introduction
Many different studies have covered the chemical effects of redox current peaks on several problems in the human body by oxidative action, using electrochemical methods1-5.
Sodium saccharin is a non-nutritive sweetener, which means that it is not metabolized by the body, to produce energy6. The redox current peaks of complex systems of manganese in saccharine Mn-saccharine and Mn-saccharine-phenanthroline were studied by cyclic voltammetry, using GCE in 0.1 M KCl. It was found that the Mn-Saccharine complex is irreversible and quasi-reversible of the Mn-saccharine-phenanthroline7 complex. Saccharin was studied on an Au electrode in 0.1 M HClO4 as electrolyte, by cyclic voltammetric technique. It was found that the stability of the adsorbed monolayer was enhanced by an increase in the saccharin concentration, and by a decrease in temperature8. Saccharin was studied with Fe(III) as a complex reagent [Fe(C7H4O3SN)2Cl]. The infrared and electronic spectral spectroscopy have found that two saccharin molecules were linked to the Fe(III) ion as a complex. Also, a quasi-reversible electron transfer process of the iron complex was studied by cyclic voltammetric technique9. Four sweeteners - sodium saccharin, aspartame, sodium cyclamate and acesulfame-K - were studied, and the average recoveries for various samples ranged from 93 to 107%10. The cyclic voltammograms of the chemical Schiff-base produced two cathodic current peaks in Britton-Robinson buffer (pH 7.0-10.0). The potential peaks values ranged from 0.0 V to -1.4 V. The cathodic peaks at more positive potentials than the reduction peaks of saccharin may be assigned to the cathodic reaction of C-N+ and >C=N- moieties of Schiff-base11. The oxidation-reduction current peaks properties of the Fe(III)/Fe(II) reaction were found to be reversible, using a platinum electrode with the system ligands, and also, quasi-reversible in the reaction12. Saccharin was used in an electrolyte solution, by an electrochemical quartz crystal microbalance (EQCM) technique, coupled with cyclic voltammetry (CV) measurements. The oxidation-reduction reactions from potentiodynamic polarization experiments were in agreement with the EQCM results13.
In this work, sodium saccharin was studied, as a sugar substitute, by the cyclic voltammetric method, to determine its the electrochemical behavior in different chemical properties at different electrolyte solutions, and a nano-sensor was used as electro-catalyst working electrode.
Experiment
Materials
Sodium saccharin (purity 98%), from China, carbon nanotubes (purity 99%) supplied from Fluka company (Germany), and other chemicals used in the experiment, such as KCl, K2HPO4, KH2PO4, Na2SO3, KClO4, K2SO4 and KNO3 (in high purity materials), from SCRC (China) were used. Deionized water was used for the preparation of aqueous solutions. Buffer solutions had sodium acetate with acetic acid, for an acidic pH, and sodium hydroxide, for an alkaline pH. All solutions used in the cyclic voltammetric cell were treated with nitrogen gas for 10-15 minutes, prior to being oxygen-free.
Apparatus
An EZstat series (Potentiostat/Glvanostat) NuVant Systems Inc (made in USA) instrument was used in all experiments. The electrochemical bio-analytical cell was connected to a potentiostat device, and monitored through the special program that has been installed on the personal computer to perform cyclic voltammetry (CV). A silver-silver chloride electrode (Ag/AgCl in 3M NaCl) and a platinum wire (1 mm diameter) were as reference and counter electrodes, respectively. A glassy carbon working electrode (GCE) modified with CNT was used in this study, after being cleaned with an aluminum solution, and treated with ultrasonic path water for ten minutes. All experiments were done at the room temperature of 25 ºC.
Preparing the modification of GCE with CNT (CNT/GCE)
A mechanical attachment technical method to prepare the CNT/GCE working electrode was employed to obtain the nano-sensor14,15. The GCE modification method included: the abrasive application of multiwall carbon nanotubes (MWCNT) on the clean GCE surface, forming the MWCNT/GCE modified working electrode; putting it in 10 mL of the electrolyte in the cyclic voltammetric cell; then, connecting it to all electrodes with the potentiostat.
Results and discussion
Effect of different supporting electrolytes
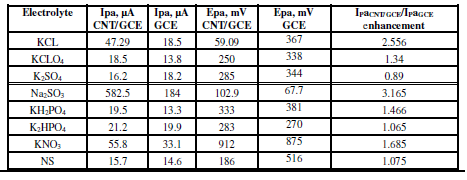
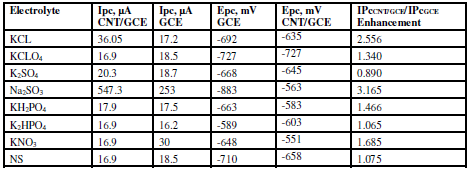
The effect of different supporting electrolytes - KCl, normal saline NaCl 0.9% (NS), K2HPO4, KH2PO4, Na2SO3, KClO4, K2SO4 and KNO3 - was studied on the oxidation and reduction current peaks of sodium saccharin, using a scan rate of 100 mV/sec, with Ag/AgCl as reference electrode. Table 1 shows the redox current peak of sodium saccharin, at CNT/GCE, as a modified working electrode in different electrolyte solutions.Table 2 shows oxidation peak and redaction peak values for sodium saccharin on the GCE, in different electrolyte solutions. Na2SO3 was the best electrolyte solution which enhanced the redox current peaks of sodium saccharin, and it was used in all the experiments, as shown in Fig. 1.
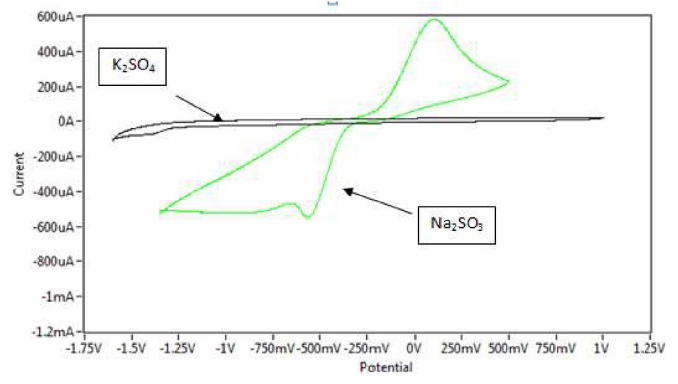
Figure 1 Cyclic voltammogram of 1 mM sodium saccharin at CNT/GCE in 0.1 M Na2SO3 and 0.1 M K2SO4 electrolyte solutions with pH=3, at 100 mV sec-1, versus Ag/AgCl.
Tables 1 and 2 show the enhancement of redox current peaks in the following orders:
Ipc CNT/GCE/Ipc GCE: Na2SO3 KCL
KCL K2SO4K2HPO4KH2PO4 KCLO4
 NS KNO3;
IpaCNT/GCE/IpaGCE: Na2SO3>KCL>KNO3 > KH2PO4 > NS>K2HPO4>KCLO4> K2SO4.
Table 1 Current, potential and enhancement values of the oxidation peak current of 1 mM sodium saccharin in different electrolyte solutions, at GCE and CNT/GCE.
Effect of varying pH
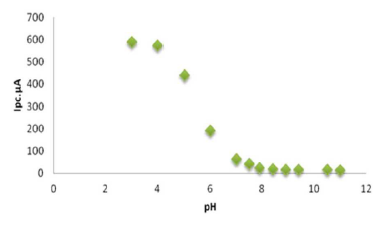
The effect of both acidic and alkaline media in Na2SO3 for sodium saccharin was studied using a modified GCE with CNT (CNT/GCE) as working electrode, and Ag/AgCl as reference electrode. It was observed that the oxidation-reduction current peaks of sodium saccharin in acidic media gradually linearly increased with lowering pH values, from 6 to 3, as shown in Table 3. Figs. 2 and 3 reveal high current values at pH 3, while both oxidation - reduction current peaks at alkaline pH values, from 7 to 11, decreased to lower values, as shown in Fig. 4.
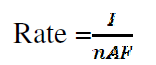
Table 3 shows that the current’s Ipa/IPc ratio value of sodium saccharin at different pH values was nearly equal to one; this ratio value means that the redox reaction of sodium saccharin is a reversible process. Also, the other evidence for the reversibility of the redox reaction of sodium saccharin is the peak separation value which is nearly equal to 100 mV, as shown in Table 3 16. The mechanism of the redox process of sodium saccharin was discussed in the following equations 1 and 2 12:
 1
1
 2
2
Table 3 Current, potential and peak potential separation values of oxidation-reduction peaks of 1 mM sodium saccharin, with different pHs, at CNT/GCE.
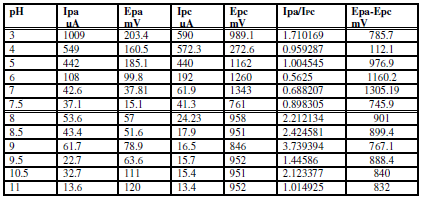
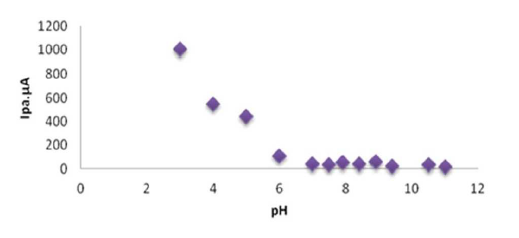
Figure 2 Plot oxidation current against the pH (3-11) of 0.01 mM sodium saccharin in 1 M Na2SO3, at CNT/GCE.
Effect of different concentrations
Figs. 5 and 6 show the calibration curves of different concentrations (0.001-0.01 mM) sodium saccharin in 1 M Na2SO3. The detection limit for the low concentrations of sodium saccharin analysis at the CNT/GCE was 10-3 mM, with an oxidation current sensitivity close to 308.52 µA/mM.
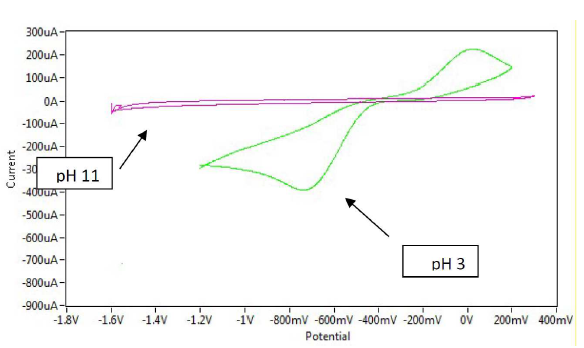
Figure 4 Cyclic voltammogram of 1 mM sodium saccharin at different pHs (3 and 11) on CNT/GCE, at a scan rate of 100 mV sec-1, with Ag/AgCl as reference electrode.
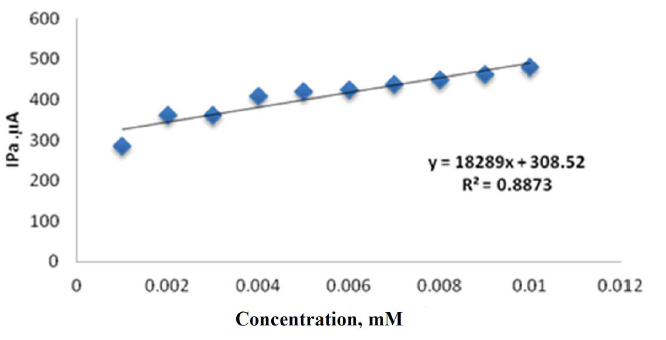
Figure 5 Plot of oxidation current against different concentrations of sodium saccharin in 1 M Na2SO3, at CNT/GCE.
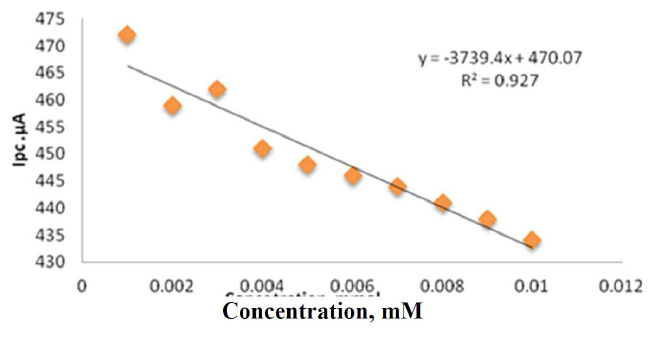
Figure 6 Plot of reduction current against different concentrations of sodium saccharin in 1 M Na2SO3, at CNT/GCE.
A curvature at a concentration greater than 10-3 mM and at a reduction current sensitivity close to 470.07 µA/mM was observed. The calibration plots were performed at the CNT/GCE in the sodium saccharin, with a good linearity of the cathodic current, as described by the equation: y = -3739.4X + 470.07, R² = 0.927.
Table 4 shows concentration values of sodium saccharin cathodic and anodic current peaks.
Table 4 Different concentrations (0.001-0.01 mM) of sodium saccharin in 1 M Na2SO3, at cathodic and anodic current peaks, by CNT/GCE.
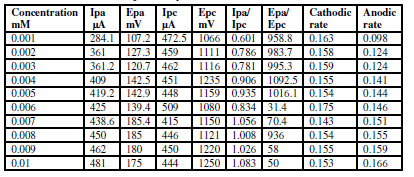
The expression for the reaction rate depends upon the electrode area, A [cm2], as shown in Table 4 17,
 3
3
where I is the current, F is the number of faradays, A is the electrode area, and n is the number of transferred electrons (n =1).
Figs. 7 and 8 show that the cathodic and anodic rate reactions of sodium saccharin were proportional to the different concentrations (0.001-0.01 mM) in both oxidation and reduction processes.
The redox rate reaction increased against increasing concentrations of sodium saccharine in the electrolyte18.
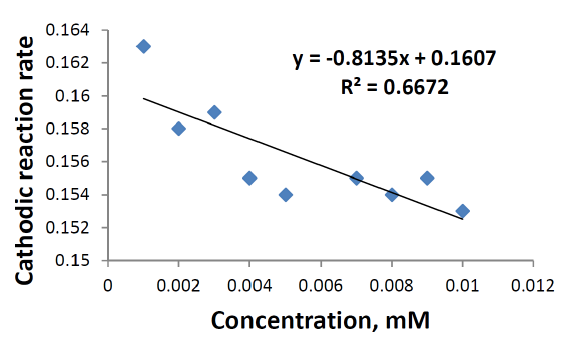
Table 4 shows the reaction rate at anodic and cathodic electrodes, with different concentrations (0.001-0.01 mM) of sodium saccharin in 1 M Na2SO3. The relationship between the reaction rate and the sodium saccharin concentration on the anodic and cathodic electrodes is different in terms of properties, as shown in Figs. 7 and 8, respectively. The oxidation reaction rate at the anodic electrode increased against an increasing concentration of sodium saccharin in the electrolyte, which depended on a lower reduction reaction rate at the cathodic electrode, as shown in the following equation:
Figure 7 Relationship between the anodic reaction rate and different concentrations of sodium saccharin in 1 M Na2SO3, at CNT/GCE.
Effect of varying the scan rate
The voltammograms of 0.01 mM sodium saccharin in 1 M Na2SO3 were studied at different scan rates, which express that an increased scan rate followed increased redox current peaks, as shown in Figs. 9 and 10. However, the anodic current peak shifted towards higher potentials, and the cathodic current peak shifted to lower potentials, as shown in Fig. 11. In a slow voltage scan, the diffusion layer grows much further from the electrode, in comparison to a fast scan. As a result, the flux to the electrode surface is much lower at slow scan rates than at faster ones. As the current is proportional to the flux towards the electrode, the current intensity becomes lower at slow scan rates, and higher at high scan rates19.
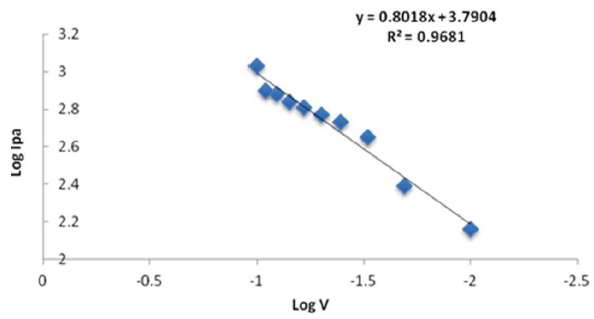
Figure 9 Plot log of Ipa against Log V (scan rate) for 1 mM sodium saccharin in 1 M Na2SO3 and 0.1 M borate buffer, at pH 3, using CNT/GCE.
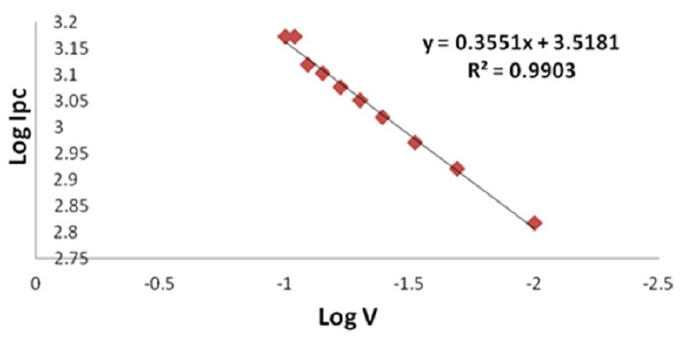
Figure 10 Plot log of Ipc against Log V (scan rate) for 1 mM sodium saccharin in 1 M Na2SO3 and 0.1 M borate buffer, at pH 3, using CNT/GCE.
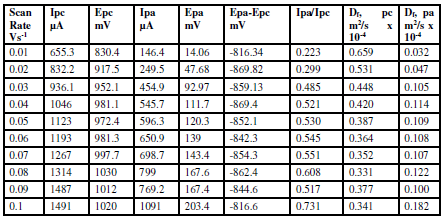
Table 5 Redox current, potential, peak potential separation, peak current ratio and diffusion coefficient (Df) of sodium saccharin, at different scan rates, on CNT/GCE.
A reasonably linear dependence of sodium saccharin’s reduction and oxidation currents on different scan rates was described by the equations y = 0.3551x + 3.5181 (R² = 0.9903), and y = 0.8018x + 3.7904 (R² = 0.9681), which are displayed in Figs. 9 and 10. It was found that the ratio of anodic to cathodic current peaks increased with increasing scan rates.
The system in the redox ratio of the voltammograms is recorded in Table 5.
The diffusion coefficient values of the redox process of sodium saccharin at different scan rates were calculated from Randles-Seveik equation, as described in Table 5. It was found that the diffusion coefficient values were close to the values for the pollutant materials in the environment22.
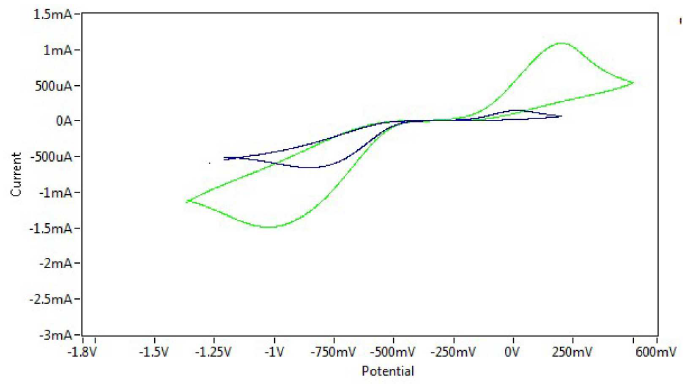
Figure 11 Cyclic voltammogram of sodium saccharin in pH=3 at different scan rates (0.01 and 0.1 mV sec-1), on CNT/GCE.
Fig. 11 shows the cyclic voltammograms of sodium saccharin at different scan rates (0.01 and 0.1mVsec-1), on CNT/GCE. Randles-Seveik equation20,21 describes a reversible redox couple of the current peaks.
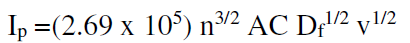 4
4
where Ip is the current, n is the moles number of electrons transferred into the reaction, A is the electrode area, Df is the diffusion coefficient, and V is the scan rate of the applied potential.
Reliability and stability of modified electrode
The potential cycling of the oxidation-reduction current was carried out during cyclic voltammetry for the modified CNT/GCE working electrode in sodium saccharine with Na2SO3, at a scan rate of 100 mVsec-1 (Tables 6 and 7). Table 6 illustrates the reliability of the anodic current peak (Ipa) current, and the relative standard deviation (RSD), which is ±1.95%.
Table 6 Reliability of CNT/GCE as working electrode, at a scan rate of 100 mVsec-1, for the anodic current peak of 0.01 mM sodium saccharin in 1 M Na2SO3, at nine times cycles.
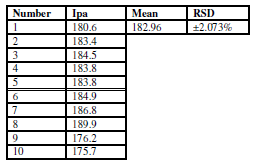
Table 7 Reliability of CNT/GCE as working electrode, at a scan rate of 100 mVsec-1, for the cathodic current peak of 0.01 mM sodium saccharin in 1 M Na2SO3, at ten times cycles.
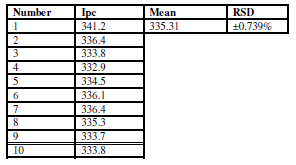
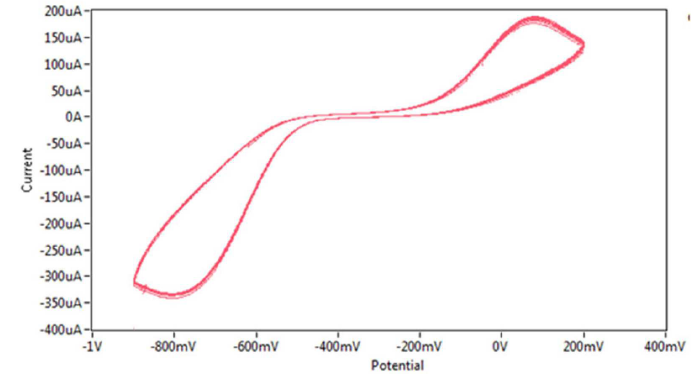
Figure 12 Cyclic voltammogram of redox current peaks of 0.01 mM sodium saccharin in 1 M Na2SO3 (pH=3), at ten* times cycles, on CNT/GCE, at a scan rate of 100 mV sec-1 versus Ag/AgCl.
Fig. 12 shows the redox current peaks CV of 0.01 mM sodium saccharine with 1 M Na2SO3 at ten times cycles, which revealed a good stability of the modified GCE CV, by overlapping of the voltammogram lines.
Conclusion
The results of the research showed that the oxidation - reduction current peaks of sodium saccharine in different electrolytes were enhanced by a nano-sensor (CNT/GCE) in electrochemical analysis, using the cyclic voltammetric method. The oxidation - reduction current peaks of the sodium saccharin in Na2SO3, at the potentials of 102.9 and -563 mV, respectively, were studied at different concentrations, pH values, and scan rates. The results indicate that sodium saccharin has high oxidation-reduction current peaks which were enhanced at acidic pH (=5) in Na2SO3 as an electrolyte solution. Also, the redox current peaks of sodium saccharin were studied at different scan rates, which determined the current’s ratio (Ipa/Ipc ≈ 1) and the peak potential separation (Epa - Epc ≈ 100 mV). This demonstrates that the redox process of saccharin in an aqueous electrolyte solution is reversible, and that there was a heterogeneous electron transfer into the reaction. The diffusion coefficient value for sodium saccharin on the CNT/GCE surface had an average value of 0.421x10⁻⁴ m2/sec for the cathodic electrode, and of 0.103x10⁻⁴ for the anodic electrode. Another factor, the redox reaction rates, was determined, to study the relationship with the different concentrations of sodium saccharin in the electrolyte solution, which gave different properties of the oxidation current peak from those of the reduction current peak.

