


 Inglês (pdf)
 Artigo em XML
 Referências do artigo
 Enviar este artigo por email
 Citado por SciELO
  Similares em
SciELO
Similares em
SciELO 
 Permalink
Introduction
Corrosion is a continuous and complicated problem with metal deterioration resulting from chemical attack or from a reaction with the environment1,2. Actually, corrosion cannot be completely eliminated, but can be retarded or prevented to some extent by using inhibitors. Recently, the world gave more attention to the environment protection, and the use of non-toxic green inhibitors is the main concern of many researchers3-6.
The significant effect of corrosion inhibitors depends on the complexation with metal, and on the extent of their dissolution in water. However, the formation of a stable and insoluble complex between inhibitor molecules and hydrated metal ions leads up to a decrease in metal dissolution, thus having an effect of corrosion retarding. Clearly, corrosion inhibition efficiency is controlled by the existence of heteroatoms (e.g. O, N and S) with high electron density7-9, aromatic rings with polar groups and π-electrons in the inhibitor molecules6,10,11.The electron pairs of mercapto12 and amino group13 can support the inhibitor molecules adsorption onto the metal surface. Naturally, these compounds can be adjusted to progress the strength of their adsorption bonds to the conversed metals. Also, this can be done by retarding the cathodic and/or anodic processes, or promoting adsorption onto the metallic surface by forming an adsorbed layer which acts as a compact barrier film14.
Pharmaceutically active substances, such as barbituric acid and its derivative, thiobarbituric acid, are used as corrosion inhibitors for mild steel protection in different media14-17. TBA adsorption onto the mild steel surface took place mainly through electrostatic interaction3. Udhayakala et al.17 used Fukui function (which provides information on the atoms in a molecule which have a higher tendency to either loose or accept an electron or pair of electrons) to show the nucleophilic and electrophilic attacking sites in the inhibitors.
Copper is suitable for a wide range of applications in submarine engineering18, seawater desalination, pipelines and heat exchangers19. So, copper corrosion inhibition is a continuing concern in industries. Films formed on the copper surface not only prevent surface corrosion, but also improve its surface morphology20.
Recently, investigators have examined the effect of some N-heterocyclic compounds on copper, by changing the placement or the number of substituent groups, and also by inserting heterocyclic compounds, such as triazole, tetrazole, pyrazole and imidazole21-24.
The aim of this work was to determine the efficiency of BA and TBA acids as green inhibitors of copper corrosion in a 0.6 mol/L NaCl solution, by using various electrochemical techniques, and also to illustrate the difference between BA and TBA corrosion inhibition performance, studying the temperature effect on the inhibition process and calculating thermodynamic parameters. IR, SEM and EDX analysis were used to correlate the surface with electrochemical behavior.
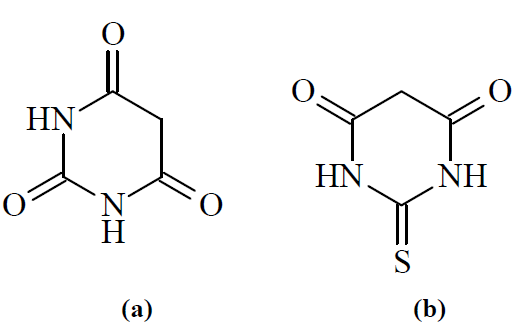
BA (1, 3-diazinane-2,4,6-trione) and TBA (2-sulfanylidene-1,3-diazinane-4,6-dioneare) chemical structures are given in Figure 1.
Experimental details
Materials
All chemicals were of analytical grade (BDH, Sigma or Aldrich), and were used as-received, without further purification.
Electrochemical measurements
The working electrode was a copper plate with 99.5 wt % Cu, 0.002 wt% Ni, 0.018 wt% Al, 0.005wt% Mn and 0.115 wt% Si; it was polished with a series of emery papers, then washed with distilled water, and its corrosion potential was measured against Ag/AgCl, as reference electrode, and pure Pt-wire, as counter electrode. The sodium chloride concentration used as aggressive medium in this work was 0.6 mol/L NaCl, with different inhibitors (BA and TBA) concentrations (1x10⁻², 5x10⁻³, 2.5x10⁻³ and 1x10⁻³ mol/L). The electrochemical measurements, such as potentiodynamic polarization and impedance studies, were carried out using a PGSTAT302N Autolab potentiostat/galvanostat. Potentiodynamic polarization curves were studied by changing the electrode potential from -0.8 V to 0.2 V, with a potential scan rate of 1mVs−1.
The same procedure of polishing the working electrode was used, immersing it in 0.6 mol/L NaCl, with and without inhibitor, at different temperatures (25 ºC, 35 ºC, 45 ºC and 55 ºC), to study their effect. The corrosion parameters, i.e. corrosion current density, icorr, and corrosion potential, Ecorr, were evaluated from the intersection of the linear anodic and cathodic branches of the Tafel plots. BA and TBA inhibition efficiency values were calculated according to equation 1.
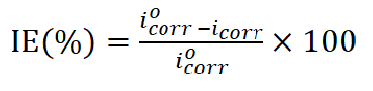 1
1
where  and icorr are the uninhibited and inhibited corrosion current densities, respectively. The electrochemical impedance spectroscopy (EIS) of the electrode surface, after its immersion in 0.6 mol/L NaCl, with and without inhibitor, has been carried out with an Ac voltage amplitude of 10 mV, using an electrochemical impedance system. The frequency range used in the study was 0.02-105 Hz. All the electrochemical impedance measurements were carried out at open circuit potential.
Surface morphology
The surface morphology of copper specimens, after 3 days of immersion in 0.6 mol/LNaCl, with and without the optimum inhibitors concentrations (BA: 5x10⁻³ mol/L and TBA: 1x10⁻³ mol/L), was analyzed by a JEOL-JSM-5600 scanning electron microscope equipped with an energy dispersive OXFORD Link-ISIS-300 X-ray spectroscopy.
Results and discussion
Polarization studies
Copper cathodic and anodic polarization curves in 0.6 mol/L NaCl, with and without different BA and TBA concentrations, are shown in Figs. 2 and 3.
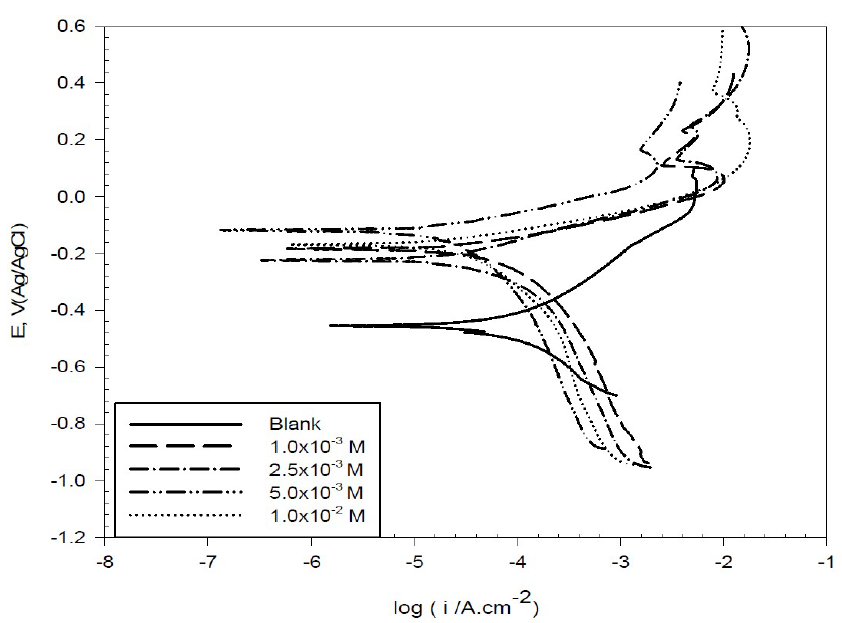
Figure 2 Potentiodynamic polarization curves for copper in 0.6 mol/L NaCl, in the absence and presence of different BA concentrations, at 298 K.
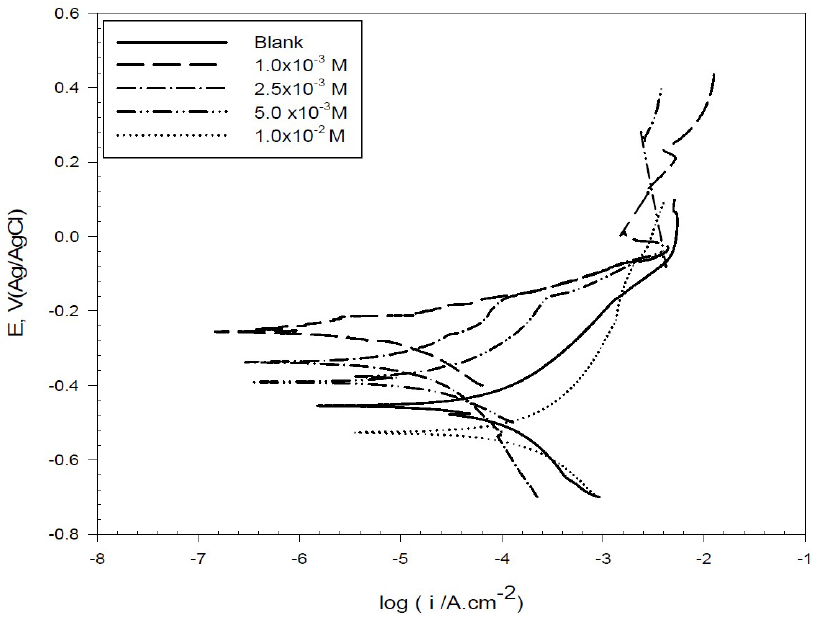
Figure 3 Potentiodynamic polarization curves for copper in 0.6 mol/L NaCl, in the absence and presence of different BA concentrations, at 298 K.
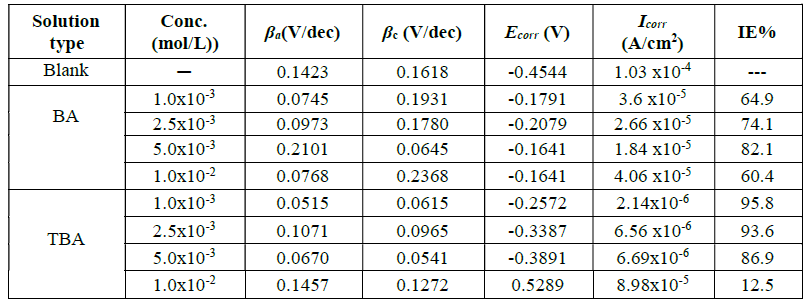
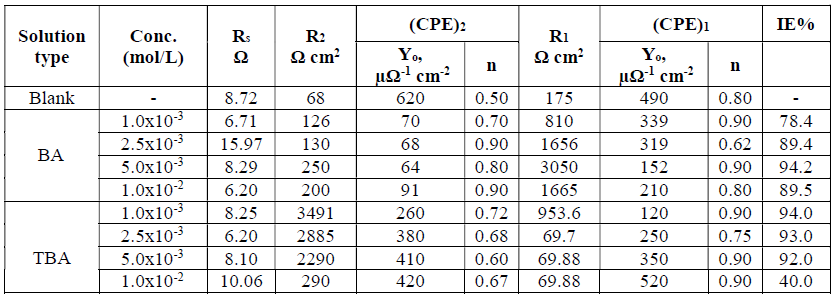
The corrosion parameters predicted from Tafel polarization curves are listed in Table 1. It was observed that copper corrosion rate in 0.6 mol/L NaCl decreased in the inhibitors presence. The decrease in the anodic and cathodic current density may be due to the formation of a barrier film on the metal surface, which is probably related to the inhibitor molecules adsorption onto the electrode surface, and also to the elevation of hydrogen evolution reaction or oxygen-reduction reaction, which prevents the formation of soluble CuCl225. In other words, at the first region of anodic polarization, the increase in the current density may be caused by the formation of soluble CuCl2 which, after some time, suffers a decrease due to the formation of mainly a CuCl film, and then again an increase, because of the film dissolution following Cu (II) ions production26. In this study, we notice that the corrosion potential (Ecorr) changed to less negative values in the inhibitors presence, with an effect on the anodic and cathodic reaction; so, they are mixed type inhibitors 27.
Table 1 Corrosion parameters obtained from copper polarization curves in 0.6 mol/L NaCl, with and without different BA and TBA concentrations, at 298 K
The preferential adsorption of these compounds plays an important role in blocking the active sites, in both anodic and cathodic reactions, which leads to the protection of part of the surface against the aggressive attack28. This adsorption results in the formation of a protective complex with copper ions, and it can be described as the following mechanism29.
Cu(S) + BA(aq) Cu:BA(ads) + H+
(aq)
Cu:BA(ads) + H+
(aq)
Noticeably, TBA inhibition efficiency values are higher than those of BA. This may be related to the molecular structure of the inhibitor which gives or accepts electrons to or from the metal surface, leading to new bonds30, and also due to the replacement of one oxygen atom in BA by one sulfur atom in TBA. The direction of the inhibitor molecule is substantial, enabling to build up a stronger bond, due to the interaction of the ring’s π-electrons with copper’s empty d orbitals, in a parallel orientation of the inhibitor molecule31.
Impedance studies
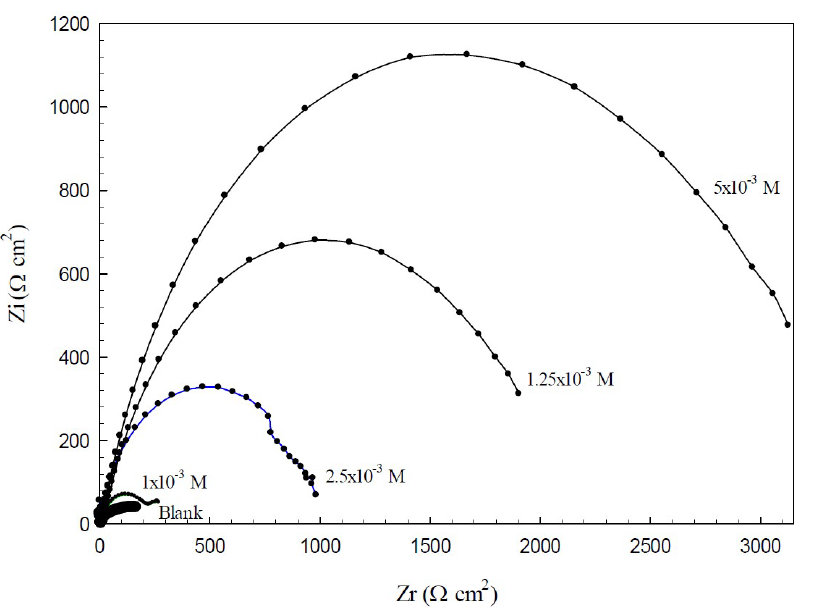
EIS is a useful tool for studying the electrode surface behavior, and predicting the corrosion rate. The Nyquist plots (Z - Z') of the copper electrode in 0.6 mol/L NaCl, without and with different BA and TBA concentrations, at open circuit conditions, are shown in Figs. 4 and 5.
It is apparent that the diameter of the Nyquist plot approximately amounts to the resistance value during the corrosion process. The diameter increased with higher BA concentrations, until these reached 5x10⁻³ mol/L; then, it decreased again with increased concentrations up to 1x10⁻² mol/L.
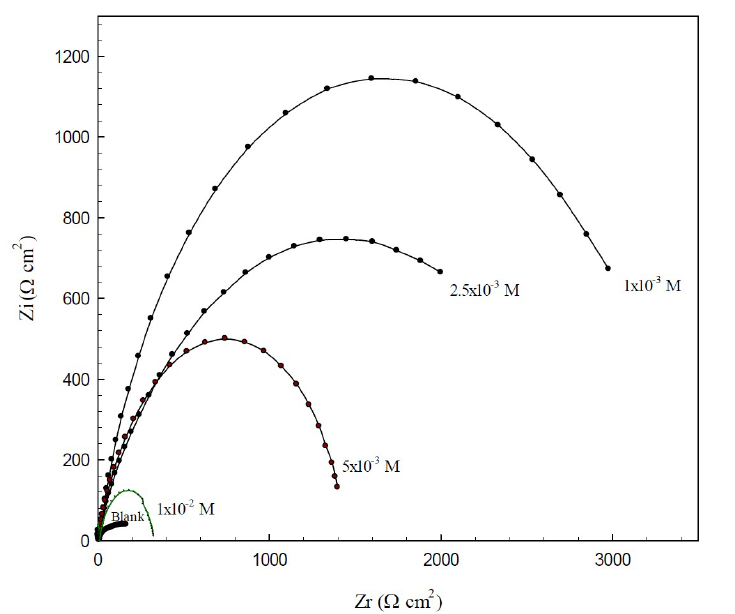
For TBA, the highest diameter was at 1x10⁻³ mol/L concentration; then, the diameter decreased with higher concentrations. These results indicate the gradual substitution of water molecules by the adsorption of organic molecules at the copper/solution interface, until optimum concentrations32. The decrease in the resistance at higher TBA concentrations may be due to the accumulation of the inhibitor molecules at the metal surface, which results in the retarding of the adsorption process. So, BA and TBA can act as corrosion inhibitors, and the highest efficiency is at the optimum concentrations for each one.
The Bode plots (log Z -log f) are presented in Figs. 6 and 7. Symbols in these figures represent the measured data, and solid lines represent the fitting data obtained using the most suitable equivalent circuit.
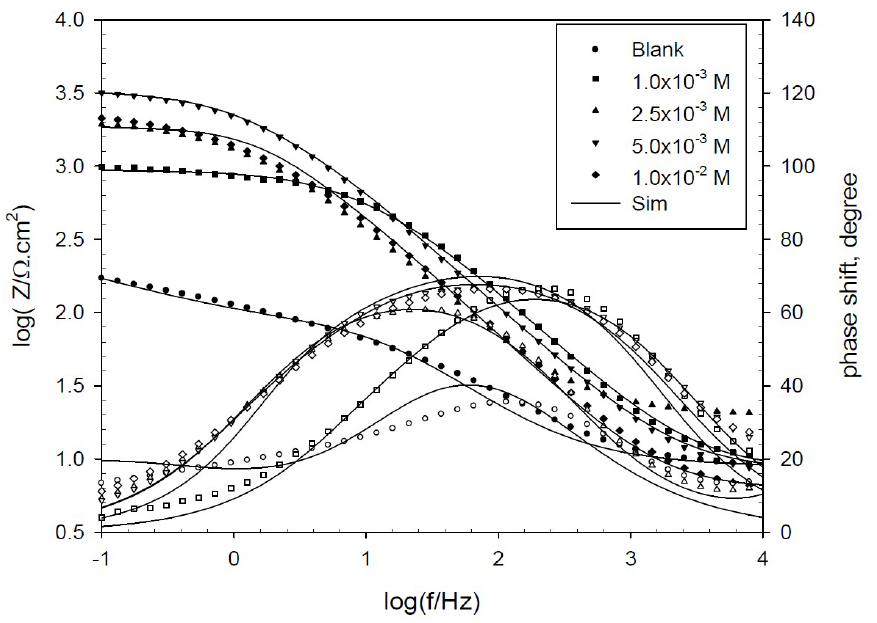
Figure 6 Bode plots for copper in 0.6 mol/L NaCl, in the absence and presence of various BA concentrations, at 298 K.
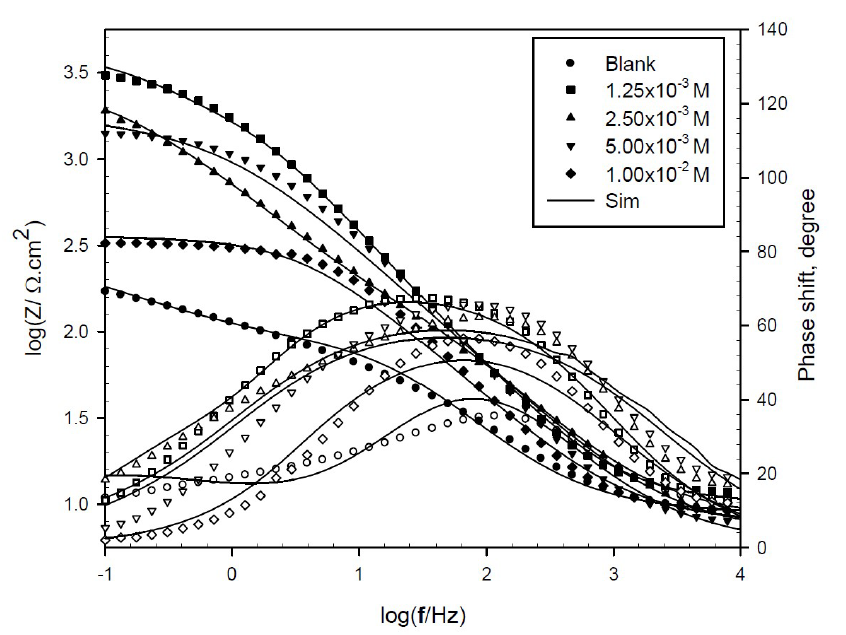
Figure 7 Bode plots for copper in 0.6 mol/L NaCl, in the absence and presence of various TBA concentrations, at 298 K.
The Bode plots show a resistive region at high frequencies, a capacitive region at intermediate frequencies and another resistive region at low frequencies. From the horizontal plateau region at high frequency, Rs value can be obtained, which is almost constant with different inhibitor concentrations. However, polarization resistance varied with the inhibitor concentrations, and it could be obtained from the plateau at low frequency.
The phase plots (θ- log f) show peaks’ shape and maximum angle at an intermediate frequency, and the blank shows an angle at 35o which increased to 68o and 70o, at optimum BA and TBA concentrations, respectively, suggesting higher corrosion resistance. At the low frequency region, the peak of the phase angle plot becomes broad, indicating an interaction of, at least, two time constants.
This result can reveal that there is more than one occurred electrochemical process, and the growth of more resistive BA and TBA layers adsorbed onto the copper surface, forming complex CuBA and CuTBA protected films.
All the experimental results investigated by using the equivalent circuit are shown in Fig. 8. Rs (solution resistance) is in series with two circuits, including R1(CPE)1 and R2(CPE)2, with parallel connections which are suitable for the electrochemical properties of the bi-layered surface film.
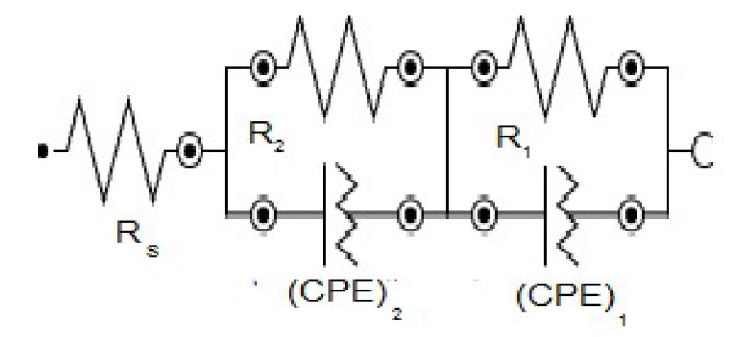
The resistance of the compact inner layer (R1) is higher than that from the outer porous layer resistance (R2). CPE is the constant phase element which displays the double layer and represents the most suitable factor, to observe the thickness of the protective film. CPE is used in place of the ideal capacitance, due to the surface’s poor homogeneity. CPE (ZCPE) impedance was obtained from equation 2.
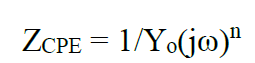 2
2
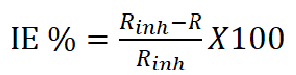
where Yo is the CPE modulus, which refers to the formed film capacitance, ω is the radial frequency, j is the imaginary root and n is the phase shift, and its value varies between 1, for the ideal capacitor, and less than 1 for the porous surface33,34. The inhibition efficiency was calculated using equation 3:
 3
3
where R and Rinh are the charge transfer resistances in the inhibitor absence and presence.
The calculated efficiency and the measured EIS parameters for adsorbed BA and TBA onto the copper surface are listed in Table 2. It can be noticed that R1 and R2 values increased with increasing BA concentrations, and decreased with TBA concentrations, until they reached optimum values. CPE1 and CPE2 values decreased, and the deviations of the phase shift were lower than the ideal value (unity), as a result of the surface irregularities and inhomogeneity35, which also may be due to the surface coverage by the adsorbed molecules at the copper/solution interface. According to the above results, BA and TBA can be used as good inhibitors for copper in a NaCl solution, and TBA is more effective than BA, due to the sulfur atom presence36.
The results obtained from the impedance studies are in good agreement with those obtained from the polarization studies.
Adsorption isotherm
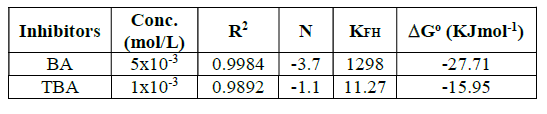
Generally, the investigation of adsorption processes is determined by adsorption isotherms that provide structural information about the linkage between the additive inhibitor and the metal surface which results in the retardation of the corrosion rate by weakening the diffusion of corrosive species, or by increasing the metal surface resistance. Flory-Huggins isotherm was the best suitable model that fitted the experimental data which were used to describe BA and TBA adsorption characteristics onto the copper surface, in a 0.6 mol/L NaCl solution.
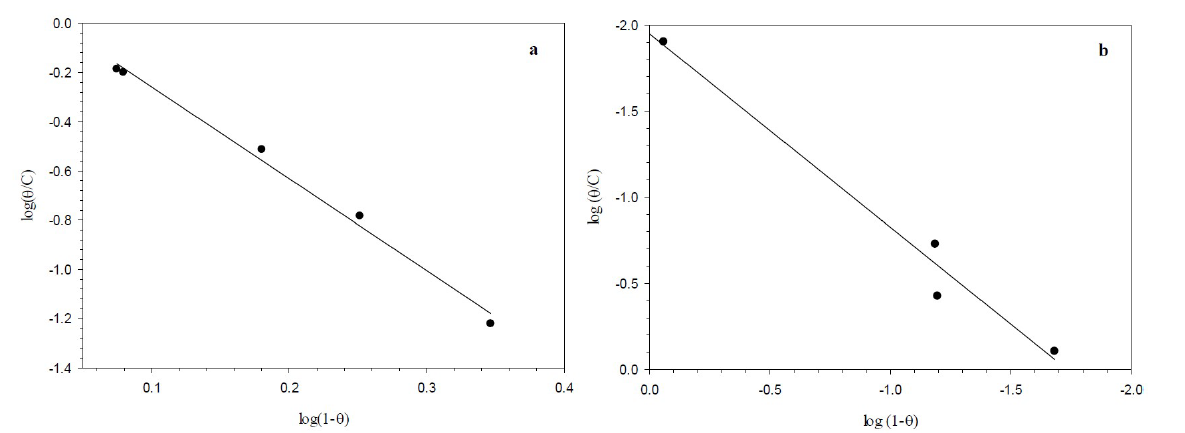
Figure 9 Linear relationship of the Flory-Huggins model for the adsorption of (a) BA and (b) TBA onto the copper surface, in 0.6 mol/L NaCl, at 298 K.
Fig. 9 offers the linear representation of the function  against
  according to Flory-Huggins equation37, which is expressed by equation 4.
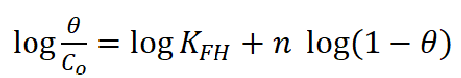 4
4
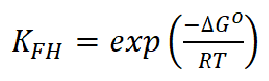
where n is the number of ions occupying adsorption sites, KFH is the equilibrium constant (L mol-1), Co is the equilibrium concentration and θ is the surface coverage degree. The regression coefficient (R2) values nearly close to one proved that BA and TBA adsorption onto the copper surface obeyed Flory-Huggins isotherm. In addition, the equilibrium constant (KFH) values obtained from this isotherm and the change in the standard free energy(∆Go) of adsorption can be specified according to equation 5, and are listed in Table 3.
 5
5
where R is the universal gas constant (8.314 mol-1K-1) and T is the absolute temperature. The adsorption processes are always classified into chemisorption or physisorption, according to ∆Go values38. Chemisorption occurs when ∆Go is equal to or more negative than 40 kJmol-1, where the charge shared or transferred from the inhibitor molecules to the copper surface forms a coordinate covalent bond. Physisorption occurs when ∆Go is equal to or less negative than -20 kJmol-1, in which an electrostatic interaction between charged molecules and charged metal surface is considered.
According to Table 3, Go values are in between -20 and -40 kJmol-1, which indicates that the inhibitor molecules adsorption included a mixed-type physisorption and chemisorption mechanism39.
Effect of temperature
Activation variables for the adsorption features of the studied compounds on copper in 0.6 mol/L NaCl were calculated by supposing a direct relationship between the log of icorr (the rate constant for the corrosion reaction) and 1/T, according to the Arrhenius pattern, as in equation 6:
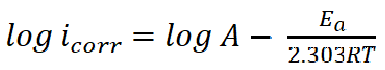 6
6
where A is the frequency factor, R is the universal gas constant and T is the absolute temperature. The relationship between the log of icorr and 1/T presented straight lines with good degree of linearity, as shown in Fig. 10.
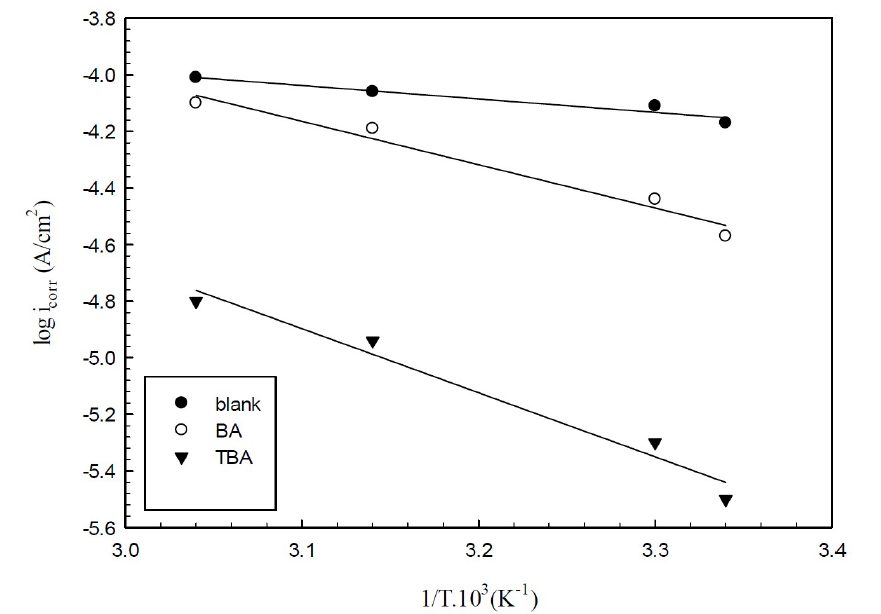
Figure 10 Arrhenius plots for corrosion copper in 0.6 mol/L NaCl, in the presence and absence of inhibitors.
The activation energies concluded from the plots of copper immersed in 0.6 mol/L NaCl, without and with optimum concentrations of BA and TBA, are listed in Table 4.
Table 4 Thermodynamic parameters for the adsorption at optimum concentrations of inhibitor molecules onto the copper surface in 0.6 mol/L NaCl, at different temperatures.
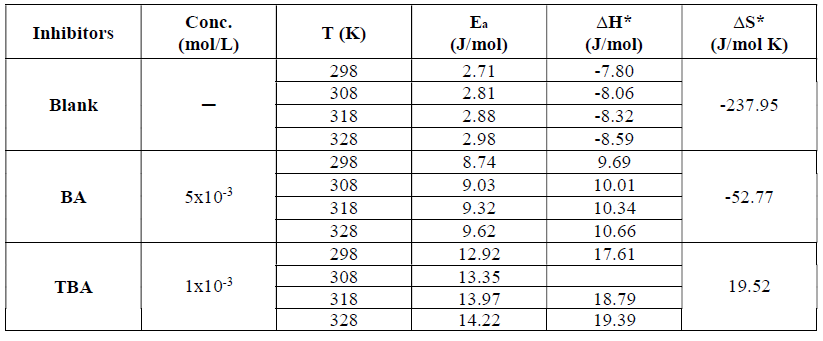
Ea values for the inhibited copper are higher than those for the uninhibited one, due to the adsorption of inhibitor molecules onto the active sites on the copper surface, which increases the energy barrier connected with the corrosion reaction. Also, the increase in activation energy may be explained as a result of the physical adsorption that happens at the first step, which is proved by decreasing the inhibition efficiency with an increasing temperature40-43.
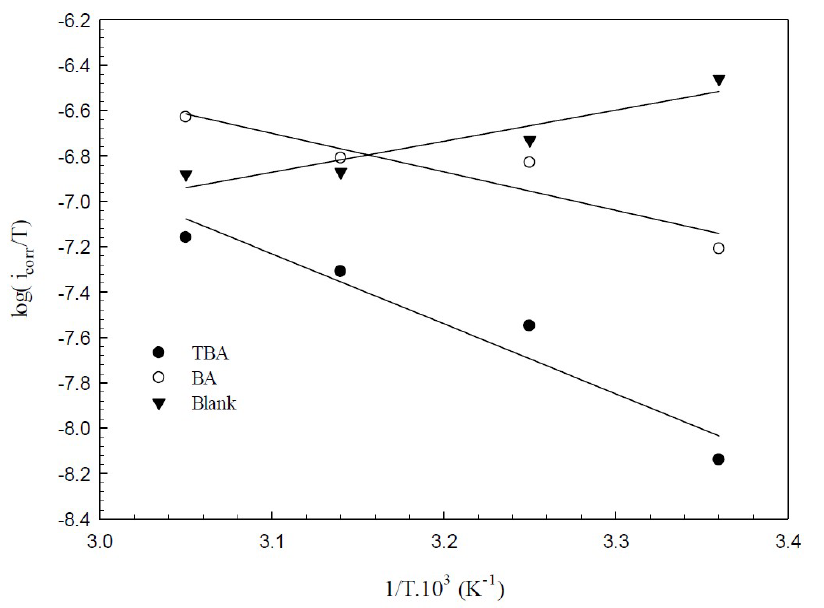
Figure 11 Transition state plots for copper in 0.6 mol/L NaCl at 5x10⁻³ mol/L of BA and 1x10⁻³ mol/L of TBA, at different temperatures.
Fig. 11 presents the plots of log icorr/T versus 1/T, depending on the transition state (equation 7).
 7
7
where N is Avogadro's number and h is the Plank constant. This relationship gives straight lines with the slope and the intercept equal to ΔH*/2.303R and

 , respectively. ΔS* and ∆H* values are listed in Table 4.
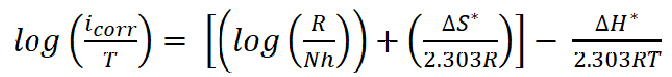
FTIR Spectral Studies
Different functional groups for the corrosion product on copper in the presence of BA and TBA were realized from FTIR spectra in Fig. 12, which clarifies the difference between the spectra of the adsorbed inhibitors and that of the pure ones. That was noticeable from the shifting of the wavenumber from higher to lower values. The spectra of pure BA and its adsorbed inhibitor display that the broad peaks corresponding to ʋ(OH) and ʋ(NH) in pure BA were sharp in nature, with CuBA suffering a shift from its position to a lower value for ʋ(OH) group (3500-3310cm-1) and a higher value for ʋ(NH) group (3244- 3277cm-1).
The stretching of the CH group in BA was 2900 cm-1, exhibiting a lower wave number, 2844 cm-1, for the BA adsorbed onto the copper surface. Also, the peaks around 1780 and 1678 cm-1, which are assigned to ʋ(C=O), undergo a shift to lower wavenumbers after adsorption onto the metal surface, i.e., 1733 and 1644 cm-1. This may be due to the covalent bonding of the carbonyl group to the empty hybrid orbital of the copper atom44. This description confirmed the ability of the inhibitor molecules to coordinate with Cu2+ ions.
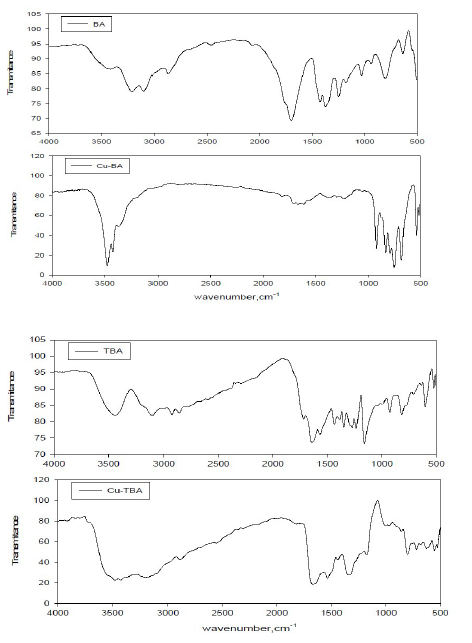
Figure 12 FTIR spectra of pure barbituric acid (BA) and pure thiobarbituric acid (TBA), with Cu-BT and Cu-TBA films formed at the copper electrode.
The same shifting appears in the FTIR spectrum of TBA. The occurrence of peaks with sharp nature at wavenumbers 955, 877, 833 and 778 cm-1 pointed to a metal- ligand bond of BA and TBA chemisorption on the copper surface45.
The characteristic band of (C=O) group of TBA, adsorbed onto the copper surface, appears at the same wavenumber of pure TBA at 1706 and 1666 cm-1, but has a shape of medium peaks comparing to the weak peaks for pure TBA.
The observed weak peak at 1350 cm-1in the TBA spectrum assigned to ʋ(C=S) + ʋ(NH) shifted to a higher wavenumber, 1392 cm-1, that can be related to specific molecular interactions, thus leading to the formation of a coordination bond between the sulfur hetero atom and the unfilled d-orbital of the copper atom46.
Surface Morphology Investigation (SEM/EDX)
Scanning electron microscopy (SEM) and energy dispersive X-ray (EDX) spectroscopy is one of the most ordinarily techniques for assessing and analyzing the surface and elemental constituents of corrosion products attached samples. SEM images illustrated the interaction between metals and the corrosive media, so the morphology of the metal surface and collection of corrosion products can be determined by SEM analysis. Fig. 13 exhibits the SEM micrograph of copper specimens after 4 hours of immersion in 0.6 mol/L NaCl, in the presence and absence of the studied inhibitors.
Figure 13 SEM images of the copper corrosion product in 0.6 mol/L NaCl, in the presence and absence of inhibitors, at various magnifications.
The copper sample surface in the solution without inhibitor is strongly deteriorated, which is related to its direct attack by aggressive ions. In their turn, the SEM images of copper specimens with the best concentrations of TBA and BA offer relatively smoother surfaces, which is due to the adsorption of the inhibitor molecules onto the metallic surface. The protection of the metallic surface occurred by the surface isolation from the corrosive medium, leading to a less damaged and smoother surface.
The EDX spectra of copper surfaces are shown in Fig. 14.
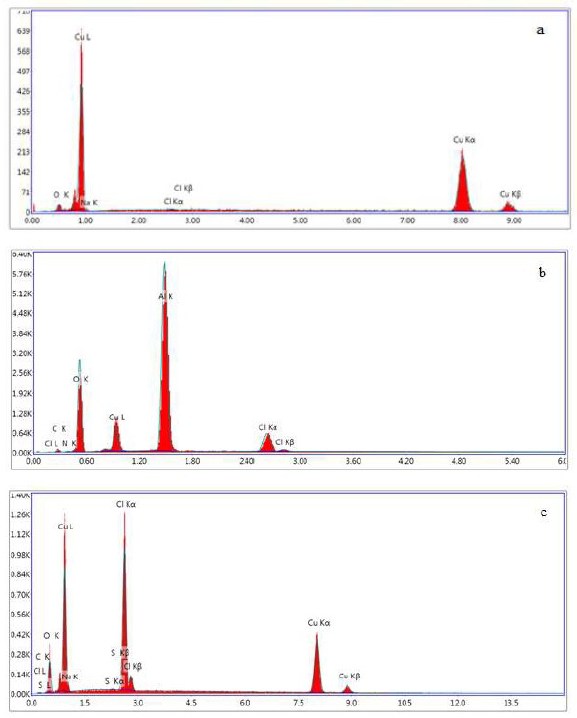
Figure 14 (a) EDX spectra of the uninhibited copper surface, (b) inhibited with BA (c) inhibited with BA and TBA.
It is obvious that the intensity of oxygen in the EDX spectrum of the blank copper sample related to the formation of an oxide film on the surface. By comparing the intensity of oxygen in the EDX spectra of copper surfaces in the presence and absence of inhibitors, its increasing intensity in BA presence was noticeable, which indicates that the adsorption of inhibitor molecules onto the copper surface occurred. The presence of nitrogen and sulfur in the EDX spectra of copper obtained from the TBA inhibitor containing solutions definitely testify the adsorption of inhibitors onto the metallic surface.
Conclusions
Barbituric (BA) and thiobarbituric (TBA) acids act as mixed-type inhibitors, impeding both the anodic and cathodic reactions on copper corrosion in a 0.6 mol/L NaCl solution. The inhibition efficiencies are 95.8 % and 86.9 %, in the order of TBA ˃ BA, at optimum concentrations of 1x10⁻³ mol/L and 5x10⁻³, respectively.
The adsorption process of these inhibitors obeyed Flory-Huggins isotherm, seeming to follow physisorption and chemisorption modes. IR studies and morphology analysis (SEM and EDX) manifested the results obtained from electrochemical techniques.

