


 Inglês (pdf)
 Artigo em XML
 Referências do artigo
 Enviar este artigo por email
 Citado por SciELO
  Similares em
SciELO
Similares em
SciELO 
 Permalink
Introduction
Surfactants are surface active agents that lower the surface tension of a liquid, allowing easier spreading, and also reduce the interfacial tension between two liquids. Surfactants have wide applications in domestic and industry sectors. Physical properties of surfactants provide information about the nature and ability to radically alter surface and interfacial properties, and to self-associate and solubilize themselves in micelles. These properties recommend the platform to use the surfactants in different applications. Surfactants are bifunctional molecules with hydrophilic (i.e., water loving) and hydrophobic (i.e., grease loving) groups. This bifunctional property allows the surfactant molecules to group together to form micelles [1].
On the basis of head groups charge, the surfactants are classified in four types: anionic, cationic, nonionic and amphoteric [2]. Cationic surfactants are dissolved in water, while generating surface active positive ions on the hydrophilic part. These surfactants are widely used as disinfectants and preservatives, due to their good bactericidal property, e.g. Octadecyl ammonium chloride, and also for sterilization, corrosion inhibitors and mineral flotation [3]. Cationic micelles of long-chain quaternary ammonium bromides (e.g. CTAB) act as corrosion inhibitors, and their inhibitory effect increases with an alkyl chain length at concentrations above their critical micelle concentrations (CMC). The primary action of the surfactant functional group is to be adsorbed onto the metal surface. The surfactant molecules adsorption onto the metal surface is responsible for the metal corrosion inhibition [4]. Among the cationic surfactants, those amphiphilic molecules which possess a quaternary ammonium (QA) polar group are of meticulous interest for bioengineering applications.
Quaternary ammonium compounds (QAC) are among the most commonly used disinfectants. The main QAC currently used are benzalkonium chloride (BC), Stearalkonium chloride (SAC) and dodecyl dimethyl ammonium chloride (DDAC). The first generation of QAC is alkyl dimethyl benzyl ammonium chloride (ADBAC), such as BC, with alkyl chains of 8 to 18 carbons, cetalkonium chloride, with alkyl chains of C16, SAC, with alkyl chains of C18, which are used as preservatives in pharmaceutical and cosmetic products, hand sanitizers, sun protection creams and lotions, pain relief poultices, hair conditioners, farm buildings cleaning and disinfecting, poultry transportation vehicles, animal cages, hatchery equipments, agriculture equipments, shoe baths, etc. [5].
Many physical properties of surfactant solutions exhibit a characteristic transition over a narrow concentration range, which is generally related to the association of surfactant molecules arising from their intrinsic amphiphilic nature. The transition region could be used to determine the CMC above which multi-molecular aggregates (micelles) are formed. The forces which hold surfactant molecules together in micelles arise from weak Vander Waal’s, hydrophobic, hydrogen-bonding and screened electrostatic interactions. In this study, SAC acoustical, conductance and refractive index behavior in methanol, at a temperature of 301 K, has been studied to estimate CMC, molecular interactions and thermodynamic behavior of micellization.
Materials and methods
The cationic surfactant, SAC (CAS No. 122-19-0, Himedia Mumbai, India), was used as-received, being only dried in a vacuum desiccator. All glassware used in the air sensitive experiment was oven-dried at least 1 h before use. Prior to use, SAC solutions were prepared in the best solvent. SAC has shown maximum solubility in methanol mixtures. The calculated SAC amount was taken into a standard flask, and the solution was made up by adding the required amount of methanol. By this method, various solutions containing different SAC concentrations in methanol were prepared.
Acoustical measurements
SAC solutions ultrasonic velocity measurements were recorded on a “F 80" model ultrasonic interferometer for liquids (Mittal Enterprises, New Delhi), at 301 K, using a crystal with a frequency of 2 MHz, with an accuracy of ± 0.03%.
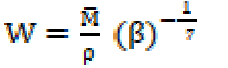
The adiabatic compressibility (β) and molar compressibility (W) have been calculated by the following relationships:
 (1)
(1)
 (2)
(2)
 (3)
(3)
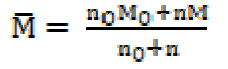
 where ρ, v and M are density, ultrasonic velocity and effective molecular weight of the SAC solution, respectively, and no, n, Mo and M are the number of moles and molecular weight of the solvent mixture and solute, respectively.
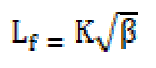
The intermolecular free length (Lf), which is the distance covered by a sound wave between two molecules surfaces, has been evaluated by the following equation:
 (4)
(4)
where K is the temperature dependent Jacobson’s constant.
The specific acoustic impedance (Z), which is the unit area acoustic impedance of a sound medium in a given surface, was calculated by the following equation:
 (5)
(5)
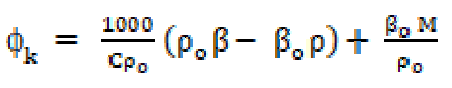
The apparent molar compressibility ((k) in the solutions was calculated from the compressibility and density data by the following relationship:
 (6)
(6)
where βo and ρo are the solvent adiabatic compressibility and density, and β and ρ are the solutions adiabatic compressibility and density, respectively. M and C are the solute molecular weight and concentration (mol/L), respectively.
The primary solvation number (Sn) was calculated by the following expression:
 (7)
(7)
 where V is the solution volume containing n solute moles and Vo is the solvent molar volume. The molar sound velocity (R) and internal pressure ((i) were calculated by the following equation:
 (8)
(8)
 (9)
(9)
 where M is the solution effective molecular weight, b stands for the cubic packing factor, which is assumed to be 2 for all liquids and the solution, K is the temperature independent constant (4.28 x 10⁹), R is the gas constant (8.3143JK-1mol-1), T is the absolute temperature and M is the solution effective molecular weight. The relative association (RA), available volume (Va) and relaxation strength (r) were calculated by the following relationships:
 (10)
(10)
 (11)
(11)
 (12)
(12)
where vα is equivalent to 1600 m sec-1.
Conductivity measurements
SAC conductance measurements in methanol were carried out with an HANNAH12300 Microprocessor conductivity meter and a dipping type conductivity cell with a platinized electrode, at 301 K. The cell constant (1.0) was determined by using standard solutions of potassium chloride, and the accuracy was checked by repeating several times the measurements with fresh solutions. The specific conductance and molecular conductance are expressed in mhos cm-1 and mol/L, respectively.
Results and discussion
Acoustical measurements
Ultrasonic velocity is an important and essential physical parameter with structural dependence. Ultrasonic velocity measurements have been used to understand the SAC molecular interactions with methanol, and provide a diversity of physico-chemical properties of SAC solutions. In the case of the homogeneous dissipative liquid system, the ultrasonic velocity (v) of the compressional acoustic wave is dependent on the density (ρ) and adiabatic compressibility (β) by the following relationship:
 (14)
(14)
The variation of ultrasonic velocity (v) with SAC concentration (C) in a solution depends upon the concentration derivatives of density (ρ) and adiabatic compressibility ((), and it can be expressed as:
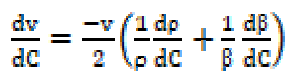 (15)
(15)
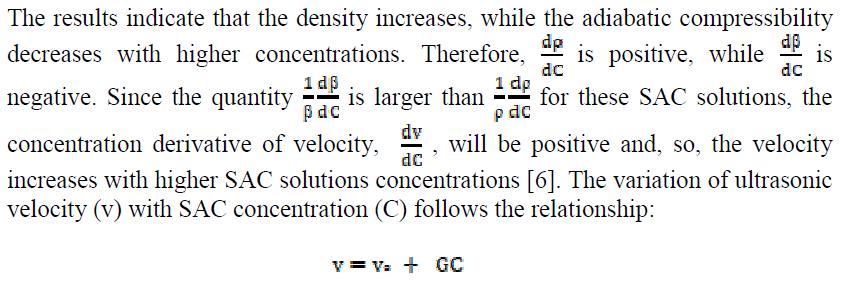 (16)
(16)
where vo is the ultrasonic velocity in the solvent and G is Garnsey’s Constant [7]. The plot of ultrasonic velocity (v) v/s salt concentration (C) is characterized by an intersection of two straight lines at a definite SAC concentration which corresponds to the cationic surfactant CMC value.
The micellization is mainly caused by the change in energy due to dipole-dipole interactions between the SAC molecules polar heads groups. The micelles are held together by Vander Waals forces acting between hydrocarbon chains of parallel layers and by strong dipole-dipole interactions between the polar heads groups. The plot of ultrasonic velocity v/s SAC concentration mentioned in Fig. 1 has been extrapolated to zero concentration, and the extrapolated velocity (vo) values are in agreement with experimental methanol ultrasonic velocity values, indicating that the SAC molecules do not aggregate to an appreciable extent below the CMC.
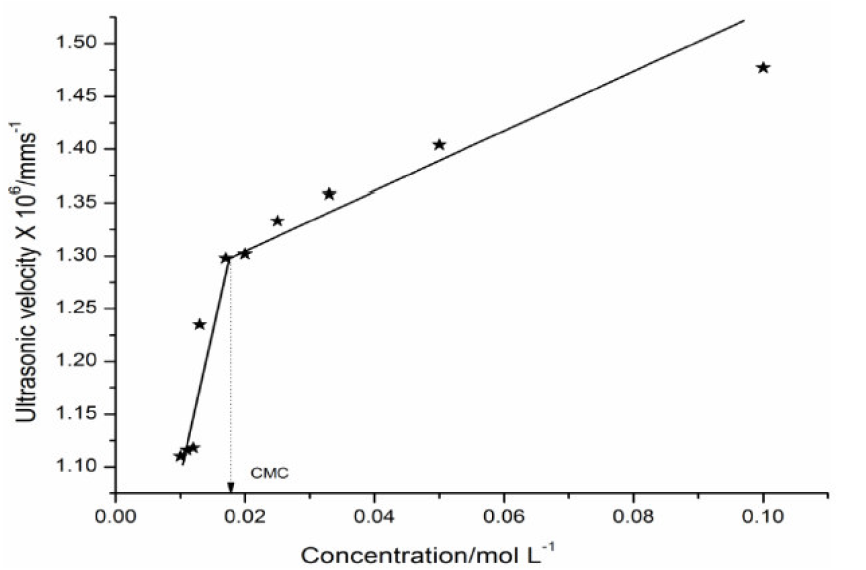
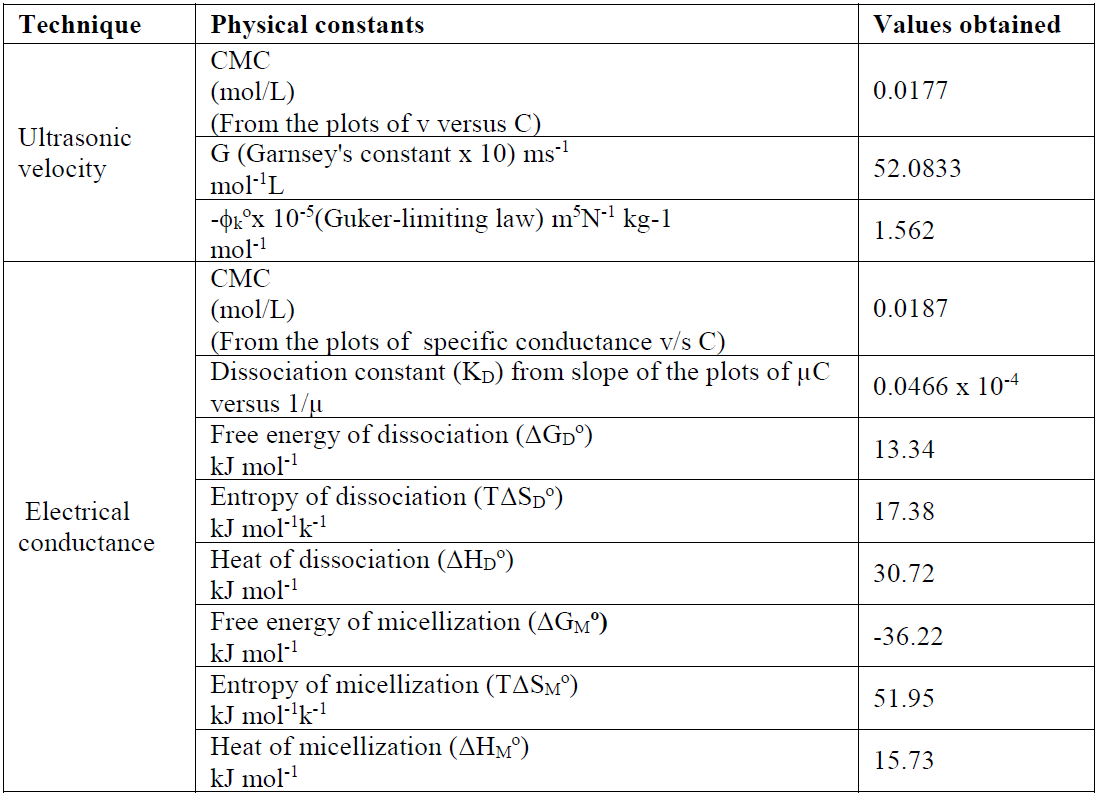
The Garnsey's constant (G) value for SAC has been obtained from the slope of the plot between ultrasonic velocity against SAC concentration, below the CMC, shown in Table 3.
According to Jacobson’s model, liquid molecules get perturbed when ultrasonic waves are incident on it, but, as the medium has some elasticity, the perturbed molecules regain their equilibrium positions. If E is the elasticity bulk modulus, the velocity of sound in the medium is given by the following relation [8]:
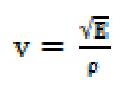 (17)
(17)
The compressibility (β) is reciprocal of the liquid elasticity, then:
 (18)
(18)
The trend in the variation of adiabatic compressibility is mostly found to be the reverse to that of ultrasonic velocity; this is also evident in the present investigation. The SAC adiabatic compressibility (β) values decrease with increasing concentrations, as shown in Table 1. An increase in the solutions concentration generally lowers the compressibility, due to greater interaction between the ions, thus increasing the internal pressure. The decrease in adiabatic compressibility after CMC may be due to a closed packing at the ionic head groups of SAC molecules in the micelles, resulting in an increase in ionic repulsion and, finally, in the internal pressure [9]. The plot of β v/s C is extrapolated to zero concentration, and the extrapolated values of adiabatic compressibility, βo, are found in good agreement with the calculated methanol adiabatic compressibility values. The molar compressibility (W) values in methanol increase with higher SAC salt concentrations, and are mentioned in Table 1.
Table 1 Velocity, adiabatic compressibility, molar compressibility, relative strength, apparent molar compressibility and internal pressure of SAC in methanol, at 301 K.
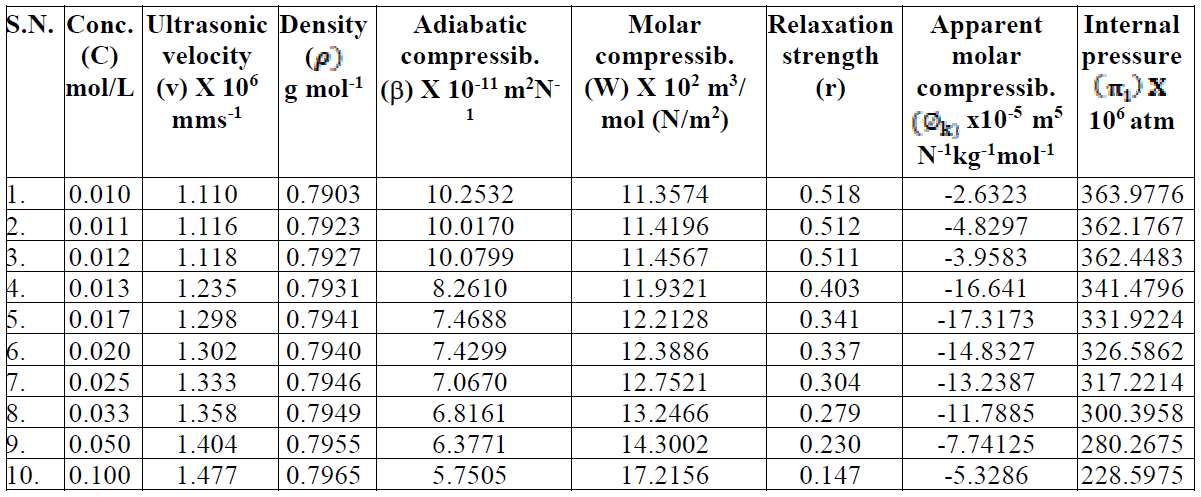
Apparent molar compressibility ((k) varies linearly with the concentration square root below the CMC, obeying Gucker’s limiting law [10]
 (19)
(19)
where (k o is the apparent molar compressibility of methanol and Sk is a constant. The (k o and Sk values for SAC solutions were evaluated from the intercept and slope of the linear plot of (k v/s C1/2, below the CMC. The evaluated slope value, Sk, is positive and signifies a considerable SAC-solvent interaction below the CMC. The -(k values decrease sharply up to the CMC and, again, they increase with the square root of SAC concentration. The decrease in the adiabatic compressibility (β) and apparent molar compressibility (-(k) values may be attributed to the fact that the SAC molecules in the diluted solutions are considerably ionized into quaternary ammonium cations and chloride anions. These anions and cations are surrounded by a thin methanol film. The methanol molecules orientation around the ions is attributed to the influence of the electrostatic field that leads to internal pressure increases, which reduce the solutions compressibility. The increase in the apparent molar compressibility values in the post micellization region indicates the incompressible nature of the concentrated solutions.
The intermolecular free length (Lf) values decrease, while the specific acoustic impedance (Z) values increase with higher SAC concentrations (C) [11]. The trend in the variation of intermolecular free length and specific acoustic impedance can be explained on the basis of hydrophobic interactions between SAC and solvent molecules, which increase the intermolecular distance, leaving a relatively wider gap between the molecules, thus becoming the main cause of impediment to the propagation of ultrasound waves and, ultimately, affecting the structural arrangements. The intermolecular free length (Lf) decreases with higher SAC concentrations.
The specific acoustic impedance (Z), i.e. a product of the solution density (() and velocity (v), has shown a reverse nature to that of the intermolecular free length (Lf).The increase in the ultrasonic velocity and specific acoustic impedance values and the decrease in the adiabatic compressibility and intermolecular free length values, with an increase in SAC concentration, at 301 K, indicate an increase in intermolecular forces and the formation of solvent molecules aggregates around salt ions, also supporting the strong SAC-solvent interactions, due to which structural arrangement is affected [12]. The intermolecular free length (Lf) and specific acoustic impedance (Z) values for SAC in methanol are mentioned in Table 2. The SAC salt relaxation strength (r) values decrease with higher concentrations, which again supports the SAC-solvent interactions [13].
The molar sound velocity (R) values [14] increase with higher SAC concentrations, and the available volume (Va) values and the relative association (RA) values decrease with higher SAC concentrations (Table 2). However, the decrease in relative association (RA) has been attributed either to the decreased association between salt and organic solvent molecules at higher concentrations, or to the increased ions solvation (Table 2).
Internal pressure ((i) is the fundamental property which provides an excellent basis for examining the solution phenomena and studying various properties of the liquid state. It is a measure of change in the liquid solution internal energy, as it undergoes a very small isothermal change, in the cohesive or binding forces between the SAC-solvent interactions. The increase in internal pressure is attributed to the association of solute-solvent molecules through hydrogen bonding [15]. The decrease in internal pressure may be due to the hydrogen bond break-up in the solvent medium, as shown in Table 1.
Table 2 Intermolecular free length, specific acoustic impedance, solvation number and other allied parameters of SAC in methanol, at 301 K.
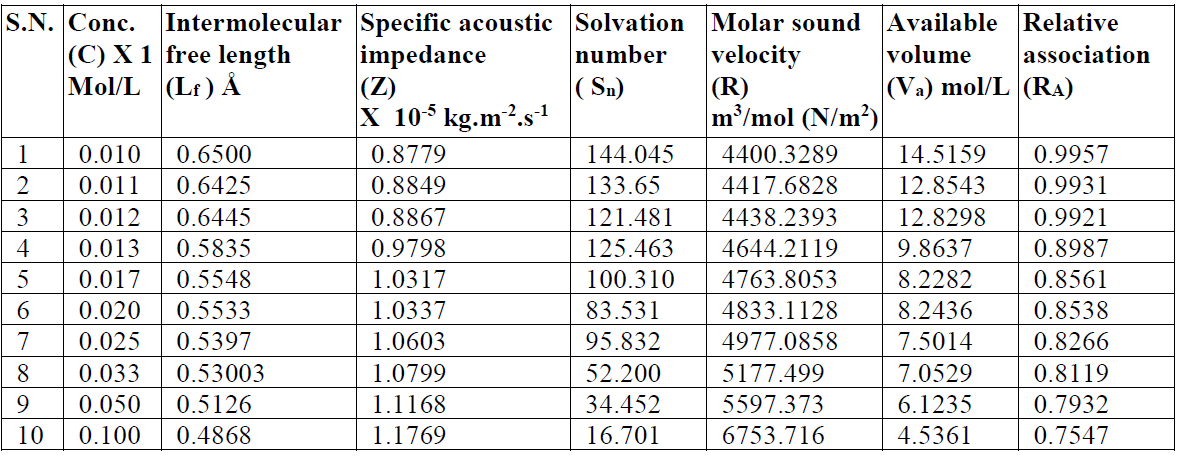
The solvation number, Sn, corresponds to the number of solvent molecules in the primary solvation ions sheath, and, since the electrostriction molecule in the later will be highly compressed, these molecules will be less compressible than those in the solution bulk, when an external pressure is applied. The solvent molecules compressibility near (but not in) the primary solvation sheaths is the same as that of the pure solvent. The Sn values decrease with higher concentrations (C). In the post-micellization region, the Sn values exhibit a marked change which may be due to the fact that the greater intake of solvent molecules above the CMC reduce the repulsive forces acting between the ionic micelles polar heads mentioned in Table 2.
The results of ultrasonic measurements of different SAC solutions in methanol indicate that there is a signification interaction between SAC and methanol molecules, and that this SAC salt behaves as a weak electrolyte in diluted solutions. The various acoustical parameters calculated with the help of ultrasonic velocity data are in fair agreement with the results of other works [16].
Conductivity measurements
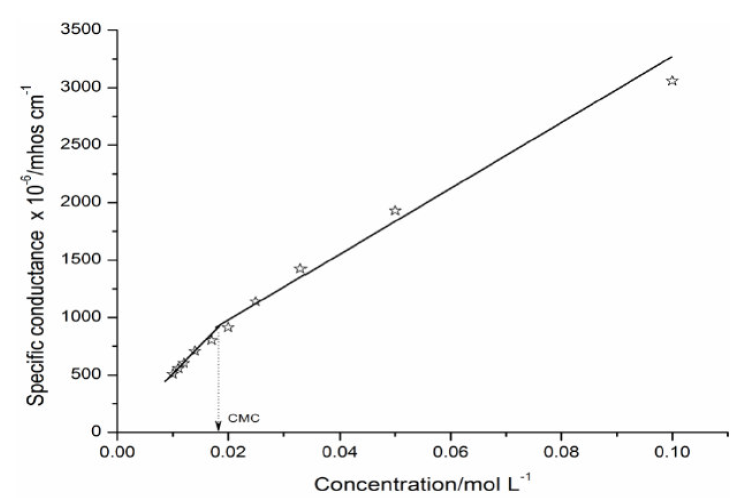
SAC characteristics in solutions depend largely on the nature of the formed ions and on the employed solvent. The SAC conductometric studies were carried out at different concentrations in methanol, at a temperature of 301 K. The specific conductance, k (mhos cm-1), values in methanol increase linearly with higher concentrations (Table 4). The SAC diluted solutions exhibit a characteristic similar to the ordinary electrolytes. However, at a certain concentration, known as CMC, the characteristics differ from those of ordinary electrolytes. The increase in specific conductance with higher SAC concentrations may be due to the dissociation in the organic solvent. However, an increase in the specific conductance at higher concentrations is probably due to the ionic micelles formation. The plot of specific conductance (k) v/s SAC concentration showed an intersection of two straight lines at CMC, indicating that the cationic species begin to associate together to produce ionic micelles (Fig. 2).
The process of micellization in organic solvents, i.e. methanol, is different from that of aqueous solvents. The main cause of micellization in organic solvents is the energy change due to dipole-dipole interactions between the polar head groups of salt molecules. The aggregation begins at very low concentrations of organic solvents. The SAC molecules consist of both lyophilic and lyophobic moieties in the same molecule, and the micelles in organic solvents can be visualized as Hartley’s Inverted Micelles, in which polar head groups are present in the center of micelles, with hydrocarbon chains extended towards the organic solvents.
The SAC heat of dissociation, ΔHD O, negative values indicate that the dissociation process is exothermic in nature (Table 3).
Table 3 Various physical constants calculated from different techniques for a SAC solution, at 301 K.
The SAC solutions molar conductance, µ, diminishes with increasing salt concentrations (Table 4).
Table 4 SAC specific conductance, molar conductance, dissociation constant and refractive index in methanol, at 301 K.
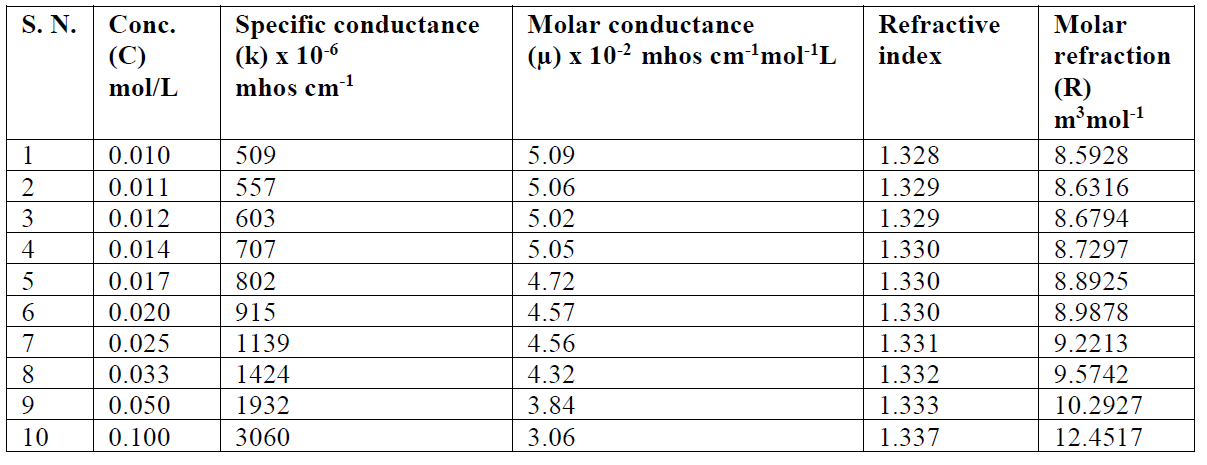
The reduction in molar conductance is attributed to the combined effects of ionic atmosphere, ions solvation, decrease in mobility and ionization with micelles formation. The plot of molar conductance, µ, versus square root of concentration, C1/2, is not linear, indicating that SAC behaves as a weak electrolyte in diluted solutions, and that Debye-Hückel-Onsager’s equation is not applicable to these salt solutions [17, 18]. The molar conductance results show that SAC behaves as a weak electrolyte in diluted solutions and, so, the dissociation may be explained in Ostwald’s manner. If C is SAC concentration and α is the degree of dissociation, concentrations of different species may be as given:
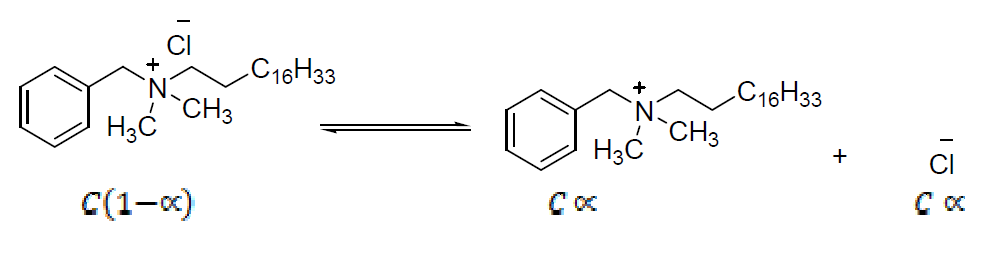
The dissociation constant, KD, may be expressed as:
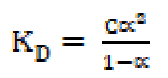 (20)
(20)
Since the number of ions for weak electrolytes is relatively small in diluted solutions, and the inter-ionic effects are negligible, ions activities may be taken as almost equal to the concentrations. The degree of dissociation, α, has been determined effectively by the conductance ratio, (/(o, where ( is the molar conductance at a finite concentration and (o is the limiting molar conductance at infinite dilutions. Substituting α is equal to (/(o and, rearranging equation (20), one obtains the following equation:
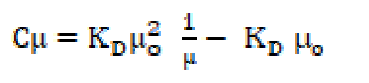 (21)
(21)
The heat of dissociation, ΔHD O, for SAC salt in methanol, is represented by the following expression:
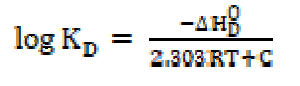 (22)
(22)
The changes in free energy of dissociation, ΔGD O, and in standard entropy, TΔSD O, have been calculated for the dissociation process by using the following expressions:
 (23)
(23)
 (24)
(24)
The changes in free energy, ΔGD O, and in standard entropy, TΔSD O, values, for SAC, calculated by the above cited expressions, are mentioned in Table 3.
In the micellization case, i.e. aggregation process, when counter ions are bound to a micelle, the standard free energy change of micellization, ΔGM O, for the phase separation model, is expressed by the following equation:
 (25)
(25)
where XCMC is the CMC expressed as a mole fraction, and is defined as:
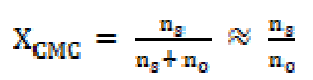 (26)
(26)
where ns and no are the number of moles of the SAC solution and pure solvent, respectively. Since the number of the free salt moles, ns, is small as compared to the number of the solvent moles, ns + no are nearly equal to no, and XCMC can be calculated as ns/no. The standard enthalpy change in micellization for the phase separation model, ΔHM O, is evaluated as follows:
 (27)
(27)
or
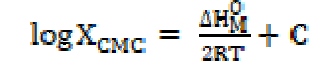 (28)
(28)
The standard change value in entropy of micellization was calculated by the following equation [19]:
 (29)
(29)
The enthalpy change (ΔHM O > 0) positive values indicate that SAC micellization in methanol is endothermic in nature. The SAC micellization in methanol, at 301 K, is in accordance with enthalpy change for micellization, ΔHM O > 0, the free energy for salt micelle formation, ΔGM O < 0, and the standard entropy change for the micellization process, TΔSM O > 0, which are recorded in Table 3. The SAC dissociation in methanol is in accord with the enthalpy of dissociation, ΔHD O ( 0, the free energy change, ΔGD O > 0, and the standard entropy change, TΔSD O > 0 (Table 3). For the dissociation process, the unfavorable free energy change (i.e. ΔGD O > 0) may in fact be due to ion-solvent interactions, i.e. SAC molecules solvation. The free energy, ΔGM O, negative value, and entropy, TΔSM O, positive value favor the micellization process [20]. It is inferred that SAC behaves like a weak electrolyte in methanol. A decisive study of thermodynamic parameters (Table 3) indicates that the micellization route is favored over the dissociation route [21, 22].
Refractive index measurements
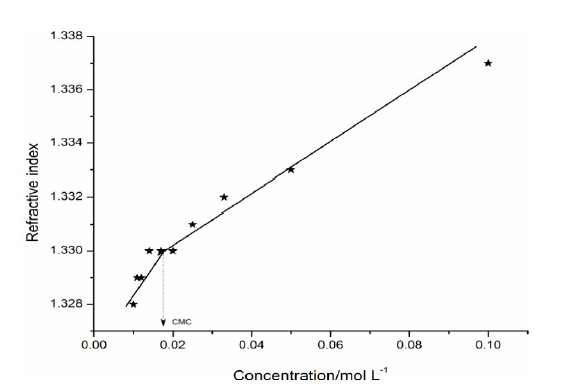
The refractive index of a transparent substance is defined as the ratio of speed of light in vacuum to the speed of light in a medium (SAC solution). The refractive index (n) value increases with higher concentrations (C) (Table 4).
The plot between refractive index v/s concentration shows a sudden change in nature at a particular concentration, i.e. CMC (Fig. 3). The CMC value from the refractometer was found to be in good agreement with ultrasonic velocity and conductivity measurements.
The molar refractivity or molar refraction of a compound is the product of its specific refractivity and molecular weight, being calculated by the following expression:
 (30)
(30)
The molar refraction [R] values increase with higher SAC concentrations (C), which are mentioned in Table 4. Where n and d are the solution refractive index and density, respectively, X1 is the solvent molar refraction, X2 is the solute molar refraction, M1 is the solvent effective molecular weight and M2 is SAC molecular weight [23].
Conclusion
The results indicate that there is a signification interaction between SAC and methanol molecules. SAC behaves as a weak electrolyte in diluted solutions, and Debye-Hückel-Onsager’s equation is not applicable to SAC solutions. The thermodynamic study showed that the micellization process is favored over the dissociation process. The results of ultrasonic velocity, refractive index and conductance measurements indicate that there is a marked change in the ionic species aggregation at CMC.

