


 (pdf)
(pdf)


 SciELO
  SciELO
 Permalink
Introduction
Zinc is a metal with numerous industrial applications, and it is mainly used for steel corrosion protection [1]. It is an industrially important metal and it is corroded by many agents, of which aqueous acids are the most dangerous [2]. Corrosion damage generates high cost for inspection, repairing, and replacement; thus, there is a need for using substances that behave like corrosion inhibitors, especially in acidic media [3]. H2SO4 acid is a strong acid, used as a cleaner for rust, algae and scale from condensers and cooling towers [4]. Aromatic, aliphatic and heterocyclic amines compounds comprising oxygen, nitrogen, or sulfur hetero atoms have been extensively investigated as corrosion inhibitors [5]. The corrosion inhibition efficiencies strongly depend on the inhibitor capability to adsorb onto the metal surface, and on the chemical, physical and structural properties of organic molecules [6]. Many researchers [7-18] studied zinc corrosion inhibition in H2SO4 by various organic inhibitors. Various researchers [19-23] studied zinc corrosion in different acidic solutions. Several studies [24-28] used aniline as an inhibitor for zinc corrosion in different acidic media. The aim of the present study is to investigate aniline inhibition effect on zinc corrosion in various concentrations of H2SO4 solutions, by weight loss, polarization, EIS and SEM techniques.
Experimental
Sample and solution preparation
Zinc specimens, with a chemical composition of 99.39% Zn, 0.49% Mn and 0.12% Co, were used in the present study. Metal sheet test specimens, with a size of 5.0 x 2.5 x 0.2 cm and an effective area of 0.3013 dm2, were used. The specimens were cleaned with distilled water, degreased by acetone, washed once more with doubled distilled water, finally dried, and weighted by an electronic balance. H2SO4 was used as a corrosive solution, with concentrations of 0.1, 0.3 and 0.5 M, prepared by diluting analytical grade of H2SO4, purchased from Merck, using double distilled water.
Weight loss measurements
For weight-loss measurements, the zinc coupons were each suspended and completely immersed in 230 mL of 0.1, 0.3 and 0.5 M H2SO4 solutions, in the absence and presence of different aniline concentrations, at 301± 1 K, for an immersion period of 24 h. After the test, the specimens were cleaned by using a 10% chromic acid solution with 0.2% BaCO3 [29]. After cleaning, test specimens were washed with double distilled water, followed by acetone, dried with an air drier and reweight. From the weight loss data, corrosion rate (CR) was calculated.
Potentiodynamic polarization measurements
For the polarization study, zinc specimens with an area of 1 cm2 were immersed in 230 mL 0.1 M H2SO4, in aniline absence and presence. The test cell (CH instruments, Inc., USA) included the metal specimens as a working electrode, Ag/AgCl as a reference electrode and platinum as an auxiliary electrode. Before each electrochemical measurement, the working electrode was allowed to stand for 50 min in the test solutions, to establish a steady-state open circuit potential (OCP). Polarization curves were plotted with the potential against log current density (called Tafel plots). Cathodic and anodic polarization curves gave cathodic and anodic Tafel lines, correspondingly. The intersect point of cathodic and anodic Tafel lines gave the corrosion current (Icorr) and the corrosion potential (Ecorr) [30]. Cathodic Tafel slope (βc) and anodic Tafel slope (βa) were calculated from the software installed in the instrument.
Electrochemical Impedance Spectroscopy (EIS) measurements
EIS measurements were made (using CH instruments, Inc., USA) at corrosion potentials over a frequency range from 1 KHz to 100 KHz, by a sine wave with a potential perturbation amplitude of 5 mV. The real Z’ and imaginary -Z’’ parts were measured at various frequencies. A graph was drawn by plotting real impedance (Z’) versus imaginary impedance (-Z’’). From the Nyquist plots of Z’ vs Z’’, the charge transfer resistance (Rct) and double layer capacitance (Cdl) were calculated. An experiment was carried out in the inhibitor absence and presence.
Scanning electron microscope (SEM) study
The zinc specimens were immersed in 0.1 M H2SO4 without inhibitor (blank) and with 60 mM of aniline, for one day, at 301 K. After exposure, the specimens were removed, rinsed with double distilled water, dried and observed in a scanning electron microscope to examine their surface morphology. SEM images of polished zinc specimens were also taken. The surface morphology measurements of zinc specimens were examined using a JEOL-5610 LV (Made in Japan) computer controlled SEM.
Result and discussion
Weight loss experiments
The weight loss experiments were carried out in 0.1, 0.3 and 0.5 M H2SO4 solutions with 30, 40, 50 and 60 mM aniline, at 301±1 K, for an exposure period of 24 h.
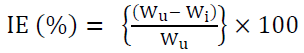
Inhibition efficiency (I.E) was calculated by using the following equation:
 (1)
(1)
where Wu is the weight loss in the inhibitor absence and Wi is the weight loss in the inhibitor presence.
Acid concentration effect
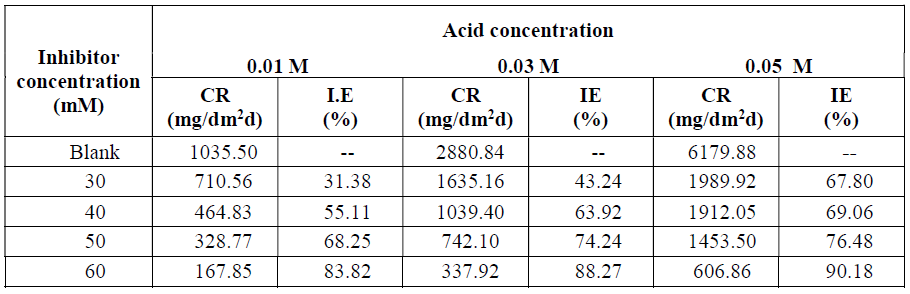
Results showed in Table 1 indicate that, with higher acid concentrations, the corrosion rate increased. The corrosion rates were 1035.50, 2880.84 and 6179.88 mg/dm2.d, corresponding to 0.1, 0.3 and 0.5 M H2SO4 concentrations, respectively, for an immersion period of 24 h, at 301± 1 K. This observation is in agreement with previous works that have been reported [24-28]. The increased corrosion rate with the rise in acid concentrations may be due to an increase in the proton acid (H+) transportation action to the zinc surface, so that the reduction reaction at the cathode in the microscopic corrosion cells is enhanced in the inhibitor absence.
Inhibitor concentration effect
At constant acid content, with higher inhibitor concentrations, the corrosion rate decreased, while IE increased. In 0.5 M H2SO4, aniline shows an IE of 67.80, 69.06, 76.48 and 90.18%, which corresponds to 30, 40, 50 and 60 mM inhibitor concentrations, respectively (Table 1). This observation is in agreement with previous work that have been reported [24-28].
Table 1 H2SO4 concentration effect on zinc C. R. and aniline inhibition efficiency (IE), with various concentrations.
Potentiodynamic polarization study
Fig. 1(a) and Fig. 1(b) represent the potentiodynamic polarization curves for zinc in 0.1 M H2SO4, without and with 60 mM aniline, respectively.
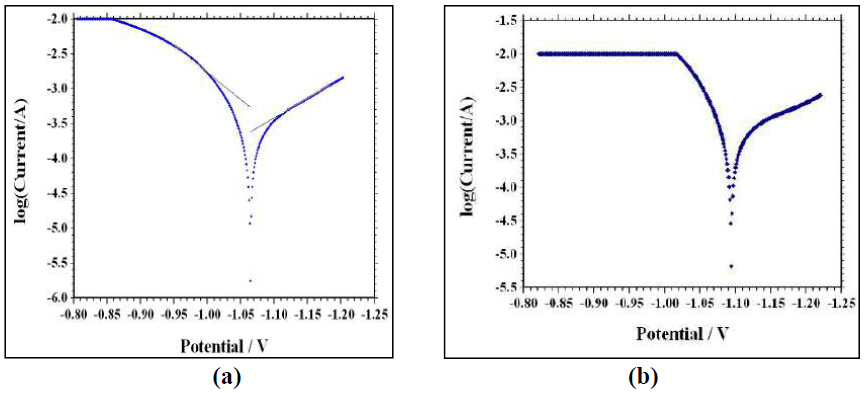
Figure 1 Tafel polarization curves (a) for Zinc in 0.1 M H2SO4 without inhibitor and (b) with 60 mM aniline.
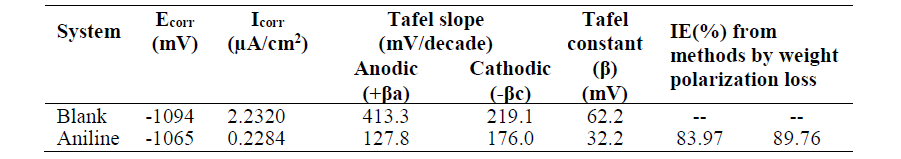
Electrochemical parameters, such as Ecorr, Icorr, βa, βc, β, Tafel constant and IE percentage are given in Table 2.
Table 2 Potentiodynamic polarization data and aniline IE for zinc corrosion in 0.1 M H2SO4, at 301 K.
IE from the polarization study was calculated using the following equation [31]:
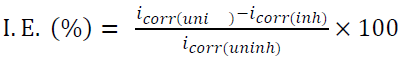 (2)
(2)
where icorr(uninh) and icorr(inh) are the corrosion current density for the uninhibited acid and inhibited acid, respectively. Icorr was determined from Tafel extrapolation and linear polarization resistance measurements. It can be seen from polarization curves that they moved towards a lower current density region, in the inhibitor presence. It can also be noted that both anodic and cathodic curves shifted towards lower current densities in the inhibitor presence, without much change in Ecorr values. This finding suggests that investigated aniline inhibits zinc corrosion in an acidic solution by forming a surface film, without changing zinc corrosion mechanism. Here, the inhibiting action can be explained by a simple obstruction of the metal surface active site. In other words, the corroded area reduction is carried out by the surface covering by adsorbed organic molecules. From Table 2, it is observed that aniline addition to the acidic solution causes significant decrease in the corrosion current density (Icorr) and a corrosion rate lower than that of the blank. In general, an inhibitor is anodic or cathodic if the variation in Ecorr against the blank is higher than or above 85 mV [32]. In the present study, the Ecorr displacement was 29 mV (Table 2), which suggests that aniline functions as a mixed type of inhibitor, at 301 K, probably due to the heteroatom (N-atom) electron density. Inhibition efficiencies calculated from the corrosion current obtained by the extrapolation of the cathodic and anodic Tafel lines are given in Table 2. IE from Tafel plots agree well (within ± 6%) with the values obtained from weight loss data.
Electrochemical Impedance Spectroscopy (EIS) measurements
EIS is a useful tool for studying the electrode surface behavior and predicting the corrosion rate. Nyquist plots, for zinc corrosion in a 0.1 M H2SO4 solution without and with aniline, were examined by the EIS method, at room temperature, as shown in Fig. 2a and Fig. 2b. EIS parameters are shown in Table 3. The capacitive loop diameter in the inhibitor presence is larger than that in the inhibitor absence. The high frequency capacitive loop is related to Rct. To calculate Cdl, the frequency at which the imaginary component of the impedance is maximum was found as presented in the following equation [33]:
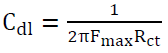 (3)
(3)
where F is the frequency at the maximum height of the semicircle on the imaginary axis [34].
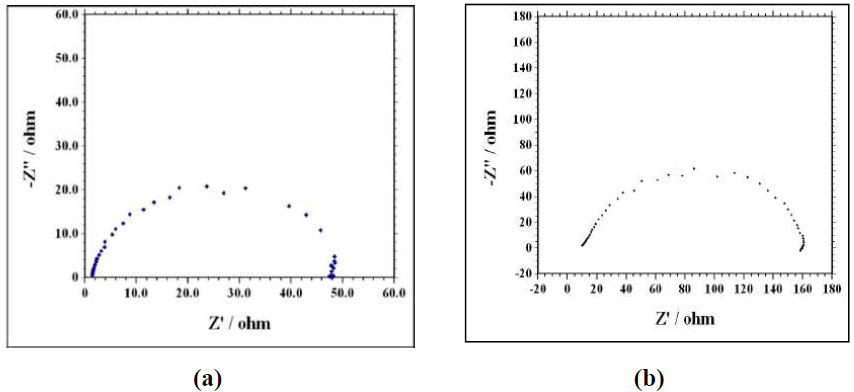
Figure 2 Nyquist plots for zinc corrosion in 0.1 M H2SO4 (a) without inhibitor and (b) with 60 mM of aniline.
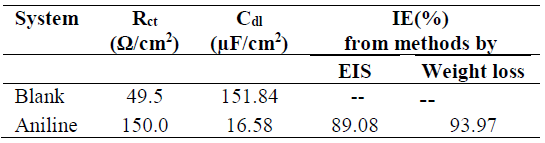
IE from the EIS method was calculated using the following equation:
 (4)
(4)
where Cdl(uninhi) and Cdl(inhi) are the double layer capacitance for the uninhibited and inhibited acid, respectively. The inhibitor addition increases Rct values from 49.5 to 150.0 Ω cm2, and decreases the Cdl values from 151.84 to 16.58 µF/cm2, which is due to the inhibitor adsorption onto the metal surface. The increase in Rct values was caused by the gradual replacement of water molecules by the inhibitor molecules adsorbed onto the metal surface, forming an adherent film that reduces the extent of dissolution [35]. Moreover, the adsorbed inhibitor species decrease the electrical double layer values at the electrode/solution interface, and, therefore reduce the Cdl value [36]. It was observed from Fig. 3(a) and Fig. 3(b) that the impedance diagram was an imperfect semicircle. The difference has been attributed to frequency dispersion [37]. The semicircle nature of the plots indicates that zinc corrosion was mainly controlled by the charge transfer process.
Scanning electron microscope (SEM) measurements
To understand the surface conditions of the metal specimens, in the inhibitor absence and presence, SEM images were taken. The SEM images are shown in Fig. 3a-c. The SEM image of the freshly polished MS (Fig. 3a) shows a smooth surface, whereas in the 0.1 M H2SO4 medium (Fig. 3b) it shows a heterogeneous surface with large pits, which indicates that the metal underwent pitting corrosion in the H2SO4 medium [38]. In contrast, zinc SEM image, after the addition of 60 mM aniline to the 0.1 M H2SO4 medium, showed a decrease in the number of pits and an increase in the surface smoothness (Fig. 3c).
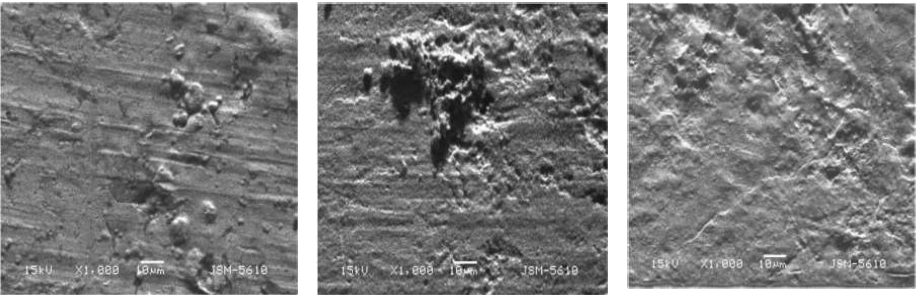
Figure 3 Zinc surface SEM images: (a) of polished zinc (b) of zinc immersed in 0.1 M H2SO4 and (c) of zinc immersed in 0.1 M H2SO4 with 60 mM aniline (X 1000).
Mechanism of inhibition by aniline
The corrosion inhibitor mechanism is believed to be due to the formation and maintenance of a protective film on the metal surface. Aniline is a weaker base than the primary aliphatic amines, due to resonance, which is not possible in aliphatic amines. Aniline resonance structure is shown in Fig. 4.
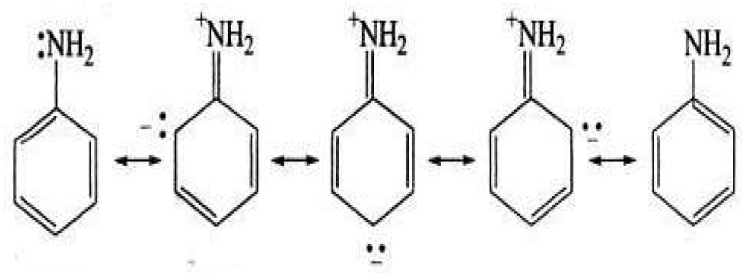
Due to resonance, in aniline, the lone pair of electrons on the nitrogen atom is less available for coordination with a proton than that in aliphatic amines, where the resonance phenomenon is not possible. In addition to this, the small positive charge on the aniline N-atom, due to resonance, tends to repel the proton. Thus, aniline becomes less basic [39] and, on accepting a proton, may produce a small concentration of the C6H5 +NH3 cation (onium) which does not show resonance. As there are more resonating structures possible for aniline than for the onium ion, the former will be stabilized with respect to the latter [40]. It appears that the amino group nitrogen atom (-NH2) in aniline acts as the reaction center (polar function), because of its higher electron density. This reaction center forms a monolayer on the zinc surface. Moreover, aniline assumes a small positive charge in acidic solutions, due to the amino (-NH2) group protonation, as the higher electron density of the nitrogen atom facilitates the protonation. With higher inhibitor concentrations, the protonation rate increases. The successive increase in protonation may be responsible, in many cases, for the IE enhancement.
Conclusions
From this study, the following conclusions can be drawn:
With higher acid concentrations, the corrosion rate increases.
At constant acid concentrations, with higher inhibitor concentrations, the corrosion rate decreases, while IE increases.
Maximum IE of 90.18% was obtained with 60 Mm aniline concentration in 0.5 M H2SO4.
Polarization curves indicate that aniline act as mixed type of inhibitor.
SEM reveals the formation of a smooth surface on zinc, in aniline presence, probably due to the formation of an adsorptive film of electrostatic character.
EIS spectra are semicircular in appearance which indicates that zinc corrosion is mainly controlled by a charge transfer process.
It was found that there is a good agreement between the different tested techniques.
Acknowledgement
The authors are thankful to the Department of Chemistry, Navyug Science College, Surat, for providing laboratory facilities.
Authors’ contribution
R. T. Vashi: this paper is a part of the Ph. D. Thesis of his student S. A. Zele and he has had guided him for the preparation of this article. S. A. Zele: conceived and designed the analysis; prepared and designed this paper under the guidance of co-author Dr. R.T. Vashi; collected all the experimental and other data which are presented in this paper; gave the analytical instruments detailed in the text of this paper; performed all the analyses presented in this paper; wrote this paper. N. I. Prajapati: provided support and help in the preparation of the paper of S. A. Zele.

