


 Inglés (pdf)
 Articulo en XML
 Referencias del artículo
 Enviar articulo por email
 Citado por SciELO
  Similares en
SciELO
Similares en
SciELO 
 Permalink
Introduction
Heavy metals possess a relatively high density, atomic number and weight. Some heavy metals are highly toxic and dangerous to human life, and can disrupt the ecosystem. They tend to accumulate in sediments, mangrove, fish, shrimp, crab shells and other environments, and eventually enter the human body through the food chain system. One example of dangerous heavy metals is Pb 1-2. According to the World Health Organization (WHO), there is a maximum exposure limit of 30 g/dL Pb in adults and 10 g/dL in children, which, if exceeded, can endanger human health. At the same time, the European Water Framework Directive (WFD) recommends that the traceable Pb limit in drinking water should not exceed 7.2 g/L 3-5. Therefore, Pb presence in the environment needs to be regularly monitored.
Generally, some equipment has been used to measure the Pb content, such as UV-vis spectroscopes, inductively coupled plasma-mass spectrometers (ICP-MS) and atomic absorption spectroscopes (AAS) 6. All these tools are very accurate. However, usually, they have a weakness related to their large size, which makes difficult to perform in situ measurements with them 4.
This shortcoming has driven researchers to develop rapid techniques and measurement tools that can be used to quantify Pb in sites. Amongst them, Deswati et al. (2016) and Touzara et al. (2020) have recommended fast sensor measurers using voltammetry techniques 7-8. Besides them, other methods explored are optical 6 and piezogravimetric sensors 9, surface acoustic wafts (SAW) 10 and DNA biosensors 11. Unfortunately, most of the developed techniques still have drawbacks, such as costly and complex preparation processes, being sensitive to environmental changes in the sample, and requiring special equipment. Another alternative that can be used is the potentiometric measurement technique. It is relatively simple, easy to operate, has a fast response time, does not depend on colour changes and is cheap 12. Moreover, it can be integrated into multi meters with potential output specifications of, at least, -900 to +600 mV 13. The concept of this measurement is based on the potential difference between working and reference electrodes (WE and RE) vs. the logarithm of the sample ion concentrations. The technique is carried out in the absence of current conditions, and follows the Nernst phenomenon 14.
The WEs used in the potentiometric technique were ISE, since, usually, on the electrodes surface, there is a thin film or membrane that is sensitive to the ions targeted to be measured, such as Pb2+. Typically, the membrane used in ISE preparation is poly(vinyl) chloride (PVC). However, this membrane has some disadvantages, such as a long and complicated preparation time, poor adhesion onto the electrode surface, and the required use of a plasticizer to modify its mechanical properties 4.
Another alternative is to use an acrylate-based membrane previously developed by researchers. The advantages of acrylate-based membranes include having a good adhesion on the electrode surface, working without the use of a plasticizer and being quickly prepared by photopolymer techniques 15-16. An example of an acrylate-based membrane for Pb (II) detection, reported by Michalska et al. (2009), consists in poly-butyl acrylate (p-BA) fabricated through the photo-polymerization method. The pBA sensor performance is observably good, with a measurement range from 10-2 to 10-9 M 17. However, it has a very low transition glass (Tg) property value of 218 K or -55 ºC, so that it is very soft and sticky like glue, which makes it to be easily torn and ruptured (4, 18).
Besides p-BA, another acrylate membrane is methyl methacrylate-butyl acrylate (MMA-BA) copolymer, developed by Liu et al., using the thermal polymerization technique, for 16 h. The sensor fabricated by the authors also has a fairly good performance, and a measurement range from 1.5 x 10⁻³ to 2 x 10⁻¹⁰ M 18. However, because the polymerization process is too long, the preparation costs are high.
In the present study, an effective method to produce a sensor for Pb2+ has been developed by the photo-polymerization of a MMA-BA copolymer membrane. Fourier transform infrared spectroscopy (FTIR) technique was used to characterize the sensor film resulting structural properties. Its performance has been evaluated through Nernstian numbers, linear range, LOD, CE, pH effects and real samples testing.
Experimental
Apparatus and instrumentals
The equipment used in this study included the Corrtest CS350 potentiostat (Wuhan Corr Test Instrument Corp. Ltd.), a Double Junction Orion 900200 Ag/AgCl reference electrode (Thermofisher Scientific), a 2B PG WE, with a diameter of 0.5 mm (Faber Castell), a FTIR (Thermoscientific Nicolet iS-10), an UV1800/PC Laboratory UV-Vis Spectrophotometer (Shanghai Meipuda) and an UV-box exposure (Huanyu Instrument).
Materials
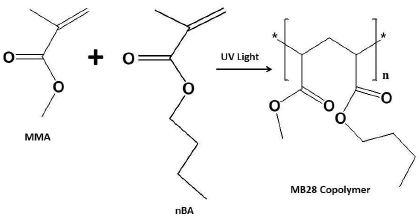
In this research, several chemicals have been used: deionized water (DIW), pyrrole 98% (Py) and 2-hydroxyethyl methacrylate (HEMA) monomers, lead nitrate (Pb(NO3)2), potassium chloride (KCl), ammonium chloride (NH4Cl), sodium chloride (NaCl), magnesium chloride hexahydrate (MgCl2.6H2O), cupric chloride dehydrate (CuCl2.2H2O), cadmium nitrate tetrahydrate (Cd(NO3)2.4H2O), tris(hydroxymethyl)aminomethane (TrisHCl), sodium hydroxide (NaOH), hydrochloric acid (HCl) (the salt solutions used to perform sensor tests), ammonium hydroxide (NH4OH), crystalline potassium cyanide (KCN) and dhitizone nitric acid (HNO3) (used for the validation process) were from Merck; methyl methacrylate (MMA) and n-butyl acrylate (nBA) monomers, 1,6-hexanediol diacrylate (HDDA) polymeric cross-linker, 2,2-dimethoxy-2-phenylacethophenone (DMPP) photo-initiator, lipophilic salt potassium tetrakis (4-chlorophenyl) borate (KTpClPB) and Pb ionophore IV selectophore (the active ingredients used in the fabrication of the sensor membrane layers) were from Sigma Aldrich; the buffer solutions (BS), with pHs 4, 7 and 10, were from Thermofisher Scientific; the epoxy resin used was epoxy glue, from Araldite. All of these chemicals were used without additional purification.
Experiments
MB28 synthesis and FTIR characterization
800 mL MMA were mixed with 200 mL NBA, 10 mL HDDA and 10 mg DMPP. The mixture was shaken until it was homogeneous, evenly dripped onto the microscope glass slide surface, placed in the UV-box, and further photo-polymerized for 5 min, under nitrogen (N) gas flow conditions. After the photo-polymerization process was completed, a thin MB28 copolymer layer was formed. The polymeric membrane was further analysed using FTIR spectroscopy.
PGE preparation
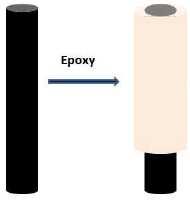
Firstly, a 2B PG with 2 cm length was cleaned with DIW and swept dry with tissue paper. Then, 1:1 mixture of epoxy/hardener was vigorously stirred until it was homogeneous, and used to coat all sides of the 1.5 cm PG rod, to form the PGE body layer, as shown in Fig. 1. The epoxy coat was left to dry for 1 h. After the PGE was formed, its surface was rubbed with a fine sand paper, and washed multiple times with DIW, until it was clean.
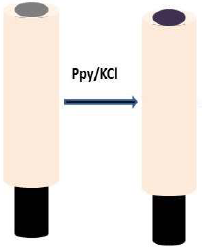
Two PGEs (WE and counter electrode (CE), respectively) were connected to a double junction type Ag/AgCl reference electrode (RE), and immersed into a 0.1 M KCl solution, to form a three cell configuration setup. Then, the three electrodes were connected to a potentiostat device, and further characterized using cyclic voltammetry (CV) technique. The scanning range applied was from -1 V to 1 V, for 1 cycle, at a scan rate of 100 mV/s. Subsequently, after the PGE characterization, the p-Py coating process was performed on the top of the electrode surface.
Polypyrrole deposition
The p-Py coating process was carried out by performing CV, whereby the three electrodes were immersed in a coating mixture of a 0.5 M Py monomer solution and 0.1 M KCl as a dopant, and then connected to a potentiostat device. The electropolymerization process was carried out in the range from -1 V to 1 V, for 10 cycles, at a scan rate of 100 mV/s. After the p-Py coating process was finished, a dark purple layer was formed on the PGE surface, as shown in Fig. 2.
The PGE/p-Py formed was rinsed with DIW and wiped dry. Furthermore, its characterization process was carried out using CV in a 0.1 M KCl solution, likewise for the PGE procedure. Then, the PGE/p-Py was one more time rinsed with DIW, dried with tissue paper, soaked overnight in a pH 7 BS inside a dark container, thoroughly washed again with DIW and wiped dry. Next, the PGE/Ppy pH response was tested in a BS of pH 4, 7 and 10, with potentiometric measurements, whereby the sensor was paired with the RE, and connected to a potentiostat device. Then, the resulting potential value was recorded and plotted in electromotive force (EMF) vs Log[H+], to get the Nerstian number.
Pb-ISE preparation
Prepared and characterized PG/p-Py electrodes were coated with a membrane made in two stages, to form Pb-ISE.
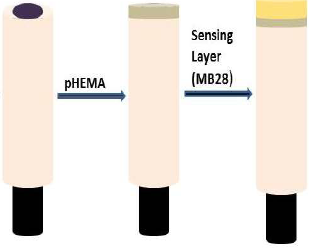
In the first step, PG/p-Py electrodes were rinsed with DIW and wept dry with tissue paper. Next, the PGE/p-Py layer surface was drop coated with a 0.5 L HEMA monomer that had been previously prepared, with the composition ratio of 500L HEMA:0.5 L HDDA:6.2 mg DMPP. Then, the electrodes were subjected to a photo- polymerization process, for 5 min, under N gas flow conditions, after which a transparent pyrrole-HEMA (p-HEMA) thin film layer was formed. After that, the p-HEMA surface was dropped with a 0.01 M Pb(NO3)2 solution, during 30 min, for the hydration process. Finally, the electrodes were wiped with a tissue to remove the remaining Pb(NO3)2 solution.
In the second step, the p-HEMA surface was drop-coated by 2.5 L MMA:nBA of a monomer mixture which was prepared mixing 20 L MMA with 80 L nBA, 1 mg KTpClPB, Pb ionophore of various compositions, 0.1 L HDDA and 1 mg DMPP. The photo-polymerization process was carried out for 3.5 min under N gas flow, to form a MB28 film layer, as shown in Fig. 3. Finally, the formed Pb-ISE was conditioned in a 0.01 M Pb(NO3)2 solution, for 1 h, before the sensor testing.
Results and discussion
FTIR characterization
The MB28 thin film newly synthesised copolymer was further investigated before being used as a sensing host matrix, since it was important to ensure that it had been formed 19-21. In this study, the copolymer structural analysis was performed using FTIR, by which the MB28 spectrum was compared with those of the nBa and MMA monomers, as shown in Fig. 4. In general, the FTIR spectra were divided into two main region areas: the main peak area, in the range from 1400 to 4000 cm-1, and the fingerprint area, in the range from 400 to 400 cm-1, (20.
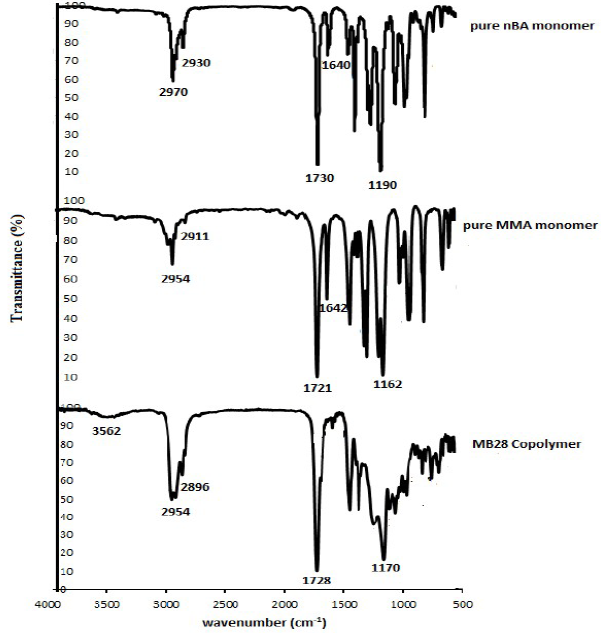
Fig. 4 shows that the MB28 copolymer film has been formed, which can be seen from several new peaks that have appeared, and also from some peaks that are missing in the image. In addition, other indicators of the MB28 copolymer formation are a shift in the monomer peak, and slight changes in the peak intensity and in the spectra shape. These alterations are due to a phase change, whereby the nBA and MMA monomer phases were in liquid form, while the MB28 copolymer was solid. In addition, other modifications are structural changes caused by the formation of new materials that are different from the monomers 21.
To facilitate the discussion, this study focused on several alterations in the MB28 copolymer. Some of the changes that occurred include the appearance of a broad band in the area of 3562 cm-1, which is the -OH from water vapour trapped in MB28 19. In the area of 2800-3000 cm-1, there is also shifting, shape and intensity changes in the spectrum peak. This area is the peak of stretching vibration, which is a contribution from the C-H covalent bonds originated by methylene (-CH2) and methyl (-CH3) derived from nBA and MMA monomers. In this area, after polymerization, the copolymer intensity is higher than that of nBA and MMA. While the shift occurred from 2970 to 2930 cm-1 in pure nBA, and from 2954 to 2911 cm-1 in pure MMA), it appeared from 2954 to 2896 cm-1 in MB28 copolymer 19,22-24.
In this study, a sharp peak can be seen on the band of 1728 cm-1, which is a C = O functional group originated from a carboxylate contained in the MB28 copolymer. This peak is a shift from the peaks, in the areas of 1730 cm-1 and 1721 cm-1, of the nBA and MMA monomers, respectively. Areas from 1650-1 to 780 cm-1, with sharp and strong bands, are typical of C = O functional groups 19-20,22-25.
Meanwhile, the most important indicator is the loss of sharp and medium peaks in the area from 1600 to 1680 cm-1, which is a C = C functional group. In this study, the C = C functional group of the nBA and MMA monomers appears in the areas of 1640 cm-1 and 1642 cm-1, respectively 22. The loss of these peaks is due to the occurrence of covalent bonding knots between -C and C-, which form the backbone of the MB28 copolymer. These covalent bonds are the C = C contribution from each monomer, as shown in Fig. 5, which is the photo-polymerization reaction scheme of MB28 copolymer 18.
In the 1170 cm-1 area, a sharp and strong peak was formed in the MB28 copolymer. This peak is a stretching vibration of the -C-O-C- functional group, and it also represents the spectra displacements in the 1190 cm-1 and 1162 cm-1 areas of the nBA and MMA monomers, respectively 19,22-25.
Poly-pyrrole-Cl (p-Py-Cl) deposition and characterization
In the sensor fabrication, the signal stability is an important characteristic to be considered, since it will affect the measurement range, as well as the Pb-ISE LOD 26). Several factors that affect the signal stability include the type of transducer and membrane, the sensor inner layer, and the presence of disruptive ions 18, 27);. Carbon (C) electrodes were selected as transducers in this study, because they are not easily subjected to oxidation, when compared with Ag/AgCl electrodes that can be oxidized, forming Ag2O layers 4,14,28). In this research, the C electrode used was 2B GP, because of its advantages, such as being cheap, easy to use, repeatedly usable, and possessing a resistance lower than 5 ohms, which is suitable to an electrode 28.
To increase the Pb-ISE sensitivity in this study, the GPE surface was coated with a conducting polymer material made of p-Py doped with Cl (p-Py-Cl). Based on previous research, this sensor with a conducting polymer layer shows a more stable drift than that from ISEs which only use C electrodes 27,29-31, because O2 and CO2 may be trapped and form bubbles on the surface between the ISE membrane and C, during the conditioning and measurement processes. This phenomenon can be reduced by the presence of conducting polymer layers such as p-Py-Cl. Besides that, Cl also functions as a counter ion on the transducer surface, stabilizing its potential 30-31.
Three PGE were provided for the p-Py-Cl deposition and characterization process. The p-Py-Cl material was selected as conducting polymer in this study since it has a very easy preparation process, good stability, high conductivity, and can be applied in various types of electrodes 32-34. The p-Py-Cl coating process on the transducer surface was done by CV. The p-Py-Cl layer formed on the PGE surface was then characterized by CV and pH response testing, of which results can be seen in Fig. 6 and Table 1.
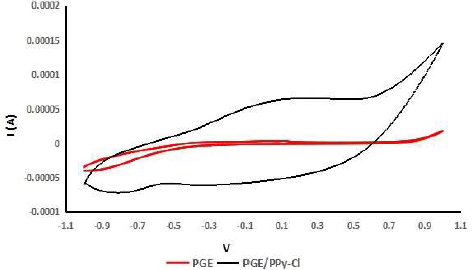
On Fig. 6, it can be seen a significant difference between the pattern in the voltammogram graph of PGE (before coating) and PGE/p-Py-Cl (after coating). The PGE CV does not show any characteristic oxidation or reduction peak in the area from -1 to 1 V. This is mainly because the PGE has inert properties, so, it is not prone to experience redox reactions. On the contrary, the oxidation and reduction peaks in PGE/p-Py-Cl occurred at 0.14 V and -0.87 V, respectively, which is in agreement with the results reported by previous studies 35.
In Table 1, the three PGE/p-Py-Cl electrodes show values in the range from 50.4 to 53.1 mV/dec, close to the Nernstian numbers for mono ion valence, in the range from 50 to 60 mV/dec 14,36. One of the unique characteristics of p-Py-Cl is that it has the tendency to protonate by releasing its proton (H+). Hence, the potential value on the PGE/p-Py-Cl surface is mainly dependent on the change in the pH values from the sample environment. This is why, in the present study, the pH response test was selected 35,37.
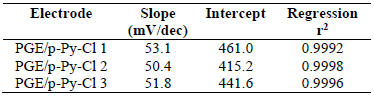
The intercept values shown in Table 1 are quite different from each other, which indicates that the signal generated from each electrode also varied. These changing signals that are caused by the PGEs manual sanding process produce various results in terms of surface roughness, which has a poorly controlled impact on the p-Py-Cl film that covers the rough electrodes surface 19. However, all three electrodes have met the criteria as transducers in the Pb-ISE sensors.
Optimization of Pb-ISE membrane composition
The composition of a membrane plays an important role in the fabrication process of an ISE sensor, since it will affect its performance parameters, such as the linear range, LOD, CE, lifetime and stability 33,38-39. For that reason, in this study, the optimization process for the Pb-ISE membrane composition has been carried out through the use of seven sensors, as shown in Table 2. The prepared Pb-ISEs were then tested using a variation of the targeted Pb(NO3)2 ion concentration, and the response of each sensor can be seen in Fig. 7.
Table 2 Pb-ISEs performance based on the sensors compositions in various concentrations of a Pb(NO3)2 solution.
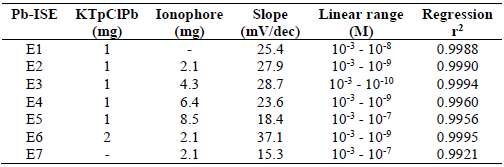
Fig. 7 and Table 2 show that E1, E2 and E3 Pb-ISE sensors have a satisfactory Nernstian number for divalent ions, close to the theoretical value of 29.6 ± 5 mV/dec. Overall, the optimum material composition is displayed by E3, with a Nernstian number of 28.7 mV/dec, and a broad linear range from 10-3 to 10-10 M. The KTpClPB lipophilic salt was used in this study, since it helps to increase ISE negative footprint, causing a decrease in its resistance, which facilitates positively charged ions, such as Pb2+, to enter in it. This will cause a change in the potential of the sensor transducer surface. The increased lipophilic salt concentration will produce higher Nernstian numbers, because more Pb2+ ions will enter 4,39. This can be seen from E1, E6 and E7, which have Nernstian regular, considerably high and, with only an ionophore, negative responses, respectively.
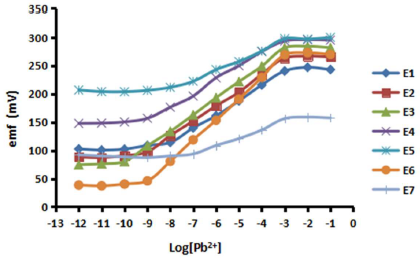
Figure 7 Pb-ISEs response variations based on the sensors compositions in various concentrations of a Pb(NO3)2 solution.
Besides the lipophilic salts, another important component used in this study is the Pb IV ionophore. Ionophores have been used in several previous researches, because they provide for a fairly good performance of the sensor. They have a role in the target ion recognition which, herein, is Pb2+, so that their concentration will affect the fabricated Pb-ISE sensitivity. Table 2 and Fig. 6 show that the ionophore addition, as in E2 and E3, increases the Pb-ISE response and the linear range. With the ionophore, the Pb2+ ion brought to the transducer surface will be even stronger 4,33,38.
However, an excessive amount of ionophores will cause a decrease in the sensor response. For instance, a very high ionophore composition of E4 and E5 produces a sub-Nernstian response, and also a shorter linear range (up to 10-9 M) than that of E3. This causes too many Pb2+ ions to diffuse into the membrane and produce too high a charge, while too low a charge, such as that from NO3 -, comes from the hydration process, making the p-Py-Cl- ion excessively weak. This leads to charge imbalance inside the membrane, which makes Pb2+ to move into the sample, following Le Chartlier equilibrium principle, so that a new balance is reached 4.
Pb-ISE response and comparison study
In the ISE sensor fabrication process, including Pb-ISE, the response study is very important. It can be said that almost half of the fabrication process is stated to be achieved if it has fulfilled Nernstian numbers, within a certain linear range length. When the Pb-ISE sensor is immersed into the sample solution, Pb2+ is partially extracted from the membrane, by following Le Chartlier principle of equilibrium, as illustrated in equation 1.
 ***
***
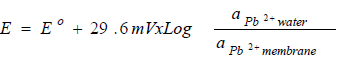
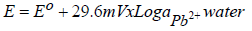
where E is the potential, Eº is the standard potential, 29.6 mV is a Nernstian number and ɑ is a slope of the log change in Pb2+ activity. A stable Pb-ISE sensor response is obtained when the Pb2+ concentration in the membrane is equilibrated with that in the solution. However, since the surface area of Pb-ISE is much smaller than that of the solution, Pb2+ number in the sensor is lower. Therefore, it can be ignored, and the alterations in the potential of the sensor become very dependent on the Pb2+ concentration changes in the solution. Therefore, equation 1 can be simplified into equation 2:
 ***
***
In addition, because the membrane thickness, type and composition are fixed, equation 2 is reduced to equation 3 4.
 ***
***
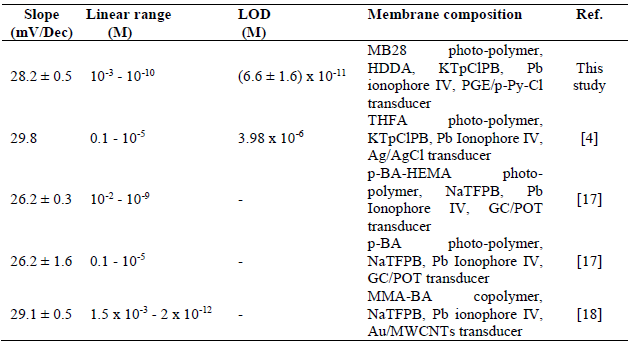
In this study, three Pb-ISE sensors were provided, and their membrane was used at its optimum composition, as in E3. The obtained response is shown in Fig. 8 and summarized in Table 3, along with the comparison of the Pb-ISE response with that of sensors based on acrylic membranes developed by previous researchers.
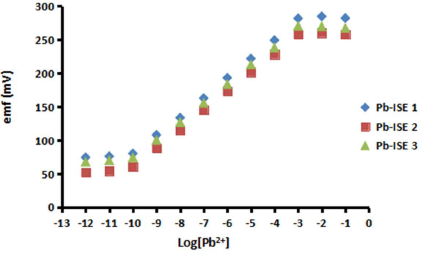
Based on Fig. 8, it can be seen that, at the concentration from Log [Pb2+] -1 to -3 (0.1 to 10-3 M), all the sensors show constant plateau signal changes. This unfavourable outcome reveals that, at high Pb2+ concentrations, the large gap between its number in the solution and in the membrane (pHEMA) layer interior is due to this plateau affect. Consequently, Pb2+ excess diffuses into the membrane, becoming saturated at the P-Py-Cl transducer surface, and some of it flows out to achieve its equilibrium potential 33.
Meanwhile, at the solution concentration range from 10-3 to 10-10 M, the difference in the number of Pb2+ in the membrane (10-2 M) is not greater than at higher concentrations. It attracts Pb2+ to be diffused into the membrane towards the transducer surface, and gradually decreased with the solution logarithmic concentration, making ions equilibrium easily achieved. The reduction in the potential change will follow the Nernst equation, as in equation 3. In this study, the obtained Nernstian number was 28.2 ± 0.5 mV/dec. At concentrations higher than 10-10 M, Pb2+ in the solution was too low. This is due to the limited number of Pb2+ entering the membrane, so that the sensor has not enough capacity to change the transducer surface energy potential 4,19.
LOD is one of the important parameters for determining the sensor ability to detect the minimum ion concentration. In this study, we have achieved a LOD of 6.6 ± 1.6 x 10⁻¹¹ M. This LOD value was obtained from the extra polarization of the point of intersection between the slope and the Pb-ISE sensor response graph imaginary line of the horizontal region 19.
As shown in Table 3, the Pb-ISE produced in this study exhibits a significantly good performance. The result goes beyond the previous report, showing sub ppm detection values as low as 10-11 M. This is inseparable from the characteristics of the MB28 photopolymer membrane that has a low Tg of around -23 ºC, based on the Fox equation 18. This low Tg helps to reduce the membrane resistance, and promotes the penetration of Pb2+ inside it, towards the transducer surface 4,18,33.
Coefficient selectivity
The coefficient selectivity test is one of the main tests carried out in the sensors, such as Pb-ISE, fabrication process. This test aims to measure the Pb-ISE sensor ability to respond to targeted ions, such as Pb2+, in the presence of interferents. The real water sample content, such as river, medical sample, environment etc., generally does not consist of a single ion, since there are other ion contents that have the potential to interfere with the Pb-ISE sensor reading 19.
In this study, a separated solution method (SSM) selectivity test was performed using three Pb-ISE sensors. This is a favourable technique, due to its rapid testing process 14. SSM testing was done by comparing the energy potential values of the Pb-ISE sensor in the solution containing Pb2+ with those in solutions with interfering ions. Then, the calculation was done by following equation 4:
 ***
***
where EB and EA are the energy potential of the Pb-ISE sensor in the interfering ion solution and in the main solution containing Pb2+, respectively. S is a standard Nernstian number that, for charged ions, is 29.6 mV, while ZA and ZB are the main and disruptive ion charges, respectively. LogaA is the logarithmic concentration of the test solutions, which, in this study, was 0.001 M for both main and interfering ion solutions 30. The interfering ions used in this test were K+, Na+, NH4+, Mg2+, Cu2+ and Cd2+. The selection of the six interfering ions was based on the fact that, since they are one of the standard parameters often used for determining drinking water quality, they have the potential to be present in real samples. The coefficient selectivity results of the fabricated Pb-ISE sensor are shown in Table 4.
Table 4 Coefficient selectivity values of Pb-ISE sensors in various types of interfering ions (n = 3).
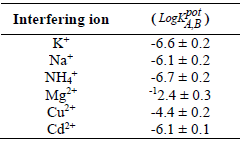
According to Table 4, the fabricated Pb-ISE sensors showed fairly good coefficient selectivity values that were close to those of other reported researched work 4. Sensors testing with all cationic interfering ions showed negative values which the more pronounced they are, the better the Pb-ISE sensor performance corresponding to Pb2+, even in the presence of interfering ions 39. This Pb-ISE capability is inseparable from Pb ionophore IV that belongs to amide groups. The Pb ionophores of the amide group are known to have good selectivity 4.
pH effect
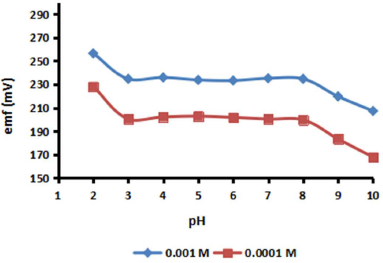
The purpose of this test was to study the pH effect on primary Pb2+, and also to estimate the Pb ionophore IV stability, which depends on the environmental pH. In the process of measuring Pb2+, especially in in situ samples using the ISE sensor, it is important to investigate their behaviour. In reality, water samples in the field have acidic or basic varying conditions. Naturally, this effect will reduce the ISE sensor accuracy and precision 4,40. In this study, the Pb-ISE sensor was tested using a Pb(NO3)2 solution with concentrations of 0.001 and 0.0001 M. Each test solution was conditioned from pH 2 to 10, using TrisHCl. The Pb-ISE sensor response with various pH values can be seen in Fig. 9, which shows that it has a higher potential value.
This is inseparable from the Pb ionophore IV deprotonization, which is made by releasing H+, so that the positive ion charge in the membrane increases on the PGE/p-Py-Cl transducer surface 4. At pH above 8, Pb2+ in the sample forms solid Pb(OH)2. This is due to the lower Pb2+ in the solution, compared to the predominant pH. Thus, only a small portion of Pb2+ diffuses into the membrane and shows sensors change in the potential 27,40-41. This condition implies that the Pb-ISE sensors developed in this study work effectively from pH values 3 to 8.
Validation test
The sensor validation test was performed to ensure that the fabricated Pb-ISE sensor performance was comparable to that of the standard method, by showing high accuracy and precision for Pb2+ determination in a sample 19,30. In this test, three Pb-ISE sensors were provided and tested with the artificial Pb2+ solution, with concentrations from 25 to 100 ppm, and with river water samples. The validation test result was then further compared with the standard method, using a UV-vis spectrophotometer, with the dithizone reagent, in accordance with APHA3500-Pb B 42. The comparison measurements using Pb-ISE sensors and standard UV-vis methods can be found in Table 5.
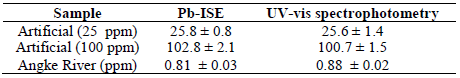
Real water samples were collected from the Angke river, with the coordinates of South Latitude (LS) 6o10’19.59 and East Longitude (BT) 106o43’59.03. The Angke River was chosen, because it flows, through the densely populated residential settlements and industrial areas, to the Jakarta Bay. This situation has the potential of heavy metal pollution (such as Pb), because the population is usually dense, and the space for household waste disposals is very limited. Eventually, the community will dispose their domestic wastes into the river. An example of domestic waste containing Pb is usually discharged batteries. In addition, the industrial sector has also contributed to the increase in Pb2+ concentrations in river water, because some industries, such as paint industry, use Pb as pigment 43. In this study, the Pb2+ content measured from the Angke River, using Pb-ISE and UV-vis, was 0.81 ± 0.03 and 0.88 ± 0.02 ppm, as shown in Table 5. This indicates that Pb2+ in the actual sample has exceeded the allowable limit of 7.2 g/L, as proposed by WFD. The present study confirmed that this finding was also made by previous reports which stated that the harmful Pb content in the Angke River water was in the range from 33 to 46 mg/Kg, and that Pb2+ in the sediments could be released into the water 43-44.
Conclusion
The MB28 copolymer thin film membrane has been successfully synthesized through the photo-polymerization technique, and its properties were characterized using FTIR. Furthermore, this membrane was synthetized on the top of the PGE/p-Py-Cl transducer layer, and it has been successfully tailored as a supporting matrix in Pb-ISE fabrication. The sensor fabrication process can be performed easily, quickly and at affordable costs. PB-ISE has exhibited an outstanding performance. This can be seen through its response, which follows the Nernstian numbers in the linear range from of 10-3 to 10-10 M. Therefore, the sensor is capable of measuring Pb2+ to trace Pb levels, with a performance comparable to that of standard methods, such as UV-vis spectrophotometry. Besides that, the Pb-ISE sensor also shows selectivity coefficient values quite good for several interfering ions, such as K+, Na+, NH4+, Mg2+, Cu2+ and Cd2+. The signal from the Pb-ISE sensor is quite stable, in the pH ranges from 3 to 8. Overall, this developed sensor has the potential to be deployed in field-testing.
Acknowledgments
The authors thank to the University of Mercu Buana, specifically, the Master of the Mechanical Engineering Study Program who has supported the completion of this research, providing laboratory facilities for synthesis, fabrication and testing. The authors would also like to thank LIPI PHYSICS that helped with the MB28 copolymer characterization process by FTIR. A final thank you note to MIMOS Berhad Malaysia, for the collaborative research work in contributing with several chemicals from Malaysia Plan development expenditure (DE) project for the completion of this research work.

