


 Inglês (pdf)
 Artigo em XML
 Referências do artigo
 Enviar este artigo por email
 Citado por SciELO
  Similares em
SciELO
Similares em
SciELO 
 Permalink
Introduction
Olive oil production is concentrated mainly in Mediterranean countries (Spain, Italy, Greece, Turkey, Syria, Tunisia and Morocco), accounting for 94% of world production, which, in 2001, has reached 2.5 million tons 1. Liquid effluents from olive oil mills have a brown to reddish-brown cloudy appearance 2. They have a high saline load and are highly acidic, rich in organic matter and low biodegradable polyphenols 3.
OMW containing phenolic compounds (with low biodegradation and high toxicity) is a serious environmental problem, and it should not be released without treatment into the eco-system. Though it is not listed as a carcinogenic substance, phenol has been categorized as a hazardous material, since it can make severe damage, when it gets in to the body of living beings. 4. Literature reveals that the overexposure to phenol affects the central nervous system. In such situations, the results are catastrophic, as the damage is irreversible. Phenol is an organic compound commonly used in various industrial applications 5, e.g. construction of automobiles and appliances. It is a raw material present in manufacturing cleaning agents and in agricultural industry pesticides. Therefore, it is possible to discharge untreated water containing phenol in to the natural water bodies. In order to minimize the hazard caused by phenol, the US Environmental Protection Agency (EPA) has limited its permissible discharge level to less than 1 mg/L 6. Extremely high organic loaded aqueous waste is seasonally generated from the olive oil extraction process, the so called OMW. In Morocco, it is disposed directly into the sewerage system, whereas the solid waste (olive husk) is dumped untreated into lands nearby the olive mills. This increases the risk of contaminating soil, surface water resources and groundwater aquifers. In industry, the wastewater is generated in large volumes. Hence, a convenient method to handle such load is required.
The Mediterranean countries are confronted with the problem of OMW removal from the produced olive oil. Indeed, these effluents have a high polluting power, due to their high load in chemical and biological oxygen demand (COD and BOD) (7), and to its phenolic and aromatic compounds that are very difficult to biodegrade 8. Numerous studies on the treatment of these effluents have been carried out, which propose economical methods, such as biological 9 and chemical depuration by oxidation 10 or by coagulation floculation 11. The coagulant, in this case, is generated by the dissolution of a sacrificial anode 12. EC uses an electrical current to produce several metal ions in a solution. In fact, EC systems can be effective in removing suspended solids and dissolving metals, tannin, dyes and margins. The contaminants in wastewaters are maintained in the solution by electrical charges. When metal ions are neutralized with ions of the opposite electric charge, by an EC system, they become unstable, and, then, precipitate in a form that is usually very stable. EC requires simple equipment, easy operation, a brief reactive retention period, decreased or negligible equipment for adding chemicals, and a low amount of sludge 13. The electrochemical process is ideal to take advantage of the combined effect caused by the polyvalent cations production from the corrodible anodes oxidation (such as Fe and Al). The solution homogenization is carried out using a magnetic stirrer that creates gas bubbles which carry the pollutant to the top of the solution, where it can be more easily concentrated, collected and removed. The metallic ions can react with the OH- ions produced at the cathode during the H2 gas evolution, to yield insoluble hydroxides that will remove pollutants out of the solution, and also contribute to coagulation, by neutralizing any negatively charged colloidal particles that have been reported to be more compact than the sludge obtained by chemical methods 14.
Of all the processes tested for the valorization and treatment of vegetation waters, very few are applied on an industrial scale. Conventional aerobic or anaerobic biologic treatments are very difficult, because of the high levels of vegetation water in suspended matter, and organic substances, such as polyphenols, sugars, organic acids and tannins. With regard to heat-treatments, only a few processes using olive cake as an energy source have been applied on an industrial scale. On the other hand, several known physicochemical technologies have already proved their worth in this field, such as the adsorption technique that consists in adsorbing phenolic compounds which are responsible for the vegetation water harmful effect. The treatment processes for phenolic wastewater can be classified into two basic categories: destructive processes, such as oxidation with ozone, hydrogen peroxide or manganese oxides; and recuperative processes, such as adsorption onto porous solids 15, membrane separation 16 and solvent extraction 17. Adsorption has been recognized as an effective process in most of the industrial water and wastewater treatments 18. At very low concentrations (less than 0.1 mol/L), phenol can be dissolved by biological treatment. At higher concentrations (more than 20 mg/L), solvent extraction is used. At intermediate concentrations 19, which is the case of the present study, adsorption can be effective for OMW treatment. In fact, adsorption using activated C has been shown to be one of the most efficient procedures for the phenolic compounds removal from wastewater. However, activated C is an expensive material that requires complex activation processes. Therefore, it is mandatory, from an economic point of view, to treat it for reuse 20. Taking these criteria into consideration, the search for a low cost and easily available adsorbent has led many investigators to seek for more economical and efficient techniques, using natural and vegetal substances. However, by far, the most frequently used technology is adsorption by a solid phase. Several different adsorbent solids, such as activated C 21, silica 22, glass powder 23, polymeric resins 24, fly ash 25, peat 26, kaolinite 27 and zeolites 28, have all been proposed for phenolic pollutants removal from wastewater. The challenge is to find alternative adsorbents of comparable efficiency and practically costless.
The use of agricultural OS for biosorption seems to be very promising, since it is very abundant 29. The possibility of using such materials as adsorbents, without any complex and expensive pre-treatments, makes them an interesting alternative to the use of activated C. Further advantages are their readily availableness and lack of regeneration need. The aim of the present research was OMW removal in an aqueous solution by adsorption onto a treated OS adsorbent. The influence of several parameters, such as OMW temperature, initial concentration and contact time, on the adsorption process, was also investigated. The biosorption kinetic data of the biomass were tested by pseudo-first and second-order kinetic models. The equilibrium data were analyzed using Langmuir’s and Freundlich’s isotherm models. The biosorption thermodynamics was also evaluated. The goal of this work was to reduce, by EC, the organic matter, COD and coloring of an effluent with a high charge of polluting matter (OMW), coming from the region of Essaouira, 30, in order to respect the Moroccan norms in force 31.
Materials and methods
Biosorbent (OS) preparation
The starting material (OS) was provided by a factory from Essaouira (Morocco). OS are an abundant agricultural by-product and very adequate to obtain a good adsorbent.
Activated C chemically prepared from OS proved to be an excellent decontaminant of polluted water with heavy metals and organic compounds such as phenols. For the adsorbent preparation, OMW was washed several times with distilled water, at 105 ºC, overnight, crushed and sieved. The olive pomace was washed with tap water several times, to remove dust and impurities, and dried in the oven at 100 ºC, for 24 h 32, in a mortar. Then, 100 g of it were put in a flask filled with 500 mL of the activating agent (H3PO4 and KOH - potassium hydroxide). The mixture was stirred for 1 h, at 60 ºC, using a balloon heater. Afterwards, the pomace was filtered and put in the oven, until complete evaporation 33. The dry matter was recovered and crushed, and the product was filtered by sieves with different pore diameters (0.5, 1 and 1.5 mm).
FTIR (Fourier transform infrared spectroscopy) was applied to determine the surface functional groups, using a FTIR spectrophotometer (SCO TECH SP-FTIR-1). The FTIR spectral analyses were recorded from 4000 to 400 cm-1, and the samples were prepared as KBr pellets, under high pressure.
Industrial waste, adsorbate preparation and OWM separation
OMW was taken from a traditional oil mill, which does not use chemical additives, in Essaouira, during the 2016-2017 olive-growing season, and its vegetation waters were diluted 10 times, decanted, filtrated and delipidated by a separating funnel. Table 1 illustrates an example of OMW composition in Essaouira.
Table 1 Crude OMW composition and characteristics.
| Parameters | Values |
|---|---|
| pH | 4.9 |
| Polyphenol [g/L] | 12 |
| Dry matter [g/L] | 13.0 |
| Moisture [%] | 98 |
| Volatile matter [g/L] | 9.5 |
| Ash [g/L] | 3.5 |
| Chemical oxygen demand [g/L] | 13 |
| Fatty acid [g/L] | 0.9 |
| Total nitrogen [%] | 0.05 |
| Conductivity [ms/cm] | 5.4 |
| Total sugars [mg/L] | 14 |
After the samples storage, OMW oily and aqueous phases can be separated either naturally or by centrifugation 34. Both the methods have the same performance, but the process slowness and the area requirement may limit the first one. The centrifugation allowed us to accelerate the separation of oil and water phases. This separation technique was performed by filling 4 test tubes with 0.250 dm3 of an OMW solution, which were then centrifuged at a speed of 4000 rpm, for 30 min. The oil, with a lower density than water, can be found above it in the centrifuge. In order to finally isolate the oil, it was collected using an automatic adjustable pipette. Oil percentage was determined using the weight loss method 35.
EC principle
EC is an electrochemical technique derived from chemical coagulation standard, but in which 36 no chemical additions are performed, since the metal ions come directly from the anodes dissolution (Fig. 1).
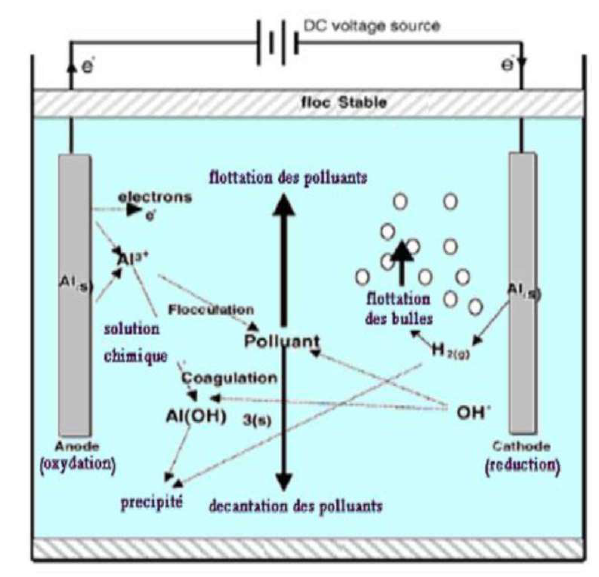
Therefore, this allows to reduce the costs with the used chemical products, and decreases the final amount of sludge that must be disposed of. In addition, metal hydroxides that are formed during EC potentiate depollution by adsorption. When a current (or potential) is imposed between two electrodes (Fe or Al) immersed in an electrolyte, in a reactor, to generate ions (Fe2, Fe3 and Al3), in situ, a coagulant is likely to be produced. Fig. 1 shows the principle of the process with Al electrodes. The used anodes and cathodes can have different configurations. They can be in the form of plates, bowls or spheres, connected to a fluidized bed, wire, rod or tube. These electrodes can be made of various metals that are chosen in such a way as to optimize the treatment process. The two metals commonly used are Fe and Al.
Mechanisms
The anodes electrolytic dissolution of cationic species Al products, such as Al3+ and Al(OH)+2, occurs at a relatively low pH value. When the pH increases, these species are transformed into Al(OH)3. These compounds can be condensed to form dimers, such as Al2(O)(OH)4 and Al2(OH)2 4+, or even other more complex polymeric compounds.
During hydroxides production, when Al has the anode, the main reaction that occurs is the metal oxidation: Al → Al3+ + 3e−(1).
There may be other secondary reactions during oxidation processes, such as O formation by water electrolysis. This half reaction modulates with the pH (acid or basic) of aqueous environments. In an acidic medium: 2 H2O → 4 H+ + O2 + 4e− (2). In a basic medium: 4 OH− → O2 + 2 H2O + 4e− (3).
When Al has the cathode, the main reaction leads to water reduction. In an acidic medium: 3 H2O + 3e− → 3/2 H2 (g) + 3 OH- (1. In a solution: Al3+ (aq) + 3 H2O → Al(OH)3 (s) + 3 H+ (aq) (2). In a basic medium: 2 H2O + 2 e − → 2 OH − + H2 (3). Metal cations form complexes with the hydroxide ion, and most of the species depend on the medium pH.
In Al case, there are a multitude of anionic and cationic complexes: mono complexes, such as A(OH)2−, Al(OH)2− and A(OH)4−; poly complexes, such as Al2OH2 4+, Al2OH5+, Al6OH 15 3+ and Al13OH 34 5+ ; and amorphous and very little soluble species, such as (OH)3 and Al2O3.
By the in situ production of Al3+ ions in an aqueous medium, there is the formation of Al hydroxides (coagulation agents) that, in function of the solution pH, may take the following forms (only Al hydroxides mononuclear cells are presented): Al3+ + H2O → (OH)2+ + H+ (4); (OH)2+ + H2O → Al(OH)2+ + H+ (5); (OH)2+ + H2O → Al(OH)3 + H+(6); and (OH)3 + H2O → Al(OH)4− + H+ (7).
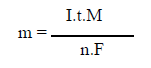
Faraday’s law
If we consider that the only chemical reactions taking place in the EC reactor are, at the anode, the metal oxidation, and, at the cathode, the water reduction, it is possible to determine the mass of the dissolved metal and H, using Faraday’s law:
 ***
***
where m is the mass of the dissolved metal or formed gas, I is the intensity of the imposed current, t is the electrolysis time, M is the molecular weight of the element under consideration, F is the Faraday’s constant (96500 C/mol-1) and n is the number of electrons involved in the reaction considered.
EC experimental techniques
The electrochemical process relies on the electrolysis phenomenon that is a reaction based on the passage of the current between two electrodes, which causes the oxidation and automatic degradation of the organic matter present in the effluent 37.
This is achieved by a cell comprising an anode and a cathode immersed in the reaction medium (Fig. 2).
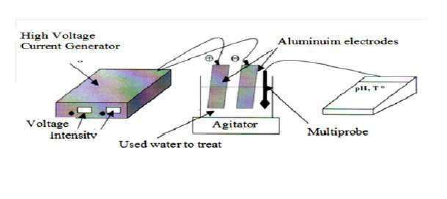
As soon as the electrodes are switched on, the reaction is spontaneously activated, and a foam is formed on the solution surface and on the inner wall of the reactor. This foam is due to the oxidation of fat and organic compounds.
The assembly consists of a pyrex electrolytic cell, with a volume of 400 mL, equipped with two identical Al electrodes, with the dimensions of 83 mm × 51 mm × 1 mm. This corresponds to an electrode lateral surface area (S) of 42.33 cm². The inter- electrode distance of 4 cm is a characteristic measure in EC systems 38. The solution homogenization is carried out using a magnetic stirrer (the presence of bubbles allows for the effluent homogenization, and forces the medium recirculation.) The advantage of agitation by bubbles has been put forward, and their negative influence on the conductivity has been minimized by working in a laminar regime inside the electrochemical reactor, which allows the micro bubbles to be rapidly released at the stirred reactor.
The voltage at the electrodes terminals was fixed by a DC generator (DC, AL 823 ELC, maximum current of 10 A and maximum potential of 15 V), and a potential from 3 to 12 V was maintained constant during the experiment, at ambient temperature 39. The electrodes were pretreated with an HCl solution, to clean them and avoid their passivation. The batch experimental apparatus is shown in Fig. 2. The cathode and anode consist of many pieces of cast Fe spaced 2 cm apart, and dipped in the wastewater. EC in aqueous solutions was carried out in the beakers (0.250 dm3) with magnetic stirrers, to agitate them. The total area of the electrode plates was 0.0106 m2. The stirrer was employed in the electrochemical cell, to maintain an unchanged composition, and to avoid the aggregation of flocks in the solution 40.
Analytical technique
Continuous analyses or measurements: pH measurements of the samples taken
The measurements were made by a Consort model C931 pH meter equipped with a glass electrode containing a 4 M KCl solution. The pH meter was calibrated with pH 4, 7, 10 and 12 phosphate (H3PO4) standards. The accuracy of the standards given by the supplier was ± 0.02 units, at 20 ºC. The pH of each sample taken from the agitated reactor was immediately registered, to monitor the production of the OH- ions responsible for the rise in the pH effluent 41.
Tensions
The voltages were directly detected on the display of the stabilized power supply. For each current and sampling time, there is a voltage value that appears directly on the power supply screen. This makes it possible to follow the voltage evolution, and indirectly informs on the current passage between the electrodes.
Analyzes requiring sampling: conductivity measurements
Conductivity measurements were carried out using a Consort model 832 conductivity meter equipped with a Pt plate measuring cell. This cell has an automatic compensation of the conductivity value, as a function of the solution temperature (reference temperature: 25 ºC). The measurement range was from 0.01 to 200 mS/cm-1. In 0.1, 0.01 and 0.001 M KCl solutions, the conductivity was 12.88, 1.413 and 0.148 mS/cm-1, respectively.
Effluent color reduction by its absorbance in visible UV
The absorbance of the different samples was measured on the clear supernatant. Previously, the clear supernatant of the raw untreated crude effluent underwent several measurements of absorption wavelengths, in order to determine the most suitable for this characterization, and also to accomplish the colors reduction during the treatment 42. These measurements were carried out in visible UV spectrometry, after baseline intake with deionized water. Subsequently, each sample was passed with the same absorbance as that of the crude effluent. Therefore, the values read at the predetermined wavelength represent the sample absorbance. The visible UV spectrometer was controlled by a computer.
COD measurements
COD is the measure of the O2 dioxygen amount from the potassium dichromate (K2Cr2O7) reduction necessary to oxidize biodegradable or non-biodegradable organic materials. COD can be considered as a measure of the total organic matter contained in margins 43. The O consumption by the sample under analysis causes a change in the color of which absorbance is proportional to the reduced K2Cr2O7 amount that it is measured as an O equivalent.
Adsorption isotherms and pH point zero charge
The batch adsorption experiments were conducted in a set of 250 mL Erlenmeyer flasks containing adsorbent and 200 mL of an OMW solution, at various initial concentrations. The flasks were agitated in an isothermal water-bath shaker, at 200 rpm. The solution temperature was varied in the range from 20 to 50 ºC, and all the mixtures were studied until the equilibrium was reached. The samples filtration was carried out using disposable syringe filters with a pore size of 0.45 µm, which exhibited no interaction with the phenol during the sampling, and separated the solid phase from the liquid phase, generating equilibrated phenol concentrations in the solution. The solutions pH was adjusted with 1 M HCl or 1 M NaOH solutions 44. The point of zero charge (pHpzc) of activated C is one of the adsorbent characteristics. It was estimated by introducing 0.5 g of ALS into 50 mL of distilled water, at initial pH values of 3, 4, 6, 8 and 10, which were adjusted by adding 0.1 M NaOH or 0.1 M HCl. The mixture was stirred for 24 h, at room temperature, and the final pH was measured. The intersection between the first bisectrix and the curve representing the variation of the final with the initial pH gave a pHpzc equal to 1, for AOS (H3PO4).
Adsorption kinetics
Adsorption kinetics was carried out to establish the influence of several parameters (contact time, temperature and initial concentration of phenol) using a mechanic stirrer. In the biosorption experiments, the OS were tested for the phenol adsorption from aqueous solutions, at room temperature, using the batch reactor technique. Adsorption kinetic experiments were performed by putting in contact 3 L of an OMW solution, at different initial concentrations ranging from 20 to100 mg/L, with 3 g of OS, in a reactor, at room temperature. At fixed time intervals, the samples were taken from the solution and separated from the sorbent through a filter, and the residual concentration was determined. Experiments were repeated for different initial p enol concentrations (20 to 100 mg/L), agitation speed (from 50 to 250 rpm) and temperature (from 20 to 47 ºC). pH was measured using a combination associated with a pH-meter calibrated beforehand. The respective effects of agitation speed, pH, T, adsorbent mass (m0) and initial dye concentration (C0) have been investigated.
Adsorption experiments
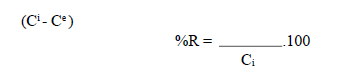
The process of the OMW adsorption onto the OS necessarily generates a distribution of the adsorbate between the solid and liquid phases, as a function of the operating conditions. The adsorption experiments were carried out by introducing a quantity of the adsorbent in 1 L of an OMW solution, at the initial dilution, and at the desired temperature maintained with a thermos-stated bath. The mixture was put on an electromagnetic stirrer, at a constant speed (400 rpm). The controlled parameters were: temperature and adsorbent diameter. Samples of the solution were withdrawn at various time intervals, and centrifuged at 2000 rpm, for 1 min. OMW removal percentage (%R) was calculated as follows:
 ***
***
where Ci (mg/L) is the initial OMW concentration and Ce (mg/L) is the dye concentration at equilibrium.
The adsorption capacity was given by the following formula:
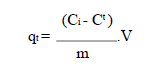 ***
***
where qt (mg/g) is the amount adsorbed at time t (min), Ct (mg/L) is the dye concentration at time t, V (L) is the dye solution volume and m (g) is the adsorbent mass. The analysis of the instantaneous concentration (Ct) in the filtered liquid phase was carried out using a double beam UV-visible absorption spectrophotometer. The linearity of Beer-Lambert law was checked for concentrations ranging from 1 to 48 mg/L, with a correlation coefficient (R²) of 0.9997.
Isotherm modeling
The study of the adsorption isotherm is necessary to understand the adsorption mechanism 45. In order to investigate the temperature effect on the OS adsorbent equilibrium capacity, for the phenol removal from aqueous solutions, the equilibrium of adsorption data was analyzed using Langmuir’s and Freundlich’s isotherms models. Linear regression is frequently used to determine the best-fitting isotherm, and the applicability of isotherm equations is compared by judging the correlation coefficients 46.
Langmuir’s isotherm
Langmuir’s theory assumes 47 that: the adsorbent has a limited adsorption capacity (qmax); the adsorbate forms a monolayer on the adsorbent surface; the active sites are identical: and there is no interaction between the adsorbed molecules. Langmuir’s isotherm is given by the following equation:
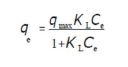 ***
***
where Ce (mg/L) is the adsorbate concentration at equilibrium in the solution, qe (mg/g) is the adsorbed amount at equilibrium, qmax (mg/g) is the maximum adsorption capacity, and KL (L/mg) is the Langmuir’s constant. The linear form of the Langmuir’s isotherm model can be written as follows:
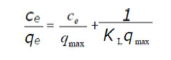 ***
***
The essential characteristic of the Langmuir’s isotherm can be expressed by the dimensionless constant called equilibrium parameter (RL), defined by 48:
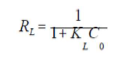 ***
***
where KL is the Langmuir’s constant and C0 is the initial dye concentration. The separation factor RL value indicates the type of isotherm: irreversible (RL = 0), favorable (0< RL<1), linear (RL = 1) and unfavorable (RL>1).
Freundlich’s isotherm
Freundlich model 49 is applied in the case of multilayer adsorption, and describes the equilibrium on heterogeneous surfaces. However, this model assumes the existence of interactions between adsorbed molecules. Freundlich’s isotherm model can be defined by the following equation:
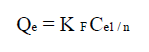 ***
***
where qe (mg/g) is the adsorbed amount at equilibrium, Ce (mg/L) is the adsorbate concentration in the solution at equilibrium, KF is the Freundlich’s constant and n is the adsorption intensity. Its linear form is given by the following equation:
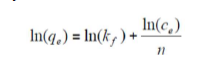 ***
***
where ln is the natural logarithm.
Kinetic models
There are several kinetic equations available for analyzing experimental sorption. The adsorption equilibrium studies are important for determining the adsorption effectiveness. However, it is also necessary to identify the adsorption mechanism types in a given system.
The most known experimental models used in the present work were pseudo-first and second-orders, intra-particle diffusion, Elovich’s and Bangham’s models, to predict OMW adsorption kinetics onto OS or AOS. The kinetic data were analyzed based on the regression coefficient (R2) and on the dye amount adsorbed per unit weight of the adsorbent.
Pseudo-first-order model
The adsorption kinetic data were described by the Lagergren’s pseudo-first-order model, which is the earliest known equation describing the adsorption rate based on the solid capacity. The Lagergren’s equation 50 is generally expressed as follows:
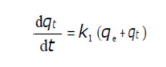 ***
***
where qe and qt are the adsorption capacity (mg/g), at equilibrium, and at t, respectively, and k1 is the pseudo-first order adsorption rate constant (min-1). After integrating and applying the initial conditions (at t = 0, qt = 0 and t = te, qt = qe), the equation takes the form 51:
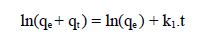 ***
***
Pseudo-second-order model
Adsorption data were also analyzed according to the pseudo-second-order kinetic model, which is generally given as in:
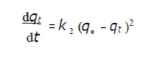 ***
***
where qe and qt are the amounts of adsorbed AO7/carboxylic acid (mg/g) at equilibrium, and at time t (min), respectively, and k2 (g/mg/min) is the corresponding rate constants of pseudo-second order adsorption. After integrating and applying the conditions (at t = 0, qt = 0, t = te and qt = qe), the equation takes the linear form:
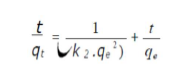 ***
***
The second-order rate constants were used to calculate the initial sorption rate, h (mg/g/min), given by:
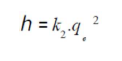 ***
***
Thermodynamic study
To investigate the adsorption processes, thermodynamic parameters, such as ΔS° (entropy change), ΔH° (enthalpy change) and ΔG° (Gibb’s free energy), were calculated for the OMW/AOS system, at different temperatures. The evaluation of these parameters was estimated using the following relations (18-19) from the plot of ln (KL) versus 1/T.
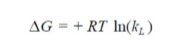 ***
***
 ***
***
where T (K) is the absolute temperature, R (8.314 J/mol/K) is the universal gas constant and KL (L/mg) is the Langmuir’s constant. The second order rate constant (k2) is expressed as a function of temperature by the Arrhenius equation. The linear form between k2 and T can be applied to calculate the adsorption activation energy, Ea, (kJ/mol) using:
 ***
***
where k0 is the temperature-independent factor (g/mg/min) and R is the gas constant (8.314 kJ/mol). The physisorption processes usually have activation energies in the range from of 0 to 50 kJ/mol, while higher activation energies range from 50 to 800 kJ/mol, suggesting chemisorption.
Results and discussion
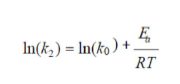
Biosorbent FTIR analysis
OS FTIR spectra, in the range from 400 to 4000 cm-1, were taken to obtain information on the nature of the functional groups at the biosorbent surface. The spectra presented in Fig. 3 show broad, strong and superimposed bands from 3600 to 3200 cm-1, which may be due to the overlapping of O-H and N-H stretching vibrations.
The bands at 2921 and 2850 cm-1 are due to the CH2 and -CH3 aliphatic acids asymmetric and symmetric stretching vibrations, respectively.
The peaks observed from 1730 to 1710 cm-1 are indicative of C-O bonds stretching vibrations, due to non-ionic carboxyl groups (-COOH and -COOCH3), and may be assigned to the H bonding between carboxylic acids or their esters.
The stretching vibration band at 1650 cm-1 is due to the asymmetric stretching of the carboxylic COO- double bond of deprotonated carboxylate functional groups. The vibration band at 1432 cm-1 is of the phenolic -OH stretching. The peaks observed at 1370 cm-1 reflect pectin stretching vibrations of symmetrical or asymmetrical ionic carboxylic groups (-COOH).
The band at 1035 cm-1 could be due to the -C-O-C and -OH polysaccharides vibration. The peaks at 1254.6 and 1033.5 cm-1 are due to the aldehydes and lactones or C-O carboxyl groups stretching vibration.
The band at 1324 cm-1 is assigned to C-N groups on the biomass surface. The absorption peaks from 1155 to 1070 cm-1 are indicative of P = O and P-OH stretching vibrations.
The S-O stretching was identified at 952 cm-1.
Peaks in the region of wavenumbers lower than 800 cm-1 could be attributed to N-containing bio-ligands.
These results indicate that OS contain a variety of functional groups, such as carboxyl, hydroxyl, sulfate, phosphate, aldehydes and other charged groups, suggesting that this biomaterial can be considered as an alternative for OMW removal.
Physicochemical parameters variation monitoring
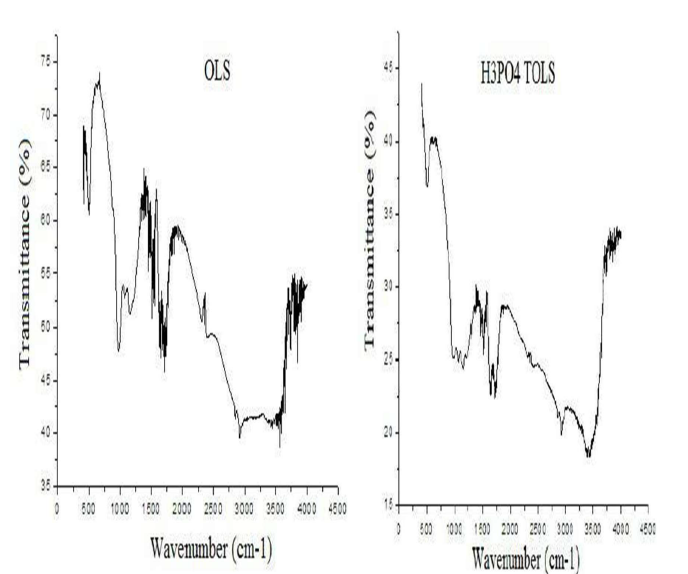
Current density effect
The current density (I) is judged as an essential parameter in EC, specifically for COD reduction and discoloration kinetics (Fig. 4).
When I is enhanced, the processing time decreases, due to the high electrodes dissolution. This results in more destabilization of the pollutant particles. Moreover, the hydrogen bubbles production rate increases, and their size decreases when I is enhanced. All of these effects are beneficial for an efficient pollutant removal by flotation. I is a critical parameter in EC, since it is the only one that can be directly controlled. The I effect on the dyes removal was evaluated by repeating the same test with equivalent operating conditions, but with different intensities. The applied intensity varied from 0.5 to 3 A, depending on the capacities of the generator used. The UV absorbance variation at max = 395 nm strongly depends on the current imposed during the electrolysis. It is clear that the margins discoloration rejection reached 86% for electrolysis currents, or I ≥ 3 A. This has been confirmed by several authors who, when treating an azo dye using Fe electrodes, have explained that high electrical currents would generate a significant level of Fe ions, which confirmed that, at high I values, Al anodic dissolution increases, leading to a higher rate of necessary precipitates for the pollutants elimination. It should be noted that the gas bubbles size at the cathode decreases (while their number increases) with higher intensities of the applied current, which can promote a high pollutant removal performance by H flotation.
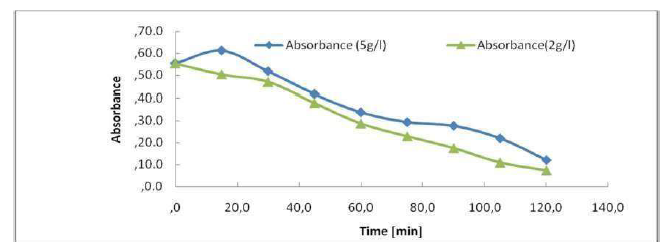
Salt concentration effect
The increase in conductivity by the addition of sodium chloride (NaCl) is known to reduce the voltage (U) between the electrodes, at a constant I, due to the decrease in the resistance of the polluted water (Fig. 5). The energy consumption, which is proportional to the applied U between electrodes (E = U.I.t/V), should therefore decrease. The choice of NaCl results from the fact that Cl ions significantly reduce the undesirable effects of other anions. Thus, the salt influence was studied by varying its concentration (g/L) in one L of solutions. The other parameters were kept constant. A current density of 7038.68 A/m2 (3 A) was used. The Cl- ion is considered the most reactive element, since it is readily oxidized in aqueous solutions. The obtained results are expressed as the percentage of the coloration removal and the NaCl concentration, in Al electrodes case.
The calculation of the color reduction effectiveness was, in the cases of 5 g/L and 2 g/L of NaCl, E = 78% and E = 86%, respectively, indicating that an additional salt intake had a negative effect on the process efficiency. Overall, EC treatment gave excellent results with the use of Al electrodes, with a very low salinity, in the range from 0.5 to 2 g/L NaCl. Similar effects of improved stain and organic matter removal from margins, by increasing the conductivity, have been reported by various authors who claim that high conductivity is favorable for a good performance of the EC process.
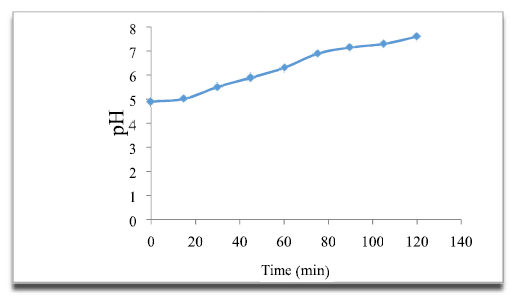
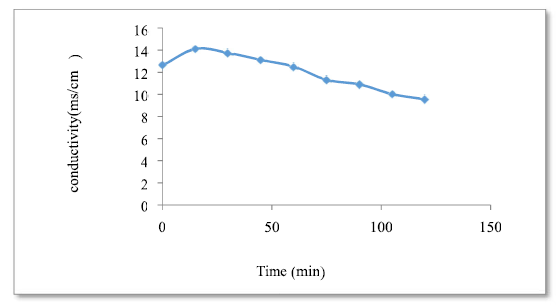
pH and conductivity variation
According to the curve (Fig. 6), it is observed that the pH increased with the variation in time, at neutral values. This increase in pH is due to OH-hydroxide ions formation at the cathode. Due to its amphoteric nature, OWM acts as a base in media with slightly acid margins, and is partially dissolved when it releases OH. Free OH- ions result in increased pH values.
According to the found curve (Fig. 7), the conductivity was reduced as a function of the adsorption process time, which means that the OWM concentration has decreased (this may be due to the lower H+ proton concentration pH), as a result of its neutralization by more free and mobile OH- ions, and the substitution of Cl- ions by heavier ions.
Change in COD
The evolution of the residual COD concentration, as a function of time (Fig. 8), is useful for determining optimum conditions for the harmful organic matter (COD and polyphenols) degradation, and the marginal effluents discoloration. The residual COD evolution over time shows an abatement of more than 40% of the organic matter, after only 60 min of treatment, followed by a quasi-stable COD concentration of 13.9, obtained after 120 min of treatment. So, the optimum time is 120 min. According to the curve found, COD decreases as a function of the adsorption time, which means that the freshly formed amorphous flocs are beneficial for a rapid soluble organic compounds adsorption and colloid particles trapping. COD elimination is accompanied by sludge (MES- Microbial electrochemical system) and foam formation. Effectiveness calculations: E = (DCOt = 0-DCOf) / DCOt = 0 = (32.7-13.9) / 32.7 E = 0.57 = 57%.

Treatment effect on coloration reduction and consumed energy [kWh/dm3)
The absorbance allows to indirectly estimate the effluents coloration (Fig. 9). We have scanned the raw samples to find the most representative wavelength of the effluent absorbance. This absorbance wavelength corresponds to a fairly flat maximum of 395 nm. The figure shows the evolution of the effluent absorbency during the treatment. We see a decrease in the absorbance during treatment, of up to 0.1198 nm, after 2 h. In Fig. 9, it can be seen that the UV absorbance at 395 nm has dropped sharply after 120 min of electrolysis, and that the discoloration elimination percentages reached 78%. The COD reduction was 57%. Hence, the feasibility of our method of treatment for the non-biodegradable molecules elimination almost reached complete effluents discoloration. The calculation of the color reduction effectiveness is: E (t = 0) -A (tf)) / A (t = 0) = (0.5546-0.1198) / 0.5546 = 0.78. E Al = 78%.
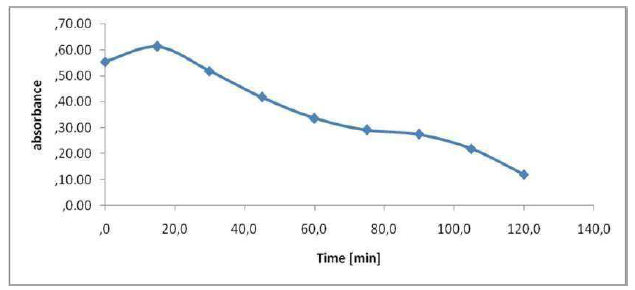
We have estimated the quantity of energy consumed to treat an effluent of vegetation waters with a volume of 1 dm3. The theoretical load to be circulated is obtained using Faraday's Law. The obtained results show that the quantity of consumed electrical energy was of the order of 0.9 kWh/dm3, to obtain a final COD of 13.9 mg O2/L, knowing that our margins had a COD of the order of 32.7 mg O2/L, with a rate of 57% of COD abatement. The energy estimate allows us to predict an energy consumption of 1 kWh/dm3, by working at low I values. Increasing the effluent conductivity and reducing the inter-electrode distance could further reduce energy consumption.
Temperature and contact time effects on OMW adsorption
Despite the fact that the OS temperature effect on adsorption was not experimentally investigated in this work, it is worth to mention that several researchers showed that OMW adsorption decreases with temperatures higher than 20 ºC, as depicted in Fig. 10. The rise in temperature reduces the attractive forces between OMW and the adsorbent, and increases its thermal energy. This indicates the adsorption exothermic nature. It also leads to the conclusion that physical adsorption has a more important role than chemisorption in OMW attachment onto the adsorbent. To determine the temperature effect on OMW adsorption, experiments were conducted at 20, 30 and 47 ºC, by adding 3 g/L of OS to the OMW solution, at a fixed concentration (80 ppm), and constant pH. The equilibrium uptake percentage of OMW ions using H3PO4 treated OS (AOS) was affected by temperature. So, the increase in temperature decreases the physical forces responsible for sorption. Fig. 7 shows that OMW adsorption by OS decreased with an increase in temperature. This behavior indicates that OMW adsorption is an exothermic process. Furthermore, the decreased uptake of the OMW removal at higher temperatures (above 20 ºC) may be attributed to the destruction of some polymeric active sites on the adsorbent surface, due to bond rupture, as well as to the surfaces deformation at higher temperatures. Consequently, the study found that the OMW adsorption process was affected by temperature, and that the optimum value was 20 ºC.
The experimental results showed that OMW adsorbed quantity was higher when time increased (Fig. 10).
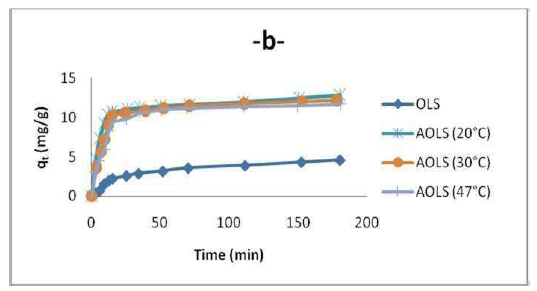
The obtained results shown in Fig. 10 indicate that, initially, OMW adsorbed uptake rate per gram of OS increased gradually with longer periods of time, and, thereafter, reached equilibrium at 90 min. This is because OMW molecules diffusion, from the solution to the adsorbent surface, is accelerated by the decrease in its temperature. The increase in the sorbent uptake capacity with OMW longer adsorption periods of time may be due to higher sorbate amounts. However, the experimental data were measured at 180 min, to be sure that full equilibrium was attained. The OMW adsorbed amount at equilibrium on OS increased with its longer initial immersion time in the solution, to a plateau value that corresponds to the maximum adsorption capacity. This can be explained by the fact that the adsorbent had a limited number of active sites that would have become saturated above a certain concentration.
Kinetic models
The most known experimental models obtained in the present work were tested with pseudo-first and second models, to predict OMW adsorption kinetics on OS. The adsorption data were analyzed according to the pseudo first-order kinetic model, considering various effects (agitation, concentration and temperature). The obtained plots of ln(qe - qt) versus t are presented in Table 2. We can see that the first order kinetic model was not tested for all effects, because the curves were not perfectly linear with lower R2 values. Therefore, it is imperative to check the second order model. Table 2 shows the applicability of the pseudo-second-order equation, with a R2 greater than 0.99. The rate constant (k2) and equilibrium adsorption capacity (qe) values were calculated from the intercept and slope of the plots of t/qt versus t, respectively. Table 2 presents all the results concerning the characteristics of the pseudo-first and second-order kinetic models. This indicates that the OMW-OS adsorption system obeyed the pseudo-second-order kinetic model, for the entire sorption period. The initial sorption h value (mg/g/min) decreased with the raise in temperature from 20 to 50 ºC. It was observed that k2 increased with a rise in temperature from 20 to 50 ºC, respectively. However, the results obtained using the pseudo-second-order model are not enough to predict the diffusion mechanism.
Table 2 Comparison of the pseudo-first and second-order constants values for OMW adsorption onto OS and H3PO4 treated OS (AOS).
| Adsorbent | Pseudo-first order | Pseudo-second order | |||||
|---|---|---|---|---|---|---|---|
| T | R 12 | k1 | qe | R22 | K2 | qe | |
| (°C) | (L/min) | (mg/g) | (l/min) | (mg/g) | |||
| AOS | 20 | 0.89 | 0,0146 | 7,59 | 0.999 | 0,0039 | 11,53 |
| (H3PO4) | 30 | 0.84 | 0,0167 | 4,35 | 0.999 | 0,0202 | 12,46 |
| 47 | 0.69 | 0,0169 | 4,16 | 0.999 | 0,0285 | 12,03 | |
| OS (raw) | 20 | 0.83 | 0,0116 | 3,18 | 0.998 | 0,0083 | 4,99 |
Isotherm modeling of the sorption equilibrium depending on temperature
For analyzing experimental data, and for describing the biosorption equilibrium, Langmuir’s and Freundlich’s isotherms were simulated. Table 3 shows the fitting parameters of the measured isotherm data for OMW adsorption onto OS, in the linear forms of isotherms. It can be observed that the OMW adsorption onto OS fits Langmuir’s isotherm well, with higher R2 values than those of other isotherms, reflecting that the adsorption sites on the OS surface were evenly distributed. According to Langmuir’s adsorption isotherm, the qmax values for OMW were 189.83, 175.44 and 172.41 mg/g-1, at 20, 30 and 47 ºC, respectively. OMW maximum adsorption on OS decreased with higher temperatures, exhibiting the exothermic nature of the adsorption process. OMW adsorbed amount (qe) increased when its concentration grew, and, then, became constant, which reflects the adsorption active sites saturation at various temperatures. Also, given that the increase in temperature led to a decrease in the adsorbed amount, it can be said that low temperatures are crucial, since the maximum monolayer sorption capacity (qm), at 20 ºC, was 189.83 mg/g, obtained from Langmuir’s model. The separation factor (RL) values for OMW sorption on the OS adsorbent are shown in Table 3. All RL values fall between zero and one. These results support the previous observation that the Langmuir’s isotherm was favorable for OMW sorption at all studied temperatures. Freundlich´s constant can be determined from the plot of ln(qe) versus ln(Ce). Thus, we can generate the KF value from the intercept, and 1/n from the slope and coefficients of determination, which are shown in Table 3.
Freundlich’s model data are not comparable to those obtained from the Langmuir’s model linear form. This result indicates that the experimental data did not fit Freundlich’s model well (low R2). The nf values are higher than unity, indicating that OMW adsorption onto OLS was a favorable physical process (Table 3).
Table 3 Isotherms constants for OMW adsorption onto H3PO4 treated OS (AOS).
| Models | T: 20 ºC | 30 ºC | 47 ºC |
|---|---|---|---|
| Langmuir’s | |||
| qm (mg/g) | 189.83 | 175.44 | 172.41 |
| K1 (l/mg) R2 | 0.0345 0.995 | 0.0270 0.991 | 0.0259 0.999 |
| Freundlich’s | |||
| Kf | 51.96 | 31.28 | 26.31 |
| nf R2 | 4.41 0.987 | 3.48 0.986 | 3.12 0.991 |
| RL | 0.1096 | 0.2957 | 0.3314 |
| 1/nmg/L | 0.155 | 0.15 | 0.179 |
Adsorption thermodynamic parameters
Thermodynamics experiments were carried out at a temperature range from 20 to 47 ºC. Fig. 11 shows the plot of ln Kl versus 1/T, and the values of estimated thermodynamic parameters are given in Table 4.
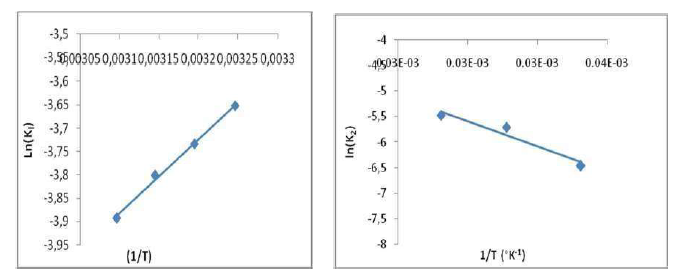
As it can be observed, ΔH° (-13.111178 kJ/mol) negative value shows that the adsorption was an exothermic process. ΔS° (-72.9146114kJ/mol) negative value can be used to describe the adsorption process randomness at the solid/solution interface. G° increased from 6.10 to 10.05 kJ/mol, with a rise in temperature from 20 to 47 ºC, indicating a decrease in the adsorption feasibility at higher temperatures, and its spontaneous nature. Concerning Ea evaluation, Fig. 11 shows a linear relationship between K0 and the inverse temperature logarithms, and gives Ea and k0 estimated values of -20.5879582 kJ/mol and 10,327 g/mg/min, respectively. Ea negative values indicate the presence of an energy barrier in the adsorption process, and confirm the nature of OMW physisorption processes onto the OS surface.
Conclusion
The aim of our study was to reduce the negative impact of untreated vegetation waters on nature, by the margins pretreatment with EC. In a first step, we have determined the margins pH, before and after their EC. The medium acidity has been neutralized, which allows to affirm that the used technique constitutes a good pretreatment choice.
The margins COD, in the order of 13.9 g O2/L, confirms the EC efficacy as the main treatment process, since that our margins had a COD in the order of 32.7 g O2/L. We have carried out this treatment by varying the margins concentrations up to a 20 times dilution, which was taken as optimum. The experience showed that the best results were obtained for I of 416 A/m2, under the operating conditions, for a time of 120 min, and for an amount of 2 g/L of added salt.
The liquid discharges thus obtained can be directly released into rivers, or mixed with urban wastewater, to be treated by sewage plants, without the risk of disrupting their functioning.
The batch adsorption experiments proved that H3PO4 treated OS (AOS) is a promising, abundant, low cost and high capacity adsorbent for OMW removal. OWM high adsorption capacity onto H3PO4 treated OS was observed. The adsorption capacity was exponentially increased with initial OMW concentration. The equilibrium time was independent of the concentration, and the amount adsorbed at equilibrium increased with higher concentrations. This is because the OMW molecules diffusion from the solution to the adsorbent surface was accelerated by the increase in the dye concentrations.
This work confirms that OS can be used for OMW removal from aqueous solutions. The adsorbed amount decreased with higher temperatures.
Equilibrium studies revealed that the Langmuir’s adsorption isotherm was the most favorable for OMW adsorption onto OS. The Langmuir’s isotherm represents the equilibrium system better than the Freundlich’s isotherm.
The results indicate that the adsorption isotherm data were well fitted with the Langmuir’s isotherm model, by comparing the linear R² values. The adsorption process was considered to be of medium speed, at a low agitation speed. Equilibrium was almost achieved after 7 h of OMW contact with treated OS. Kinetic modeling indicates that total OMW adsorption was best represented by the pseudo-second order rate, and it was spontaneous and exothermic. This study shows that OS is an effective adsorbent for OMW removal from aqueous solutions.

