SciELO - Scientific Electronic Library Online

 
vol.40 número6Evaluation of Souss-Massa Daraa Region Irrigation Groundwater Hydrogeochemical Characteristics and Quality: A Multivariate Statistical ApproachDevelopment of Ni-Al2SiO5/Ni-SiO2 Coating Doped with Benzotriazole: Corrosion, Structural Evolution and Thermal Degradation Study índice de autoresíndice de assuntosPesquisa de artigos
Home Pagelista alfabética de periódicos  

Serviços Personalizados

Journal

Artigo

Indicadores

Links relacionados

  • Não possue artigos similaresSimilares em SciELO

Compartilhar


Portugaliae Electrochimica Acta

versão impressa ISSN 0872-1904

Port. Electrochim. Acta vol.40 no.6 Coimbra dez. 2022  Epub 31-Dez-2022

https://doi.org/10.4152/pea.2022400604 

Research Article

Influencing Parameters on the Electrodeposition of Silver from the Effluents of Mirror Industry

F. Bounechache1 

N. Ghemmit-Doulache1  2 

D. Bourouis1 

C. Ait Ramdane-Terbouche3 

1Laboratory of Polymers Treatment and Forming, Faculty of Technology, University M’Hamed Bougara, Boumerdes, 35000, Algeria

2Department of Chemistry, F S, University M’Hamed Bougara, Boumerdes, 35000, Algeria

3Scientific and Technical Research Center in Physical and Chemical Analysis (CRAPC), Algiers, 16004, Algeria


Abstract

Silver (Ag) is considered as an ancient and durable precious metal that is used in different ways, due to its specific properties. The diversity of its uses has been meeting a growing worldwide demand that exceeds the Ag amount extracted from earth crust (primary resource), where a large part of this metal has been exploited. Due to its toxicity, environmental pollution resulting from industrial plants, and high economic value, Ag recovery from industrial plants (second resource) has become increasingly important for scientists. In this study, we focused on Ag recovery from the effluents of mirror industry. This was done by Ag electrodeposition on an aluminum (Al) electrode surface. This work aimed to study the effect of current intensity (CI), electrolysis time (ET), voltage (V) and temperature (T) parameters on Ag electrodeposition, in order to optimize them. According to the obtained results, the optimal parameters were a CI of 4 A, during an ET of 30 min, at 12.5 V, with a maximum T of 30 ºC. Scanning electron microscope (SEM) analyses showed a multilayer rich Ag deposit on the Al surface, followed by a cluster of flowers of different sizes originated from reduced Ag0.

Keywords: silver; environmental pollution; Ag recovery; electrolysis; electrodeposition

Introduction

Ag is a precious metal that exists in the earth crust in very limited concentrations 1,2. Its unique and good electronic, optical, catalytic, electrical and antimicrobial properties explain its diverse uses in different sectors, such as electronics, biology, medicine, jewelry and photography 3-6. This versatility is responsible for the regular increase in Ag overall demand, which is about 2% per year 7. Ag is widely used in mirror industry, as a support layer responsible for reflection.

The mirror surface manufacturing process consists of the following main steps: surface preparation, mirror layer and protective coating application. In the first stage, the surface was washed. Then, it was polished, as the dust was cleaned with mechanical brushes, using a cerium dioxide suspension. After that, the sensitization process was carried out by applying a tin chloride (Cl-) solution. Then, the glass was rinsed and introduced into the activation surface phase, by pulverizing a palladium chloride (PdCl2) solution onto it. The rinsing was done again. The prepared glass was sent to the silvering chamber, where the Ag solution and the reducing agent were applied.

After the surface was prepared for painting, rinsing and drying, the mirror was covered with a protective paint layer, and dried at high temperatures, forming aqueous Ag waste 8,9.

This wastewater contains a high quantity of metal ions that exceed the limits of industrial effluent discharges established by agencies and applicable regulations. Therefore, it must be treated before discharge, due to its toxicity 10-13.

Ag industrial waste is a major source of environmental pollution 14. For example, in Algeria, according to the Official Journal of the Algerian Republic, N° 36, which was published on 21 June 2009, any harmful substances content of non-domestic waste water may not, under any circumstances, exceed the maximum limit value for Ag ions (0.1 mg/L), when they are discharged into a public sewage system or a wastewater treatment plant 15. Also, for economic and environmental reasons, Ag recovery has been of high importance. Conventional techniques for the removal of heavy metals and their solutions from wastewater, such as chemical precipitation, ions exchange, flocculation, cementation, coagulation, etc., have been used 16-25. Additionally, a series of promising studies and research has been carried out to recover Ag from these wastes, such as electrochemical processes 26-29. These methods have both advantages and limitations. Electrolysis is one of the most common available techniques, efficient for recovering Ag from industrial effluents. In this work, we have chosen this method due to its advantages of being clean, not requiring a lot of chemicals, and producing deposits with great purity 30.

The purpose of this work was to study the effect of CI, ET, V and T on Ag electrodeposition from the mirror effluents of the company Transformation et Vent Tous Types de Verre, Sarl El Hadj Com, El-Eulma, Sétif-Algeria. After that, parameters optimization was carried out. We have also recorded the solution pH and electrical conductivity (EC), before and after electrolysis. EC decreased with lower Ag ions amounts in the electrolysis.

Experimentals

Sampling

The samples of mirrors effluents containing Ag were taken after the silvering operation from the abovementioned company.

Technological chain of glass mirror manufacturing

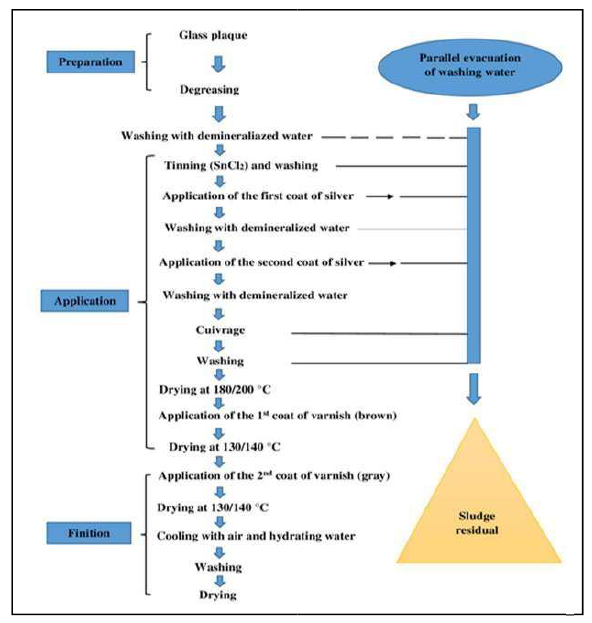
To achieve the finished product, the mirror elements were subjected to a threephase treatment (preparation, application and finishing), as shown in Fig. 1. The successive coatings and abundant washes from the 2nd phase resulted in waste that was deposited, at the end of the operation, in the form of sludge. The Ag concentration in the sludge was 65%.

Figure 1 Technological diagram of the silvering process 31

Chemical composition of the samples

The chemical composition of these samples was determined by the X-ray fluorescence technique (XRF), which is shown in Table 1. In this study, we used a solution that was removed from the effluent of the mirror company (February 2018).

Table 1 Chemical compositions of Ag effluent solutions. 

Compound Na Al Si S Cl K Ca Fe Zn Ag
Mass concentration (%) 58.2 0.0971 1.34 0.0412 1.24 1.27 0.52 0.25 0.107 36.9

Method

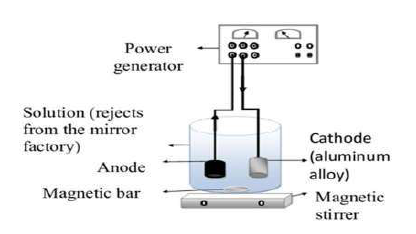
In this work, Ag has been recovered by the electrolysis technique. A two- electrodes cell containing an Al alloy, with a cross-section of 1 cm2, and graphite were used as working and auxiliary (WE and AE) electrodes, respectively. The Al alloy composition used for the electrodeposition studies was (Wt%): 80% Al, 17.9% Zn, 2% Mg and others in trace 32. Before each manipulation, the WE was mechanically pretreated by polishing it with an abrasive paper (grade 1200), chemically pretreated by ejecting it into the acetone for 10 min, rinsed with distilled water, and dried in the open air. Once the pre-treatment was completed, the WE and AE were immersed in a cell containing electrolytes (Ag wastewater) that have been connected to a power source (direct current), as indicated in Fig. 2.

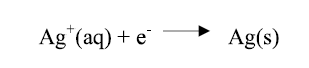
Under the polarization effect, the electrons (ions contained in the solution) moved in opposite directions, so that the positively charged ions (Ag ions) moved towards the negatively charged cathode, being then neutralized by the electrons supplied by the cathode, and deposited as an Ag film, as shown in the equation below.

***

Figure 2 Electrolysis principle. 

Once the electrolysis was completed, the WE was recovered, dried in the open air, and then weighed again after the electrolysis, to determine the deposited Ag mass, by the differential weight technique 33.

Results and discussion

Continuous current effect on Ag electrodeposition

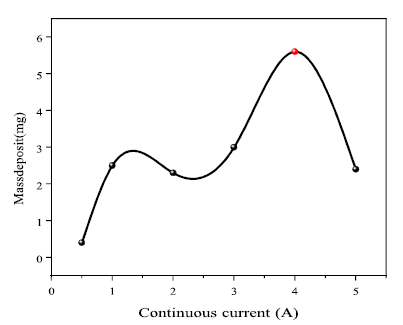
As shown in Fig. 3, the current was 4 A, the highest deposition value. Ag electrodeposition was favored by lower currents from 0 to 4 A. The electrodeposition amount increased with higher CI. In contrast, if the CI was over 4 A, the electrodeposition amount decreased. That may be explained by the high mobility of Ag ions in the solution, which prevented them from being deposited on the cathode surface.

Figure 3 Variation in Ag mass electrodeposition, as a function of the applied current. 

Electrolysis time effect on Ag electrodeposition

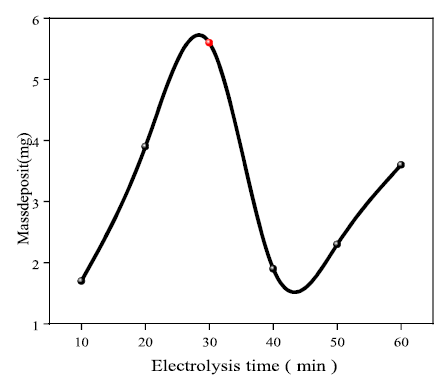
Based on the recorded results, it is seen that the ET had a positive influence on Ag electrodeposition, up to an optimal time of around 30 min. Over this period, the deposit mass rapidly dropped to 1.9 mg, and then marginally increased. This is probably due to the lower Ag mass transfer rate, for a long electrolysis period (see Fig. 4).

Figure 4 Variation in Ag mass electrodeposition, as a function of ET. 

Voltage effect on Ag electrodeposition

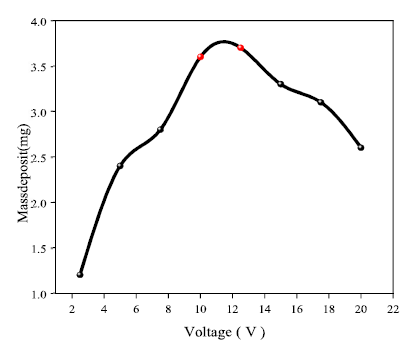
The results of the recovered deposit mass are shown in Fig. 5, with the increase in the voltage applied to Al, with a mass of about 3.7 mg, for an optimal value of 12.5 V. Indeed, the voltage forced the ions to migrate and deposit on the cathode. Values above 12.5 V decreased the Ag ions migration rate to the cathode and, consequently, the mass deposition was lower.

Figure 5 Variation in recovered AG mass electrodeposition, as a function of the applied voltage. 

Temperature (T) effect on Ag electrodeposition

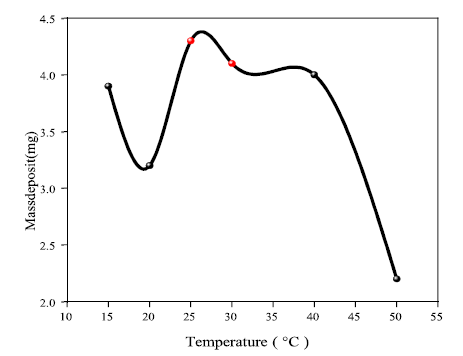
T is an important factor for electrochemical reactions in electrolysis 34. Indeed, it accelerates the electrodeposition rate, as shown in Fig. 6. This is valid for T around 30 ºC. On the other hand, T values higher than 30º have a negative effect on Ag electrolytic deposition. This could be due to the high thermal agitation that prevents Ag ions from being deposited on the Al electrode surface.

Figure 6 T effect on electrodeposited Ag mass. 

EC variation

According to the histograms a, b, c and d, in Fig. 7, the solution EC decreased after electrolysis.

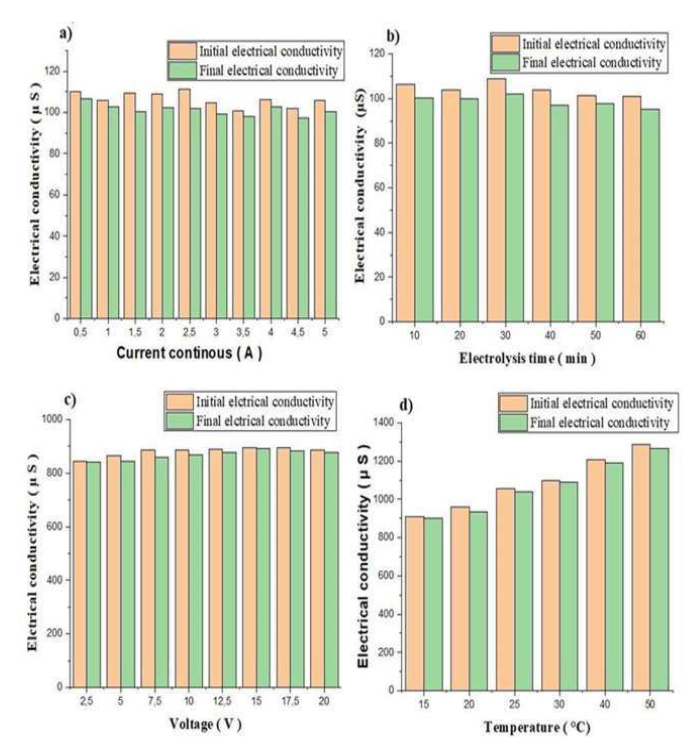
Figure 7 Variation in EC, before and after electrolysis, as a function of: a) continuous current, b) ET, c) V and d) T. 

This can be explained by the decrease in Ag ions in the solution, which, after having been neutralized, were deposited as an Ag film. It was also seen that, with higher T, the ions rate in the solution increased, and, consequently, the EC was greater.

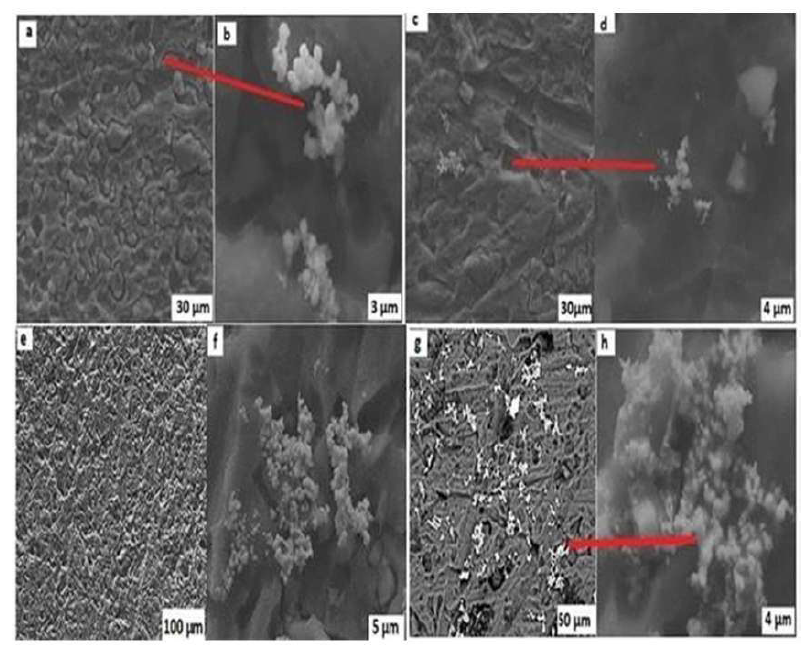
Ag deposits morphological analysis

Fig. 8 shows the SEM image of Ag deposition obtained at different optimized electrolysis parameters. A dense deposit was formed on the Al electrode surface, in different amounts. To study the Ag aggregates morphology under different optimized parameters, we initially have set 4 A as the optimal DC current (a and b), at 12.5 V (c and d), the ET of 30 min (e and f), and T of 30 ºC (g and h). SEM images in Fig. 8 show that two essential steps, the Ag cations enrichment and reduction on the Al electrode surface, as highlighted by Zhao et al. 35, governed the Ag deposition mechanism. Similarly, the growth of Ag aggregates resulted in several layers where the surface film has gaps of different sizes (a, c, e and g), on which other Ag cations were enriched after their reduction at the electrode interface, to form flowers terminating in nodules (b, d, f, h). These results confirm those obtained by T. Nawaz et al. 36. According to these authors, the flowers collected on the gaps are due to Ag0 particles.

Figure 8 SEM image of Ag deposition after electrolysis. as a function of: (a, b) 4 A DC and 30, 3µm magnifications; (c, d) 12.5 V and 30,4 µm magnification; (e, f) 30 min ET and 100,5 µm magnification; and (g, h) 30 ºC and 50,4 µm magnification. 

Conclusions

The aim of this work was to study the effect of CI, ET, V and T parameters on Ag electrodeposition over an Al electrode surface. Ag cations electrodeposition seems to be an efficient technique for recovering this metal from a residual sludge of the mirror industry. Optimization of these parameters resulted in a multilayer rich Ag deposit on the Al surface, followed by a cluster of flowers with different sizes relative to the reduced Ag0 observed by SEM.

Acknowledgments

We would like to thank M’hamed Bougara of the University of Boumerdes for funding this study.

References

1. Purcell TW, Peters JJ. Sources of silver in the environment. Environ Toxicol Chem. 1998;17(4):539-46. DOI: https://doi.org/10.1002/etc.5620170404 [ Links ]

2. Nakiboglu N, Toscali D, Nisli G. A novel silver recovery method from waste photographic films with NaOH stripping. Turk J Chem. 2003;27(1):127-33. [ Links ]

3. Song S, Ji C, Wang M, et al. Adsorption of silver (I) from aqueous solution by chelating resins with 3-aminopyridine and hydrophilic spacer arms: equilibrium, kinetic, thermodynamic, and mechanism studies. J Chem Eng Data. 2011; 56(4):1001-8. DOI: https://doi.org/10.1021/je101002b [ Links ]

4. Alexander JW. History of the medical use of silver. Surg Infect. 2009;10(3):289-92. DOI: https://doi.org/10.1089/sur.2008.9941 [ Links ]

5. Birloaga I, Veglio F. Overview on hydrometallurgical procedures for silver recovery from various wastes. J Environ Chem Eng. 2018;6(2):2932-8. DOI: https://doi.org/10.1016/j.jece.2018.04.040 [ Links ]

6. Sabir S. Silver Recovery from Assorted Spent Sources: Toxicology of Silver Ions: World Scientific; 2018. [ Links ]

7. Yazici EY, Deveci H, Yazici R. Recovery of silver from X-ray film processing effluents using trimercapto-s-triazine (TMT). Sep Sci Technol. 2011;46(14):2231-8. DOI: https://doi.org/10.1080/01496395.2011.595032 [ Links ]

8. Kozodaev A, Korpusova Y, Shulzhenko A. Waste water depuration of the manufacture of mirrored surfaces for energy saving. IOP Conf Ser. Mater Sci Eng. 2019. DOI: https://doi.org/10.1088/1757-899X/492/1/012020 [ Links ]

9. Folens K, Huysman S, Van Hulle S, et al. Chemical and economic optimization of the coagulation-flocculation process for silver removal and recovery from industrial wastewater. Sep Purif Technol. 2017;179:145-51. DOI: https://doi.org/10.1016/j.seppur.2017.02.013 [ Links ]

10. Ratte HT. Bioaccumulation and toxicity of silver compounds: a review. Environ Toxicol Chem. 1999; 18(1):89-108. DOI: https://doi.org/10.1002/etc.5620180112 [ Links ]

11. Ho N, Babel S, Sombatmankhong K. Bio-electrochemical system for recovery of silver coupled with power generation and wastewater treatment from silver (I) diammine complex. J Water Process Eng. 2018;23:186-94. DOI: https://doi.org/10.1016/j.jwpe.2018.04.001 [ Links ]

12. Howe PD, Dobson S. Silver and silver compounds environmental aspects. Concise International Chemical Assessment Document 44.2002. DOI: https://apps.who.int/iris/handle/10665/42553 [ Links ]

13. Azmi A, Jai J, Zamanhuri N, et al. IOP Conf Ser. Mater Sci Eng. 2018;358(1):012024. DOI: https://doi.org/10.1088/1757-899X/358/1/012024 [ Links ]

14. Fabrega J, Luoma SN, Tyler CR, et al. Silver nanoparticles: behaviour and effects in the aquatic environment. Environ Int. 2011;37(2):517-31. DOI: https://doi.org/10.1016/j.envint.2010.10.012 [ Links ]

15. Ouyahia A. Décrit exécutif n° 09-290 du 17 Joumada Ethania 1430 correspondant au 11 juin 2009 fixant les modalités d'octroi de l'autorisation de déversement des eaux usées autres que domestiques dans un réseau public d'assainissement ou dans une station d'épuration. Journal Officiel de la République Algérienne. Algiers. 2009:17-8. [ Links ]

16. Henze M, Harremoes P, la Cour Jansen J, et al. Wastewater treatment: biological and chemical processes. 2002; 3rd Edition, Springer, Berlin. [ Links ]

17. Liu H, Ramnarayanan R, Logan BE. Production of electricity during wastewater treatment using a single chamber microbial fuel cell. Environ Sci Technol. 2004;38(7):2281-5. DOI: https://doi.org/10.1021/es034923g [ Links ]

18. Tchobanoglous G, Burton FL, Stensel H. Wastewater Engineering: Treatment and Reuse, 4th Edition, McGraw-Hill, New York, 1138-1162. [ Links ]

19. Patterson JW. Industrial Wastewater Treatment Technology. 1985. 2nd Edition, Butterworth Publishers, Stoneham. [ Links ]

20. Gogate PR, Pandit AB. A review of imperative technologies for wastewater treatment I: oxidation technologies at ambient conditions. Adv Environ Res. 2004;8(3-4):501-51. DOI: https://doi.org/10.1016/S1093-0191(03)00032-7 [ Links ]

21. Barakat M. New trends in removing heavy metals from industrial wastewater. Arab J Chem. 2011;4(4):361-77. DOI: https://doi.org/10.1016/j.arabjc.2010.07.019 [ Links ]

22. Ramalho R. Introduction to wastewater treatment processes. Elsevier; 2012. [ Links ]

23. Dakiky M, Khamis M, Manassra A, et al. Selective adsorption of chromium (VI) in industrial wastewater using low-cost abundantly available adsorbents. Adv Environ Res. 2002;6(4):533-40. DOI: https://doi.org/10.1016/S10930191(01)00079-X [ Links ]

24. Hammer MJ. Water and wastewater technology. 1986. [ Links ]

25. Eaton LSC, Greenberg AE, Franson MAH. Standard methods for the examination of water and wastewater. APHA. 2005;49(1015):0. [ Links ]

26. Nawaz T, Sengupta S, Yang C-L. Silver recovery as Ag0 nanoparticles from ion-exchange regenerant solution using electrolysis. J Environ Sci. 2019;78:161-73. DOI: https://doi.org/10.1016/j.jes.2018.09.012 [ Links ]

27. Tran T-K, Chiu K-F, Lin C-Y, et al. Electrochemical treatment of wastewater: Selectivity of the heavy metals removal process. Int J Hydrogen Energy. 2017;42(45):27741-8. DOI: https://doi.org/10.1016/j.ijhydene.2017.05.156 [ Links ]

28. Chen G. Electrochemical technologies in wastewater treatment. Sep Purif Technol. 2004;38(1):11-41. DOI: https://doi.org/10.1016/j.seppur.2003.10.006 [ Links ]

29. Lee J-K, Lee J-S, Ahn Y-S, et al. Effect of current density on morphology of silver thin film recovered from crystalline silicon solar cell by electrochemical process. Thin Solid Films. 2018;663:143-7. DOI: https://doi.org/10.1016/j.tsf.2018.08.021 30. [ Links ]

30. Aktas S. Silver recovery from silver-rich photographic processing solutions by copper. Can Metall Q. 2008;47(1):37-44. DOI: https://doi.org/10.1179/cmq.2008.47.1.37 [ Links ]

31. Sitko J. Analysis of selected technologies of precious metal recovery processes. MAPE. 2019;2. DOI: https://doi.org/10.2478/mape-2019-0007 [ Links ]

32. Ghemmit-Doulache N, Amghar N, Bendifallah L. Retracted: Effect of olive leaf extract on calcaeous deposit from sea. JFAS. 2018;10(5S). DOI: http://dx.doi.org/10.4314/jfas.v10i5s.1 [ Links ]

33. Ghemmit-Doulache N, Morsli N, Slimani N. Recuperation of silver fromwastewater of miroiterie of thenia (Algeria). IPCBEE. 2015;83(23):134. DOI: https://doi.org/10.7763/IPCBEE. 2015. V83. 23 [ Links ]

34. Ghemmit-Doulache N, Remli A. Electrochemical behaviour of the titanium- seawater interface at the Cape-Djinet, Boumerdes thermal station: influence of the potential, temperature, and brine. Desalin Water Treat. 2016;57(22):10443-50. DOI: https://doi.org/10.1080/19443994.2015.1036777 [ Links ]

35. Zhao N, Shi F, Wang Z, et al. Combining layer-by-layer assembly with electrodeposition of silver aggregates for fabricating superhydrophobic surfaces. Langmuir. 2005;21(10):4713-6. DOI: https://doi.org/10.1021/la0469194 [ Links ]

36. Nawaz T, Sengupta S. Silver recovery from laundry washwater: the role of detergent chemistry. ACS Sustain Chem Eng. 2018;6(1):600-8. DOI: https://doi.org/10.1021/acssuschemeng.7b02933 [ Links ]

Received: September 18, 2021; Accepted: November 30, 2021

Corresponding author: n.ghemmit@univ-boumerdes.dz

F. Bounechache: collected the data; inserted data or analysis tools; performed the analysis; wrote the paper. N. Ghemmit-Doulache: conceived and designed the analysis; inserted data or analysis tools; performed the analysis; wrote the paper. D. Bourouis: wrote the paper. Ait Ramdane-Terbouche: made SEM observations and interpretation of their results.

Creative Commons License This is an open-access article distributed under the terms of the Creative Commons Attribution License