


 English (pdf)
 Article in xml format
 Article references
 Send this article by e-mail
 Cited by SciELO
  Similars in
SciELO
Similars in
SciELO 
 Permalink
Introduction
Creation of high-performance electrocatalysts for H2 production in water electrolysis is an important aspect of the transition to green H2 energy 1-5. Up to now, electrode materials of various chemical compositions and manufacturing methods have been proposed for the implementation of H2 synthesis cathodic reaction.
Among these materials, Ni-Cu alloys advantages include their availability and low cost (in comparison with noble metals), possibility of manufacture by various metallurgical and electrochemical methods, and high mechanical strength, corrosion resistance and electrocatalytic activity 6-9. Ni-Cu alloys stronger electrocatalytic activity, concerning HER, in comparison with individual metals, is explained by the synergistic interaction between the alloy components and the developed porous surface microstructure 6-8. It was reported 10 that Ni-Cu alloy electrochemical activity was significantly improved by selective dealloying through electrochemical anodic treatment in a 1 M Na2SO4 aqueous solution. In our opinion, the possibilities of increasing Ni-Cu alloy electrocatalyst activity, by its anodic treatment in aqueous solutions, are significantly limited, due to the probable passivation of the components and formation of oxide films on the metallic surface. In this regard, the transition to the use of non-aqueous systems seems to be extremely promising. In particular, a new class of ILs DESs may offer new opportunities.
DESs are ILs obtained by mixing some compounds in a eutectic ratio 11-13. The important advantages of DESs include their availability, low cost, environmental safety, incombustibility and relatively high electrical conductivity. One of the most common representatives of DESs is the so-called ethaline, which is a eutectic mixture of EG and ChCl (in the molar ratio of 66.67 and 33.33 mol%, respectively) 11. Since ethaline contains a high concentration of Cl- and does not contain water, anodic treatment of metals and alloys in this solvent is expected to prevent the formation of an oxide film on the Ni-Cu alloy surface. Many metals and alloys, including Ni and Cu, can be electropolished by their anodic treatment in ethaline 14-23,24-27. It is noteworthy that even Al, which is very prone to passivation, does not form any oxide passive film during anodic processing in ethaline 17.
Meanwhile, Ni-Cu alloy anodic electrochemical dissolution has not yet been described in the literature. Therefore, the subject of our study was to establish the features of Ni-Cu alloy anodic behavior in ethaline. Our hypothesis, underlying this work, was that Ni-Cu alloy anodic treatment, under certain conditions, could contribute to an increase in HER electrocatalytic activity.
Experimental
DES preparation
Metal samples characteristics
In this work, a DES based on ChCl (ethaline) was used for anodic surface treatment. To prepare ethaline, the calculated volume of EG (99.9%, AR, Belgium) and a weighed sample of solid ChCl (99%, Acros Organics) were mixed thoroughly by a magnetic stirrer, at 70 ºC, for about 1 h, to form a clear homogeneous liquid. To remove the impurity of absorbed hygroscopic water, the prepared ethaline was placed in a vacuum evaporator and kept at a temperature of 70 ºC, for 5 h. After preparation, ethaline was stored in a desiccator. Analysis by Fisher's method showed that the water content in ethaline did not exceed 1 wt.%. For electrochemical processing, a commercial Ni-Cu alloy was used, which, according to the manufacturer's certificate, contained 44.40(0.60% Ni. For comparison, some experiments were performed using Cu (99.9%) and Ni (99.9%) foil, with a thickness of 1 mm.
Anodic treatment in ethaline
Surface morphology characterization
Ni-Cu alloy anodic treatment in ethaline was made, and CVs were obtained in a 50 mL glass three-electrode cell, using a ZRA 3000 (Gamry, USA) potentiostat/galvanostat, with licensed software. An iR potentiostat compensator was used to automatically measure and compensate the ohmic potential drop.
The WE consisted of Ni-Cu alloy plates (thickness of 1 mm) and, in some cases, Cu or Ni foil plates. The samples surface was degreased with an aqueous suspension of MgO, etched in aqueous HCl (1:1 vol.), for 30 s, thoroughly washed with distilled water, and dried in a stream of air. The visible samples surface subjected to electrochemical treatment had 1 cm2.
The AE was a graphite rod with a highly developed surface. The Pt wire immersed in ethaline served as a quasi-reference electrode, against which the E values were measured and reported.
In all experiments, the electrochemical cell was thermo-stated at 25(0.01 ºC. The potential SR during anodic treatment in ethaline was varied from 10 to 500 mV/s-1.
The Ni-Cu alloy surface morphology, before and after anodic treatment in ethaline, was investigated by means of SEM (Zeiss EVO 40XVP equipped with an EDX analyzer Oxford INCA Energy 350).
Electrocatalytic characteristics determination
LSV method was used to evaluate the alloy electrocatalytic properties in HER. Samples freshly treated in ethaline (after thorough washed in water and dried) were used to obtain the appropriate polarization dependences. An aqueous solution of 1 M NaOH was used as electrolyte. HER voltammograms were registered in a 100 mL glass three-electrode cell, at the temperature of 25(0.01 ºC. A Pt grid served as EA. A saturated Ag-Cl electrode was RE. All E values in these experiments were recalculated vs the standard H electrode. HER voltammograms were recorded using the above potentiostat. The E SR was 50 mV/s-1. In a series of previous experiments, it was shown that the position of HER polarization curve in 1 M NaOH did not depend on the E SR, in the range from 5 to 200 mV/s-1.
Results and discussion
Ni-Cu alloys voltammetric behavior in ethaline
Surface morphology evolution
Typical voltammograms of Ni-Cu alloy anodic dissolution in ethaline, recorded on the same sample and in the same portion of the electrolyte, on successive E scans, are shown in Fig. 1. The E scan was started from OCP, in the positive E direction. As it can be seen, there were two overlapping current peaks on the voltammograms anodic scans (~ +0.25 +0.3 V and ~ +0.5 +0.7 V). After reversing the E scan direction towards more negative values, two current plateaus were observed on the voltammograms cathodic scan. It can be assumed that these cathodic current plateaus correspond to the electrochemical reduction of anodic dissolution products (metal ions), which were formed during the cathodic scan, and accumulated in the near-electrode layer and/or on the electrode surface.
It is noteworthy that anodic current peaks height was the highest on the first anodic E scan (on a "fresh" alloy sample). Then, the anodic peak currents fell in each successive E scan. This drop in current, with an increase in the number of scans, was especially pronounced for the second peak (at ~ + 0.5 + 0.7 V). Starting from about 6-7 scans, the voltammograms anodic regions ceased to change noticeably further and, apparently, a certain quasi-stationary state of the electrode surface was achieved. The presence of current oscillations on the obtained voltammograms should also be noted.
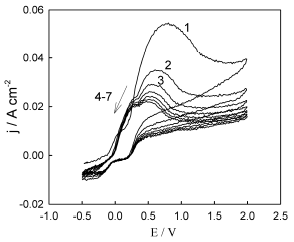
Figure 1 Typical voltammograms of the Ni-Cu electrode recorded in ethaline. Near the curves, the number of consecutive potential scans on the same sample is indicated, at a SR of 200 mV/s-1.
To identify the nature of two anodic current peaks, voltammograms of Cu, Ni, and Ni-Cu alloy anodic dissolution in ethaline were recorded (Fig. 2).
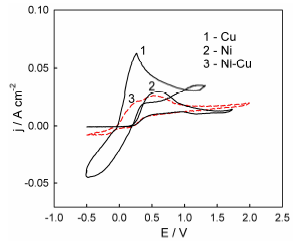
Figure 2 Voltammograms of Ni, Cu and Ni-Cu electrodes recorded in ethaline on the sixth potential scan, at a SR of 200 mV/s-1.
Let us note that the graph shows voltammograms registered on the sixth E scan, where a quasi-stationary state has been already achieved. It follows from the obtained curves that the current peaks on Cu and Ni anodic dissolution curves correspond to electrode E values of approx. +0.3 and +0.5 V, respectively. Thus, unlike traditional water systems, in DES environment, Cu is a more electronegative metal than Ni. This phenomenon was indicated earlier by Yang et al. 28 and Zhang et al. 29. It was determined that the redox potential of Cu(I)/Cu(0) in ethaline was about 200 mV more negative than that of Ni(II)/Ni(0) 29. Therefore, the polarization curve of Ni-Cu alloy anodic dissolution is a superposition of two dissolution current peaks. The position of these two overlapping peaks maximum, along the E axis, practically coincides with the position of the individual Cu and Ni dissolution peaks. In aqueous solutions, such a segregation of the Ni-Cu alloy peaks is usually not observed 30,31. The j values of the alloy anodic dissolution in ethaline are lower than those of the individual metals, just like in aqueous solutions 31.
It is well known that the experimental dependences of the peak height vs. the SR square root, in LSV, are straight lines emerging from the origin, for electrochemical processes in which the process rate is controlled by diffusion mass transfer 32. However, these dependences significantly deviated from linearity (Fig. 3), which indicates that delayed diffusion was not the cause of the current peaks in the recorded voltammograms.
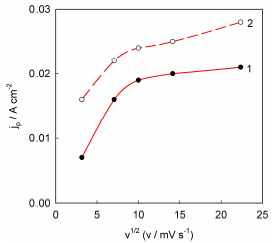
Figure 3 Dependences of peaks I on the SR square root for Ni-Cu alloy anodic dissolution in ethaline: 1 - first peak; 2-second peak.
Earlier, it was suggested that the reason for the sharp drop in the current during Cu anodic dissolution in ethaline was the enrichment of a near-electrode layer of the electrolyte with Cu(I) ions, and the formation of a layer of poorly soluble CuCl salt, near the electrode surface (it has a lower solubility in this solvent than that of Cu(II) salts 27,33,34. It is assumed 34 that the formation of a CuCl2 salt solid phase is also possible in the near-electrode zone. One way or another, a poorly soluble Cu salt was deposited on the electrode surface, partially blocking it and, thereby, leading to a decrease in the anodic dissolution current and, under certain conditions, causing the surface electro-polishing. Ni dissolution in ethaline was also accompanied by the formation of a poorly soluble chloride salt film on the electrode surface, which caused a sharp decrease in the voltammogram current, after the peak value was reached, and promoted the metal electro-polishing 25. It can be assumed that such a mechanism will also be valid for Ni-Cu alloy anodic dissolution.
To experimentally confirm this hypothesis, voltammograms of Ni, Cu, and Ni-Cu alloy anodic dissolution in ethaline, in which NiCl2 and CuCl2 were previously dissolved, were obtained (Fig. 4). If the assumptions made in the literature about the electrode surface passivation nature are correct, implying the formation of a poorly soluble salt film, the introduction of additional salts into the electrolyte will create conditions under which the near-electrode layer saturation will be achieved at lower rates of the metal dissolution electrochemical reaction. Therefore, the anodic dissolution peak current values should decrease in this case, which is observed both for individual metals and for Ni-Cu alloy anodic dissolution (Fig. 4). It is noteworthy that, in the Ni-Cu alloy case, the introduction of both Ni and Cu salts into the solution led to a decrease in the height of both current peaks recorded on the polarization curve.
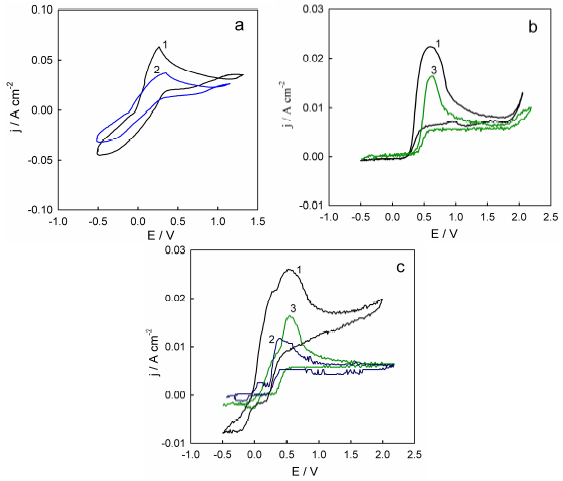
Figure 4 Voltammograms of (a) Cu, (b) Ni (c) and Ni-Cu alloy in the following solutions: 1-ethaline; 2-ethaline + 0.1 M CuCl2(2H2O; and 3-ethaline +NiCl2(6H2O. The SR was 200 mV/s-1.
In our opinion, the noted current oscillations on the current-voltage curves, which usually arise with the appearance of a new phase on the electrode, can serve as an indirect confirmation of the formation of low-soluble salts films on the Cu and Ni and their alloys surface anodically dissolved in ethaline, and a partial blocking of the electrode surface.
Chrono amperograms of Ni-Cu alloy potentiostatic anodic treatment in ethaline are shown in Fig. 5. It can be seen that the transition period, during which j changed noticeably, lasted for 500 to 1000 s, after the current was turned on. With further potentiostatic electrolysis, anodic j practically did not change, i.e., a steady state was reached. Such behavior can be explained by the fact that the production of poorly soluble salts gradually decelerated as the current decreased, due to the electrode surface partial blocking, whereas a reverse process, salts dissolution, accelerated, owing to diffusion and convection phenomena.
Eventually, the rates of these processes became equal, and the quasi-stationary state was established.
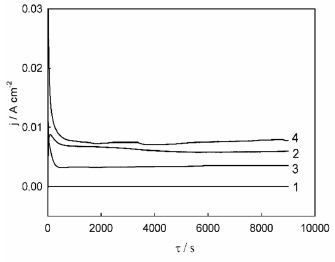
Figure 5 j transients during Ni-Cu alloys anodic treatment in ethaline, at the following electrode E values: 1 = 0.1 V, 2 = 0.5 V, 3 = 1.35 V and 4 = 1.7 V.
As noted above, the alloy surface anodic modification was carried out in order to affect the electrocatalytic properties. In a series of preliminary experiments, it has been shown that, if the duration of such treatment is less than 2 h, it is not possible to achieve reproducible and reliable effects, in terms of electrocatalytic performance. Therefore, all further experiments on the Ni-Cu alloy anodic modification in ethaline were carried out during 2.5 h.
The following E values for the anodic treatment were chosen (vs. the Ag RE): 0.1, 0.5, 1.35 and 1.7 V. Fig. 6 shows SEM images of the alloy surface, before and after its anodic treatment in ethaline, at the indicated E values.
It is seen that the alloy electrochemical anodic treatment in DES significantly changed its surface morphology. Untreated samples demonstrate an uneven surface, with some concaves and considerable streaks (Fig. 6 a). The anodic treatment at E = 0.1 V contributed to the formation of a great number of deeper concaves, probably due to the selective etching of some crystallites from the alloys surface (Fig. 6 b). Some streaks remain on the surface, and no visible signs of electropolishing are observed.
However, the surface morphology dramatically changed when the anodic processing E reached 0.5 V (Fig. 6 c). The streaks and concaves disappeared from the alloy surface.
At the same time, a great number of star-like crystallites, with sharply pointed shapes and thorns, were formed on a relatively uniform and smoothed surface. The irregular star-like crystallites are well viewed under higher magnification (Fig. 6 c'); their average size is about 15-25 (m. With a further increase in the electrochemical treatment anodic E (1.35 V), the amount of these crystallites diminished, and they formed peculiar chains on the surface (Fig. 6 d). Finally, when the E reached 1.7 V, only some star like crystallites are observed, and the surface became smooth and uniform (Fig. 6 e). Thus, an increase in the anodic treatment E in ethaline promoted Ni-Cu alloy electropolishing.
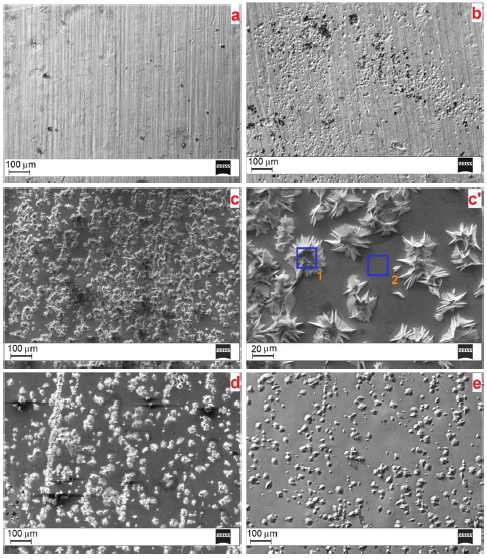
Figure 6 SEM images of the Ni-Cu alloys surface. (a) Without electrochemical treatment and (b)-(e) after anodic treatment in ethaline, at the following electrode E values: (b) 0.1 V, (c) and (c') 0.5 V, (d) 1.35 V and (e) 1.7 V.
It was interesting to follow the surface chemical composition after anodic processing at different E values. Table 1 summarizes the results of integral and local EDX analyses (Fig. 7) performed for the samples.
Table 1 Chemical composition of Ni-Cu alloys surface layers, according to EDX analysis data.
| Surface patch | Chemical compositions (wt.%) |
| Fig. 6 a | Ni 45.04 |
| Cu 54.96 | |
| Fig. 6 b | Ni 45.51 |
| Cu 54.49 | |
| Fig. 6 c | Ni 45.42 |
| Cu 54.58 | |
| Fig. 6 c', the area relating to the star-like crystallite | Ni 44.84 |
| Cu 55.16 | |
| Fig. 6 c', the area relating to the even surface (between star-like crystallites) | Ni 45.14 |
| Cu 54.86 | |
| Fig. 6 d | Ni 45.82 |
| Cu 54.18 | |
| Fig. 6 e | Ni 45.48 |
| Cu 54.52 |
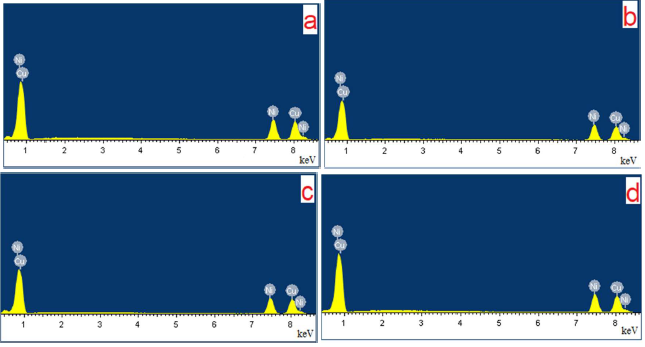
Figure 7 Typical EDX of Ni-Cu alloys surfaces shown in Fig. 6: (a) without electrochemical treatment; (b), (c) and (d) after anodic treatment in ethaline, at E = 0.5 V; (b) integral spectrum; (c) and (d) local spectra for the areas marked in Fig. 6 c' with blue squares and related to the star-like crystallite and even surface, respectively.
As follows from Table 1, Ni-Cu alloy surface anodic treatment in ethaline solvent practically did not lead to a change in the surface chemical composition, within the EDX analysis error, regardless of the applied E value.
Moreover, local microanalysis of surface regions corresponding to star-shaped crystallites and flat areas between them also shows almost the same Ni and Cu contents.
We have obtained such results in a number of parallel experiments on several dozen independent samples.
These data are undoubtedly unexpected, since, during Ni-Cu alloy surface anodic treatment in aqueous solutions, as a rule, selective dissolution (etching) of one of the components is observed 35.
Crundwell 36 gave a possible rational interpretation of this phenomenon, linking it with fundamental differences in Cu-Ni alloy anodic dissolution under conditions of non-stationary (linear SR) and stationary (long-term anodic treatment at a constant electrode E) electrolysis.
Indeed, with a relatively fast SR, each alloy component dissolves independently to a large extent, obeying the kinetic laws of the individual component, which leads to the appearance of separated anodic peaks in the voltammogram, and a to change in the surface layer composition that, however, is difficult to detect by the EDX method.
When electrolysis is carried out for a long time, under stationary conditions, according to the study 36 (which was confirmed by the chronoamperometric measurements data (Fig. 5)), the partial dissolution currents ratio of both Ni-Cu components should be close to the metallic molar ratio in the alloy. Hence, it follows that, with prolonged stationary anodic electrolysis, the surface chemical composition does not change, which was observed in the experiment (Table 1).
Effect of Ni-Cu alloy anodic treatment with ethaline on the electrocatalytic activity towards HER
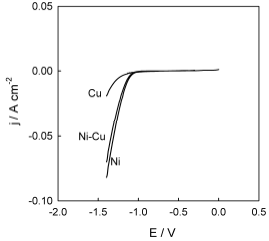
In order to establish the nature of the effect of Ni-Cu alloy anodic treatment in DES on the electrocatalytic properties towards HER, it seemed expedient to clarify the kinetics of this reaction on an untreated surface. The corresponding polarization curves are shown in Fig. 8. As expected, H2 has evolved, on Ni in an aqueous alkaline solution, with a significantly lower polarization than that on Cu. HER on the Ni-Cu alloy occurred at intermediate E values between those characteristic of pure Cu and Ni.
Evolution of Ni-Cu alloy surface morphology caused by anodic treatment in ethaline was accompanied by changes in electrocatalytic activity towards HER (Fig. 9).
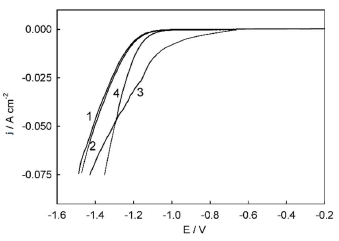
Figure 9 HER polarization curves on Ni-Cu alloys in 1 M NaOH without electrochemical treatment, and after anodic treatment in ethaline at the following electrode E values: (1) 0.1 V; (2) 0.5 V; (3) 1.35 V; and (4) 1.7 V.
Anodic treatment at E values of 0.1 and 0.5 V had little effect on HER overvoltage, and practically did not shift the corresponding polarization curve (the one registered after anodic treatment in ethaline, at 0.1 V, actually coincided with that for the untreated sample). At the same time, after Ni-Cu alloy anodic treatment in ethaline, at E values of 1.35 and 1.7 V, a significant decrease in HER polarization was observed. For example, at the cathodic j of 10 mA/cm-2, the decrease in polarization was ((10 = 180 mV and ((10 = 50 mV (in comparison with the untreated surface), for 1.35 and 1.7 V, respectively. It is noteworthy that curves 3 and 4 have an intersection point at E ( -1.3 V. This means that, at electrode E values exceeding this value (region of low polarizations, cathodic j up to ~40 mA/cm-2), the samples treated in ethaline, at 1.35 V, demonstrated higher electrocatalytic activity than those at 1.7 V. On the contrary, in the region of relatively high cathodic polarizations (below -1.3 V and with cathodic j higher than 40 mA/cm-2), Ni-Cu alloy samples treated in ethaline, at 1.7 V, showed higher electrocatalytic activity than those processed at 1.35 V.
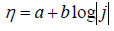
To establish a possible HER mechanism, polarization curves were plotted in the coordinates of the Tafel equation (Fig. 10):
 ***
***
where ( is the cathodic overpotential, j is the current density, and a and b are the Tafel constants.
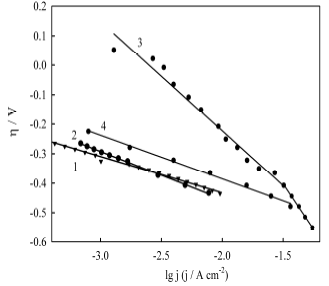
Figure 10 HER Tafel plots in 1 M NaOH on Ni-Cu alloys without electrochemical treatment and after anodic treatment in ethaline, at the following electrode E values: (1) 0.1 V; (2) 0.5 V; (3) 1.35 V; and (4) 1.7 V.
It can be seen from the obtained data that the polarization dependences are well linearized in semi-logarithmic coordinates of the Tafel equation. An essential feature of the line obtained for the sample processed in ethaline, at 1.35 V, is the presence of a salient point, i.e. formation of two Tafel sections with different constants.
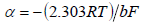
For a quantitative interpretation of the obtained data, kinetics parameters, such as exchange current density (j 0 ) and apparent transfer coefficient ((), were determined according to the following equations 37:
 ***
***
 ***
***
where T is temperature, R is the universal gas constant and F is Faraday’s constant.
For Ni-Cu alloy samples treated in ethaline, at different electrode E values, all corresponding kinetic parameters were calculated (Table 2). For the sample processed in ethaline, at 1.35 V, the kinetic parameters were determined for both Tafel dependence regions (low and high polarizations).
Table 2 Effect of Ni-Cu alloys anodic treatment in 1 M NaOH with ethaline, at different electrode E values, on HER kinetic parameters, derived from Tafel dependences.
| E of anodic treatment in ethaline (V) | Kinetic parameters | |||
| a (V) | b (V/dec-1) | ( | j o (A/cm-2) | |
| (without treatment) | -0.700 | -0.141 | 0.42 | 1.09(10-5 |
| 0.5 | -0.793 | -0.171 | 0.35 | 2.30(10-5 |
| 1.35 | -0.935 | -0.357 | 0.17 | 2.40(10-3 |
| (region of low polarizations) 1.35 | -1.230 | -0.536 | 0.11 | 5.07(10-3 |
| (region of high polarizations) 1.7 | -0.679 | -0.146 | 0.40 | 2.24(10-5 |
Information about the possible mechanism of cathodic HER is given by Tafel straight line slope (b constant). As it is well known 38,39, the following Volmer-Heyrovsky-Tafel mechanism is generally accepted for HER on transition metals in alkaline water solutions:
 ***
***
 ***
***
 ***
***
where MH stands for the H atom adsorbed onto the cathode surface.
Reaction (4) (Volmer step) is H electrochemical adsorption. Reaction (5) (Heyrovsky step) is H atoms electrochemical desorption. Finally, reaction (6) (Tafel step) is a chemical desorption step. To clarify the nature of the rate-determining step, the polarization dependence Tafel slope is commonly determined in each specific case. Assuming transfer coefficient is 0.5, at 298 K, for steps (4), (5) and (6), Tafel slopes (b constants) will be 118, 40 and 30 V/dec-1, respectively 38. In real polycrystalline samples, the experimentally determined Tafel slopes often deviate noticeably from the theoretical values.
Comparing the data given in Table 2 with the above theoretical considerations, one can conclude that, since, in most cases, the b constants are closer to the theoretically predicted value of 118 V/dec-1, then, Volmer is the rate-determining step in HER on the electrode materials under study. The only exception was the Ni-Cu alloy sample treated in ethaline, at 1.35 V, for which two Tafel linear regions, with slopes noticeably higher than the theoretical value, were found. It is known 33 that a sharp increase in the Tafel slopes is sometimes observed for cathodes with a highly developed surface (for example, porous materials). Taking into account the specific nature of the sample surface morphology (Fig. 6 c) (two types of surface areas: star-like crystallites with sharply pointed shapes and thorns, and areas of a flat and smooth surface between these crystallites), it seems very plausible that the anomalously high Tafel straight lines slopes are associated with a high degree of the electrode surface inhomogeneity.
As a working hypothesis, we assume that, at relatively low cathode polarizations, the electrode process is localized on the highly developed surface of star-like crystallites, whereas in the region of higher polarizations, smooth surface areas between crystallites are additionally connected to them. However, the verification of this hypothesis requires additional experiments, which is far beyond the scope of this study.
It is noteworthy that, due to the anomalously high Tafel slope, HER exchange j values calculated by Eq. (2) were more than two orders of magnitude higher than those for the Ni-Cu alloy untreated sample. One should be careful when comparing these values, since it is known 39 that the calculated exchange j values are highly dependent on the Tafel slopes, and might be compared only if the latter are close to each other.
One way or another, the data obtained in this study convincingly indicate that Ni-Cu alloys anodic treatment in ethaline, at certain electrode E values, leads to a significant increase in the electrocatalytic activity, with respect to HER.
Conclusions
In this work, the Ni-Cu alloy (45 wt.% Ni) anodic treatment process in DES (ethaline) was conducted for the first time, in order to increase the electrocatalytic activity with respect to HER.
It was shown that the anodic treatment proceeded under conditions of anodic surface salt passivation (sparingly soluble Ni and Cu chloride salts formation in ethaline, in the near-electrode layer), and led to the formation of Ni-Cu alloy specific surface morphology, which was previously not described in the literature. The nature of the surface morphology was highly dependent on the specified anodic processing E.
In a number of cases, the formation of star-like crystallites, with sharply pointed shapes and thorns on the surface, and/or smoothing (surface areas leveling, i.e., electrochemical polishing), were observed.
It is significant that a prolonged Ni-Cu alloy anodic treatment in ethaline, strongly changing the surface morphology patterns, practically did not affect the metallic surface layer chemical composition. In this case, metal oxides formation and passivation were also not observed, which is a significant advantage of the process under consideration, as compared with treatment in an aqueous solution.
It was found that Ni-Cu alloy anodic treatment in ethaline, at certain applied anodic E values, significantly increased the metallic surface electrocatalytic activity, with respect to cathodic HER, in an alkaline electrolyte. In our opinion, the approach proposed in this work can be used in the future to develop new high-efficient, environmentally friendly, affordable and inexpensive electrocatalysts for water electrolysis, within the framework of the H2 energy concept.
Acknowledgments
This work was financially supported by the Ministry of Education and Science of Ukraine.
Authors’ contributions
Vyacheslav S. Protsenko: conceived and designed the analysis; inserted data or analysis tools; performed the analysis; wrote the paper. Tetyana E. Butyrina: collected the data; performed the analysis. Dmytro O. Makhota: collected the data; inserted data or analysis tools; performed the analysis. Sergiy A. Korniy: collected the data; inserted data or analysis tools; performed the analysis. Felix I. Danilov: performed the analysis.
Abbreviations
AE: auxiliary electrode
ChCl: choline chloride
Cu: copper
CV: cyclic voltammogram
DES: deep eutectic solvent
E: potential
EDX: energy dispersive X-ray
EG: ethylene glycol
H2: hydrogen
HER: hydrogen evolution reaction
IL: ionic liquid
j: current density
Mol%: mole fraction of the compound multiplied by 100
NaOH: sodium hydroxide
Ni: nickel
OCP: open circuit potential
RE: reference electrode
SEM: scanning electron microscopy
SR: scan rate
WE: working electrode

