


 English (pdf)
 Article in xml format
 Article references
 Send this article by e-mail
 Cited by SciELO
  Similars in
SciELO
Similars in
SciELO 
 Permalink
Introduction
Zs-c, commonly known as Christ's Thorn or Jerusalem-thorn, in English, and Sidr, in Arabic, is a deciduous tree that is native to warm temperate and subtropical areas, including North Africa, South Europe, Mediterranean, Australia, tropical America, South and East of Asia and Middle East. It belongs to the Rhamnaceae family, in the order of Rosales, which contains about 60 genera and more than 850 species. The Zs-c genus consists of about 100 species of evergreen trees and shrubs throughout the world. Zs-c is one of the plants used as herbal medicine. It has been used in traditional Chinese Medicine to treat different diseases, such as digestive disorder, fatigue, liver disease, obesity, urinary problems, diabetes, skin infections, loss of appetite, fever, pharyngitis, bronchitis, anemia, diarrhea, insomnia and cancer. Its leaves contain betulinic and seanotic acids, various flavonoid compounds, saponins, tannins, tritepenoids, phenolics and flavonoids, which have anti-oxidant, anti-inflammatory, anti-microbial, and anti-fungal biological benefits. [1-4]
Extracts from plants have been used as green inhibitors, since they are environmentally friendly, non-toxic, cheap and abundantly available[5-8].
Metals and alloys corrosion, particularly in acidic media, is a major industrial problem[9]. It is a naturally occurring phenomenon that deteriorates a metallic material or its properties, because of an environmental reaction. It can cause dangerous and expensive damage to everything from pipelines, bridges and public buildings to vehicles, water and wastewater systems, and even home appliances. Thus, corrosion is one of the most serious problems in the industry, especially in the oil and gas sectors[10]. Most of the corrosion inhibitors are organic compounds containing heteroatoms, such as O, N or S, and multiple bonds that allow their adsorption onto metal surfaces. The inhibitors adsorption depends on the nature of their functional groups and on the electron density at the donor atoms [11].
Approaches available for controlling corrosion include the application of protective coatings to metal surfaces or their treatment, alteration of alloys chemistry and the addition of chemical species to the environment. Recent trends in research include developing environmentally friendly inhibitors, accurately predicting the service life of structures, and finding ways to take advantage of corrosion (such as dealloying) [12].
Materials and methods
Plant material
In October 2020, Zs-c leaves were bought from the local market, well washed and dried, grinded to a fine powder, by an electric mill, and saved in a dry bottle, at 25 ºC.
Zs-c CH 3 OH extract preparation
25 g Zs-c leaves powder were prepared by the maceration method [13]. Then, they were added to CH3OH (70%) as a solvent (200 mL), for 72h, at 25 ºC, with occasional stirring. Afterwards, the liquid was collected, filtered using Whatman's no. 41 filter paper, and evaporated to dryness, under a rotary evaporator, at 40 ºC, in order to obtain the Zs-c CH3OH crude extract that was kept in dark glass bottles, at 4 ºC, before being analyzed.
Phytochemicals analysis
Chemical tests were carried out on the CH3OH extract, by using standard procedures, for identifying its constituents, from characteristic color changes [14-18].
Antioxidant activity
DPPH solution preparation
DPPH solution (0.04 mg/mL) was made by weighing 2 mg of the substance and dissolving it in 50 mL CH3OH, in a measuring flask.
Sample solutions preparation
A stock solution of Zs-c leaves was diluted using CH3OH, at various concentrations.
Anti-oxidant capacity measurements
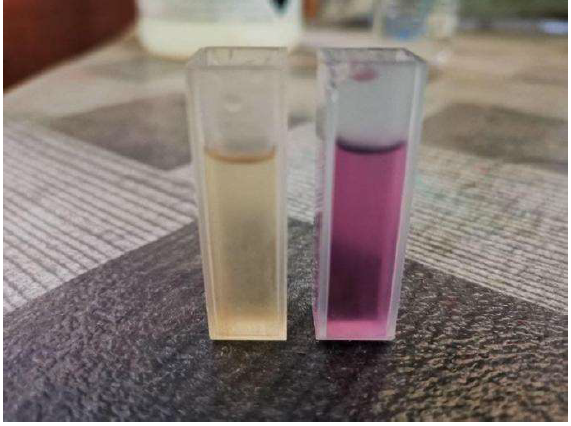
First, 2 mL DPPH were mixed with 3 mL CH3OH, incubated at 25 ºC, for 30 min. The blank anti-oxidant capacity was measured at the maximum wave-length of 517 nm. Then, the Zs-c leaves CH3OH extract was prepared for the anti-oxidant capacity measurements, by piping 1 mL of the sample solution, at 100, 250, 500, 750 and 1000 µg/mL. Afterwards, 2 mL DPPH and 2 mL CH3OH were added to the above concentrations. They were incubated for 30-60 min, at 25 ºC. The extract antioxidant capacity was quantitatively calculated by the measured absorbance, which showed a wave-length of 517 nm. If the color would change from purple to pale yellow, that would confirm the extract anti-oxidant capacity [19].
Anti-bacterial and anti-fungal activities
Two types of bacteria, negative and positive for Gram stain (Ec and Sa), were previously isolated and identified by another work. Muller-Hinton agar medium was used for the bacteria growth plates that were incubated at 37 ºC, for 24 h. The Zs-c leaves CH3OH extract (100 mg/mL) anti-bacterial activity was evaluated by the disc method. The extract was allowed to diffuse, and then incubated at the same temperature, for 18-24 h. The zone of growth inhibition was measured and recorded in mm [20].
The extract anti-fungal activity was assayed through An and Ca fungi screening, by the diffusion technique, on a PDA growth medium [21]. The fungal suspension was standardized to 106 conidia/mL, in a sterile saline solution (0.85%). 100 μL of each fungal suspension were spread onto the Petri dishes surface. After 10 min of rest, 6 mm diameter holes were punched and filled with 50 or 100 μL of the previously prepared extract samples.
As control samples for each experiment, DMSO and HE acids and TEB (Folicur® 20EC) fungicide solutions were used, at 70% and 0.1%, respectively. Subsequently, the plates were incubated at 28 ± 2 ºC. Each extract was evaluated 3 times, after 72 h, by measuring the fungi mycelial growth inhibition diameter (clear zones were considered indicative of anti-fungal activity).
TPC estimation
The extract TPC was determined by the FCR method, adapted from [22]. In a 100 mL volumetric flask, 200 µL of each extract were mixed with 10% 1.5 mL FCR reagent. The mixture was stirred and allowed to stand for 6 min, before the addition of 7.5% 1.5 mL (w/v) Na2CO3. Then, the solutions were mixed with distilled water, for obtaining a final volume of 100 mL. The reaction mixture was immediately homogenized, and kept in the dark, for 90 min, at 25 ºC.
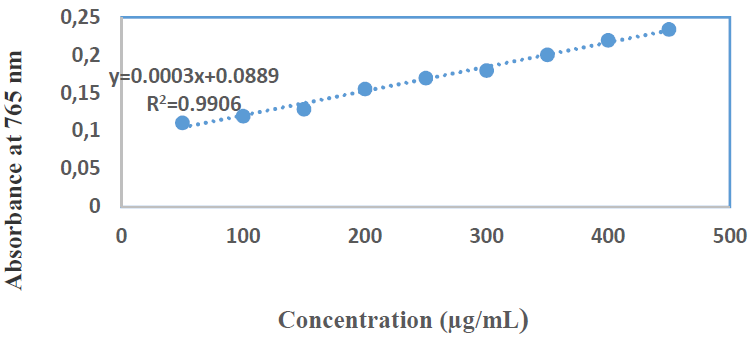
The absorbance reading of each solution was determined at 765 nm, with a UV-vis spectrophotometer. A calibration curve was performed by adopting the same operating procedure, and using C7H6O5 as positive control. The total phenolic concentrations of each extract were calculated from the linear regression equation of the calibration range established with GA. The results were expressed in mg GAE/g of the dry plant.
TFC estimation
The flavonoids were quantified by direct dosing with AlCl3, according to a method adapted from [23]. In a 50 mL volumetric flask. 100 mL of each extract were mixed with 20 mL distilled water. After 5 min, 100 mL 10% (m/V) AlCl3 were added. The solutions were then adjusted to 50 mL, with pure CH3OH, immediately homogenized, and then kept in the darkness, for 30 min, at 25 ºC.
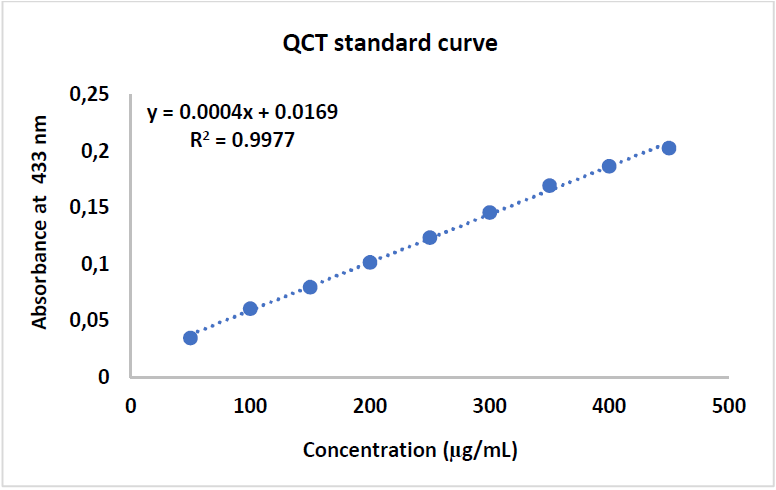
The absorbance of each solution was determined at 433 nm, with a UV-Vis spectrophotometer. A calibration curve was performed by adopting the same procedure, and QCT was used as a positive control.
The flavonoid concentrations of each extract were calculated from the regression equation of the calibration range established with QCT. The results were expressed in mg QCTE/g of the dry plant.
WE preparation
CS alloy strips with the dimensions of 5 x 1 x 0.1 cm were used, with a total area of 11.1 cm2. The strips were immersed in the solution, and then ground with increasing grades of silicon carbide paper to different smoothness levels (80, 120, 200, 400 and 600). Afterwards, they were washed with distilled water, ethanol and acetone, dried and stored in a dry place at 25 ºC, and placed in desiccators containing silica gel, for protection from moisture [24].
Sample composition
The CS alloy constituents are summarized in Table 1.
Table 1 CS alloy composition.
| C% | Mn% | P% | S% | Cu% | Si% | Cr% | As% | Ni% | Fe% |
| 0.13 | 0.30 | 0.05 | 0.04 | 0.30 | 0.37 | 0.10 | 0.08 | 0.30 | Balance |
Electrochemical cell
The electrochemical cell used for the corrosion test in the present study consisted of a 100 mL vessel connected with three electrodes arranged as follows: Pt, CS and SC as CE, WE and RE, respectively.
PDP studies (Tafel plots)
This technique is commonly employed for measuring corrosion resistance, and j vs. E, through OCP set up, for 20 min. The polarization curve was acquired by scanning in the potential range from -250 to + 250 mV vs. OCP, using a computer to control a potentiostat/galvanostat, at a SR of 10 mV/s-1.
Solutions preparation
The prepared compounds were individually synthesized with different concentrations (1, 2, 8 and 9 ppm), at 298 K. Then, the optimal concentration was studied at different temperatures (308, 318 and 328 K), in HCl.
Results and discussion
Phytochemicals analysis
Phytochemical screening for Zs-c leaves CH3OH extract revealed the presence of flavonoids, phenols, carbohydrates, tannins, saponins, alkaloids, fixed oils and fats, as summarized in Table 2.
Table 2 Phytochemical analysis of Zs-c leaves CH3OH extract.
| Phytochemical analysis | Flavonoids | Phenols | Saponins | Alkaloids | Carbohydrates | Tannins | Fixed oils and fats | |
| Zs-c leaves CH3OH extract | +++ | +++ | +++ | ++ | ++ | ++ | ++ |
Zs-c leaves CH3OH extract phytochemical analysis results shown in Table 2 revealed a positive detection of all the tested phytochemicals.
Antioxidant activity
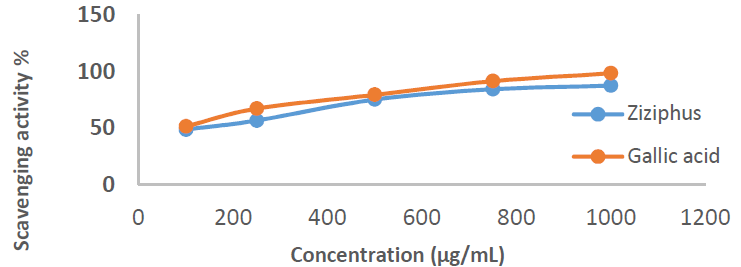
Free radicals that are commonly used as a model for assessing inhibitors anti-oxidant activity include DPPH, a stable compound, with absorbance values in the range from 510 to 520 nm [25]. This method is based on the (Diphenyl picryl hydrazine) DPPH free radical reduction in a colored solution, by its inhibition. When the DPPH in the purple solution meets the electron donor material it is reduced, and its color is replaced by yellow, from picryl group [26]. The inhibitor anti-oxidant activity was measured by a UV-vis spectrophotometer, at a wavelength of 517 nm, as the DPPH solution maximum wavelength [27], and its strength was indicated by the IC50 value. IC50 values lower than 100 µg/mL are said to have strong anti-oxidant activity that is able to inhibit 50% of the oxidation. Since the result of the IC50 value was 62.89 µg/Ml, it can be stated that Zs-c leaves extract anti-oxidant activity was strong. C7H6O5 positive control showed a higher IC50 )97.47 µg/mL). Table 3 shows the scavenging activity of Zs-c leaves CH3OH extract on DPPH, and IC50 value.
Table 3 Scavenging activity of Zs-c leaves CH3OH extract on DPPH.
| Extract | Concentrations (µg/mL) | Scavenging activity CH3OH C7H6O5 | ||
| Zs-c leaves in CH3OH | 100 | 48.89 | 51.84 | |
| 250 | 56.90 | 62.59 | ||
| 500 | 75.44 | 79.66 | ||
| 750 | 84.51 | 91.57 | ||
| 1000 | 87.67 | 96.83 | ||
| IC50 | 62.89 | 2.16 | ||
Figs. 1 and 2 show the scavenging activity of Zs-c leaves CH3OH extract on DPPH.
Anti-bacterial activity
Zs-c leaves CH3OH extract anti-bacterial activity revealed variable inhibition effects against gram-positive bacteria Sa (+) and gram negative bacteria Ec (-), as show in Fig. 3, and against the two fungi An and Ca, in Fig. 4. The results are summarized in Table 4.
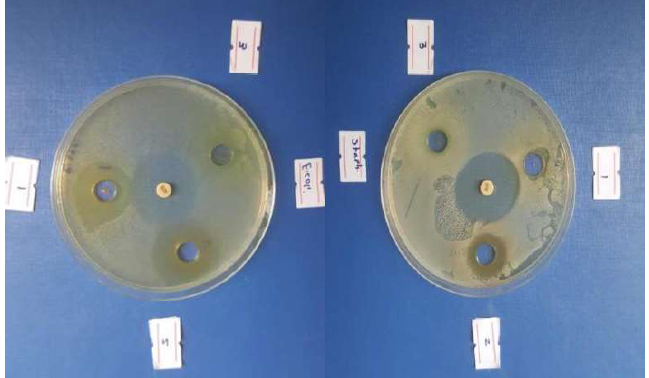
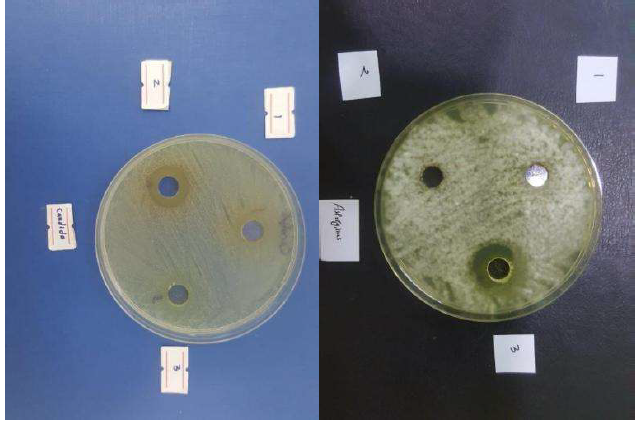
Table 4 Anti-bacterial and anti-fungal activity results of Zs-c leaves CH3OH extract.
| Test organisms | Inhibition zone (mm) |
| Ec | 27 |
| Sa | 14 |
| Ca | 18 |
| An | - |
From Table 4, Zs-c leaves CH3OH extract showed high activity against Ec (27 mm) and Sa (14 mm). So, Zs-c leaves CH3OH extract was more active against Gram negative bacteria (Ec) than against Gram positive bacteria (Sa). It was active for Ca and inactive for An. This result was similar to Al-Bayatti’s study [28].
TPC
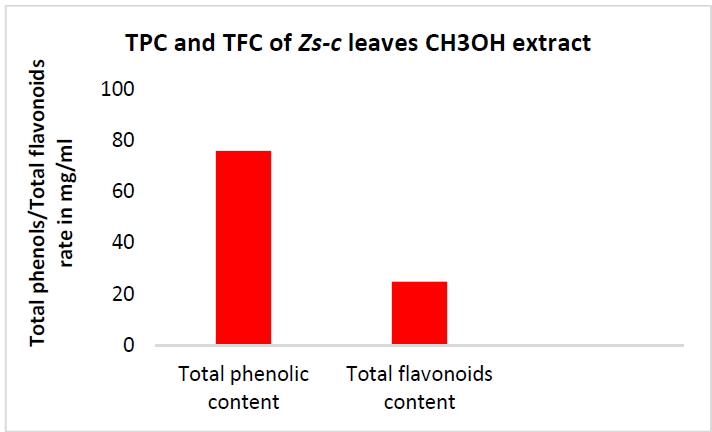
TPC of Zs-c leaves CH3OH extract was notable, with the highest value of 70.06 mg GAE/g. Generally, higher TPC than TFC are logical, since the former are major polyphenol compounds. This indicates that the extract contains other phenolic compounds with different chemical structures than flavonoids (phenolic acids, tannins, etc.) [29].
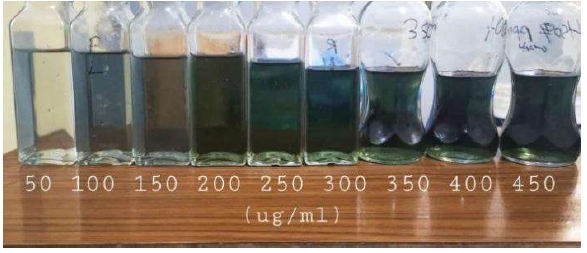
Figs. 5 and 6 show C7H6O5 standard curve and diluted concentrations, respectively.
TFC
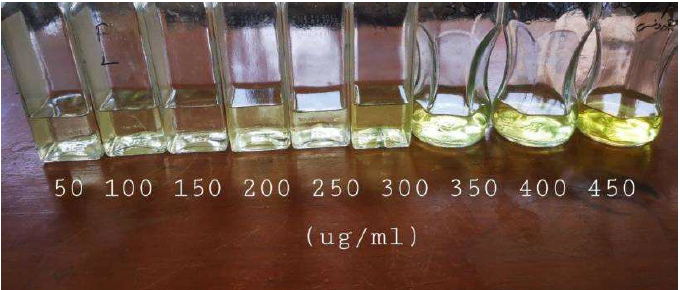
Examination of TFC results shows a positive correlation between the standard QCT concentration and the absorbance, with a R2 value of 0.9906. Zs-c leaves CH3OH extract showed a TFC of 25 mg QCTE/g. Figs. 7, 8 and 9 show QCT standard curve, its diluted concentrations, and a summary of TPC and TFC for Zs-c leaves CH3OH extract.
Corrosion study
Zs-c leaves CH3OH extract was evaluated as inhibitor for C1010 alloy corrosion in 0.1 M HCl. The electrochemical data for the alloy surface, with different CH3OH extract concentrations, were obtained by plotting the Tafel plots, as shown in Fig. 10, and are summarized in Table 5.
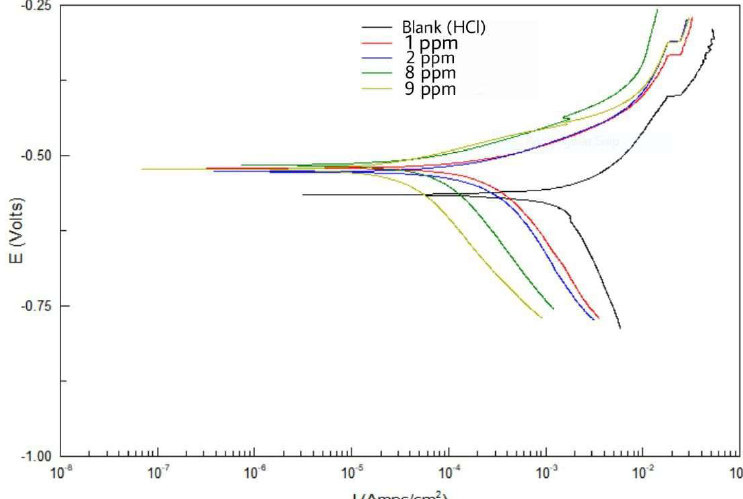
Figure 10 Tafel plots for CS alloy with different Zs-c leaves CH3OH extract concentrations, relative to the blank solution, at 25 ºC.
Table 5 and Fig. 10 show the electrochemical data obtained from Tafel plots at 1, 2, 8 and 9 ppm concentrations of Zs-c leaves CH3OH extract, as an anti-corrosion agent for CS in HCl. Generally, an increase in the inhibitors concentrations significantly changed the electrochemical factors obtained from the Tafel plots. It was noted that higher inhibitors concentrations led to lower Icorr and CR values, and increased Rp. In its turn, IE increased from 85,24%, at 1 ppm (mg/L-1), to 96.06%, at 9 ppm, which was due to the inhibitor layer adsorption onto the C1010 surface. On the other hand, Ecorr value was lower in the inhibited solution, with higher inhibitors concentrations, than in the blank solution. There was a small displacement between Ecorr with and without inhibitor. If this difference is lower than -89 mV, it indicates that the inhibitor is of mixed type [30-31]. βa and βc values are shown in Table 5.
Table 5 Electrochemical data for CS alloy surface corrosion without and with Zs-c leaves CH3OH extract, in different concentrations, at 25 ºC.
| Constituent | Conc. ppm | -Ecorr mV vs. SCE | βa mV/decade | βc mV/decade | Rp Ω.cm2 | Icorr μA.cm-2 | CR Mpy | IE % |
| HCl | ---- | - 567 | 213.23 | 1198.36 | 11.471 | 1569.2 | 726.65 | ------ |
| HCl + Zs-c leaves CH3OH extract | 1 | - 529 | 87.665 | 322.77 | 77.723 | 231.59 | 107.24 | 85.24 |
| 2 | - 535 | 81.024 | 435.56 | 98.972 | 181.87 | 84.219 | 88.40 | |
| 8 | - 517 | 72.171 | 266.07 | 243.78 | 73.83 | 34.192 | 95.29 | |
| 9 | - 517 | 71.034 | 329.14 | 291.49 | 61.75 | 28.596 | 96.06 |
It can be noticed that those values varied with different inhibitor concentrations, which indicates changes in the inhibition mechanism. This means that the prepared inhibitors acted by simple blocking the reactions [32-33].
Study of Zs-c leaves CH 3 OH extract adsorption isotherm
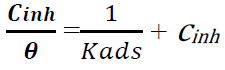
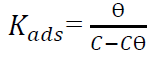
There are various isotherms used to determine the appropriate adsorption mechanism of inhibitors onto metals surface, such as Temkin’s, Langmuir’s, Frumkin’s and Freundlich’s isotherms. The most suitable model to describe Zs-c leaves CH3OH extract adsorption onto the alloy surface was Langmuir’s isotherm, which is shown by the following equation:
 (1)
(1)
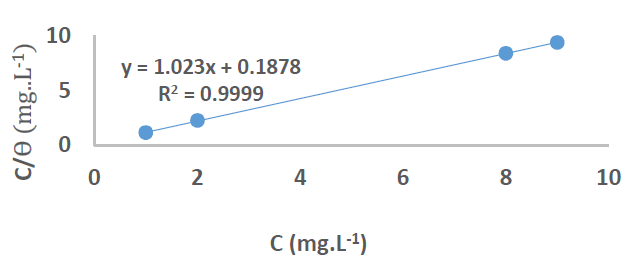
where Cinh is the inhibitor concentration in ppm [34-35]. Langmuir’s adsorption isotherm was the most suitable for this inhibitor, because it gave a R2 value close to 1 [35].
At 25 ºC (298 K), the plotting of Cinh/Ɵ vs Cinh (Fig. 11) gave a straight line for Kads, given by the y-intercept reciprocal, but at 35, 45 and 55 ºC (308, 318 and 328 K), it was calculated directly through equation (1), for an optimal concentration.
Thus, equation (1) can be rewritten by the following equation:
 (2)
(2)
ΔGºads action of the inhibitor on the alloy was calculated towards Kads values, as in equation (3):
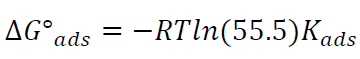 (3)
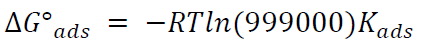
(3)55.5 is the water concentration in mol/L-1. Thus, equation (3) can be rewritten by the following equation:
 (4)
(4)
The above value (999000) represents the product of water concentration (55.5) and molecular weight (18 g/mol-1) multiplied by 1000, to convert the unit of grams to:
 (5)
(5)
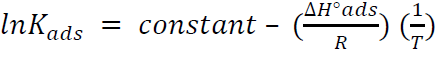
By plotting InKads vs. 1/T, a straight line was obtained, and the given slope was − ∆𝐻°𝑎𝑑𝑠 𝑅 , as in Fig. 12. ΔSºads was calculated according to the following equation [36]:
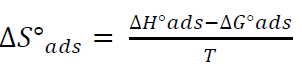 (6)
(6)
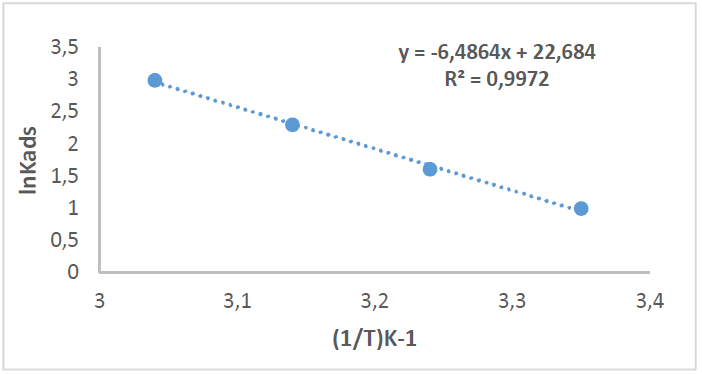
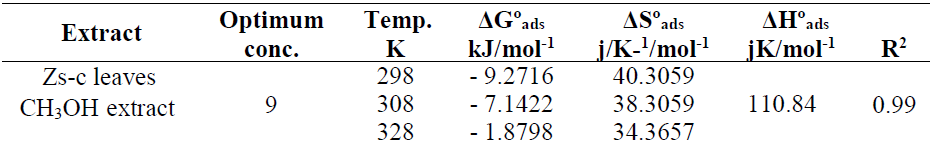
Table 6 shows thermodynamic functions for Zs-c leaves CH3OH extract optimum concentration (9 ppm), at all studied temperatures (from 25 to 55 ºC).
The effect of temperature on the corrosion reaction
The effect of temperature on the corrosion reaction without and with inhibitor, at its optimal concentration, was studied at 25 (298 K), 35 (308 K), 45 (318 K) and 55 ºC (328 K). Table 7 and Fig. 13 show that, as temperature increased, Icorr and CR values were higher, while Rp and IE% values were lower.
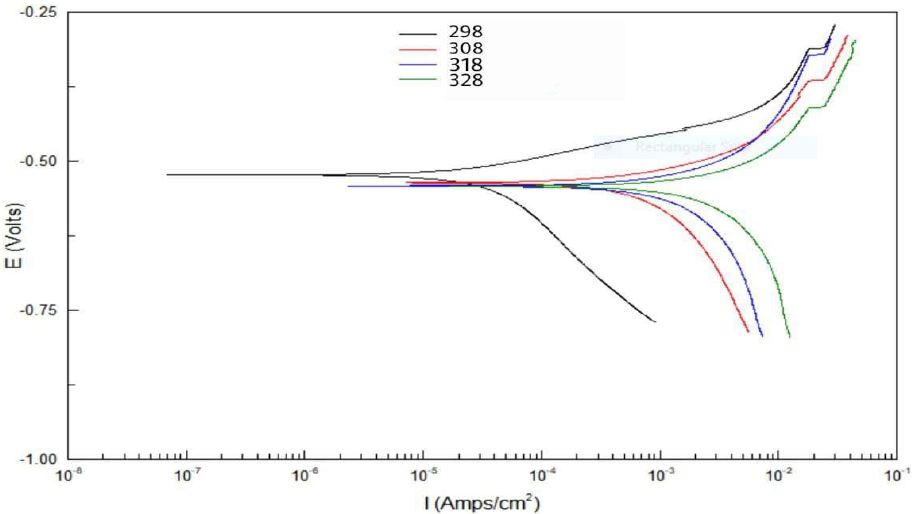
Figure 13 Tafel plots for five concentrations of Zs-c leaves CH3OH extract, compared to the blank solution, at different temperatures.
Table 7 Electrochemical data for CS alloy surface corrosion, without and with Zs-c leaves CH3OH extract, at different concentrations and temperatures.
| Constituent | Conc. ppm | Temp. K | Ecorr mV vs. SCE | βc mV/decade | Βa mV/decade | Rp Ω/cm2 | Icorr µA/cm-2 | CR mpy | IE% |
| HCl (blank) | - | 298 | -567 | 0498.36 | 213.23 | 11.471 | 1596.2 | 726.65 | ---- |
| 308 | -563 | 1179.14 | 283.06 | 10.341 | 1740.06 | 806.05 | |||
| 318 | -571 | 1213 | 131.53 | 9.581 | 1891.12 | 875.75 | |||
| 328 | -549 | 1110.3 | 465.17 | 6.533 | 2734.2 | 1266.1 | |||
| Zs-c leaves CH3OH extract | 9 | 298 | -517 | 329.14 | 71.043 | 291.49 | 61.75 | 28.59 | 96.06 |
| 308 | -538 | 732.17 | 136.72 | 29.143 | 617.63 | 286.01 | 64.51 | ||
| 318 | -542 | 361.32 | 170.91 | 17.96 | 1002.2 | 464.1 | 47.00 | ||
| 328 | -543 | 2403.06 | 274.79 | 9.541 | 1885.8 | 873.27 | 31.02 |
These values can be attributed to the kinetic energy reduction for the corrosive molecules, whether without or with inhibitor [37-38]. In this study, to better understand C1010 corrosion reaction behavior, without and with inhibitor, kinetic parameters were calculated according to Arrhenius equation [39]:
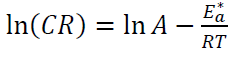 (7)
(7)
where A is Arrhenius factor (s-1), T is absolute temperature (K) and R is the universal gas constant (8.314 kJ-1/mol-1).
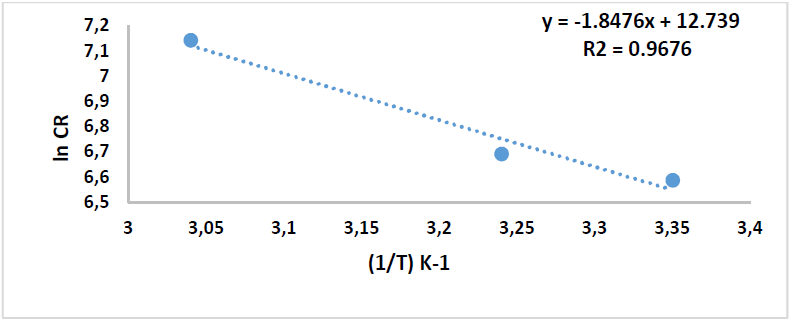
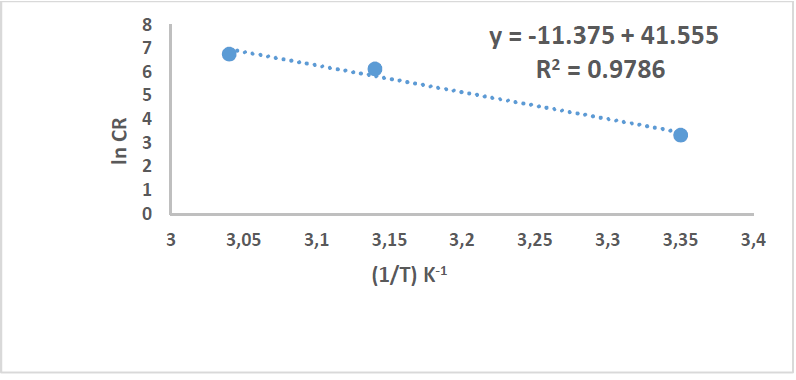
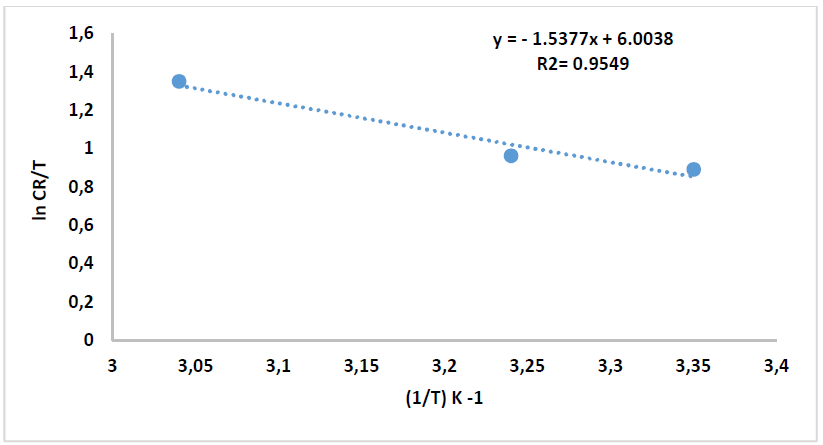
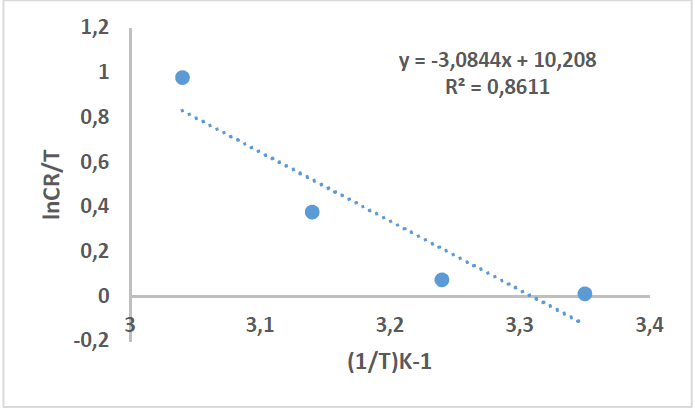
By plotting the above relationship, i.e., ln(CR) against 1/T, 𝐸 𝑎 ∗ was calculated as in Figs. 14 and 15.
On the other hand, other kinetic parameters, such as ΔH*, ΔS* and ΔG*, were calculated, where the first two were estimated according to the following equation [30][37]:
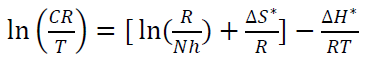 (8)
(8)
where N is Avogadro’s number (6.023 x 10²³ mol-1) and h is the Plank’s constant that is equal to 6.625 x 10⁻³⁴ J/s. By plotting ln 𝐶𝑅 𝑇 against 1 𝑇 , the slope is equal to −∆𝐻 ∗ 𝑅 , and the intercept is equal to ln[ ( 𝑅 𝑁ℎ )+ ∆𝑆 ∗ 𝑅 ] , as in Figs. 16 and 17.
Thus, kinetic parameters data can be summarized in Table 8.
Table 8 Kinetic parameters for CS alloy corrosion reaction without and with inhibitor, at optimal concentration.
| Comp. | Conc. | Ea kJ/mol-1 | A s-1 | ΔH kJ/mol-1 | ΔS J/k/mol-1 |
| HCl | ------- | 15.36 | 3.4078 x 10⁵ | 12.78 | -91.62 |
| CH3OH extract | 9 ppm | 94.57 | 1.1145 x 10¹⁸ | 92.00 | 91.98 |
Table 8 reveals that 𝐸 𝑎 ∗ increased more with the extract, which means that C1010 corrosion reaction with the inhibitor was lower than without it. 𝐸 𝑎 ∗ values were 15.36 and 94.57 kJ/mol-1, without and with inhibitor, respectively, which is higher than the threshold value of 80 kJ/mol-1 required for chemisorption.
Thus, it is concluded that the inhibitor underwent chemical adsorption. This higher 𝐸 𝑎 ∗ value with the inhibitor is attributed to an appreciable decrease in the HCl molecules adsorption onto the alloy surface [40].
The corresponding increase in the corrosion rate is also attributed to the greater metal area exposed to HCl. ΔH* positive sign refers to the endothermic nature of the dissolution process, whether without or with the inhibitor, which implies that the alloy dissolution increased with higher temperatures, but it became difficult in the inhibitor presence [41-42].
The Arrhenius factor depicted that the corrosive molecules vibration increased with the inhibitors. In other words, these corrosive molecules will be mixed with the inhibitor molecules, to form a stable film on the surface alloy. ΔS value was negative without inhibitor, because the corrosive molecules tended to be stable after they have reacted with the alloy surface with inhibitor. With the extract, ΔS value was positive, since the inhibitor molecules incorporated within the corrosive molecules, forming a protective film on the alloy surface, and the activated complex was formed as a rate determining step [43].
Conclusions
Several points can be summarized below as conclusions:
1- Zs-c leaves CH3OH extract showed high efficiency as an inhibitor for C1010 corrosion, with an IE of 96.06%, at 9 ppm, at 25 ºC, in 0.1 M HCl.
2- IE% decreased with increasing temperatures.
3- The inhibitor showed TPC of 70 mg GAE/G and TFC of 25 mg QCTE/g.
4- The extract showed high IE% values against Sa + (inhibition diameter of 17 mm) and Ec - bacteria (inhibition diameter of 27 mm) growth, with 100 mg/mL.
5- The inhibitor showed IE% values against Ca fungi growth (inhibition of 18 mm), but it had no effect on An fungi.
6- The inhibitor contributed to increase 𝐸 𝑎 ∗ of C1010 corrosion reaction, and it behaved as an anodic inhibitor.
Authors’ contributions
Sarah Z. AL-Ashoor (M.Sc. student): conceived and designed the analysis; collected the data. Dawood S. Ali (1st Sarah’s supervisor): inserted data or analysis tools. Hadi Z Al-Sawaad (2nd Sarah’s supervisor): performed the analysis; wrote the paper.
Abbreviations
AlCl3: aluminum trichloride
An: Aspergillus niger
Ca: Candida albicans
C6H6O: phenol
C7H6O5: gallic acid
CE: counter electrode
CH3OH: methanol
CR: corrosion rate
CS: carbon steel
DMSO: dimethyl sulfoxide
DPPH: 2,2-diphenyl-1-picrylhydrazyl
E: electric potential
Ec: E. coli
Ecorr: corrosion potential
FCR: Folin-Ciocâlteu reagent
HCl: hydrochloric acid
HE: hydroethanolic acid
IC50: half-maximal inhibitory concentration
Icorr: corrosion current density
J: current density
IE%: inhibition efficiency
mg GAE/g: milligrams of gallic acid equivalent per gram
mg QCTE/g: milligrams of quercetin equivalent per gram
Na2CO3: sodium carbonate
OCP: open circuit potential
PDA: potato dextrose agar
PDP: potentiodynamic polarization
QCT: quercetin
R2: correlation coefficient
RE: reference electrode
Rp: polarization resistance
Sa: Staphylococcus aureus
SC: scan rate
TEB: tebuconazole
TFC: total flavonoid contents
TPC: total phenolic contents
WE: working electrode
Zs-c: Ziziphus spina-christi
Symbols definition
(a: anodic Tafel slope
(a: cathodic Tafel slope
ΔGads: adsorption free energy
ΔHads: adsorption enthalpy
ΔSads: adsorption entropy
Kads: adsorption equilibrium constant (L/mg-1)
θ: surface coverage

