


 (pdf)
(pdf)


 SciELO
  SciELO
 Permalink
Introduction
Steel is a versatile material, with several applications in industry, automobiles and construction. When steel gets in contact with the environment or aggressive substances like acids, it undergoes corrosion, which is a natural process that hinders materials performance and causes losses that are a major issue in industry.
Therefore, it is necessary to deal with the corrosion effects. One way to prevent them is to add corrosion inhibitors that protect metals surfaces against acids, by decreasing the anodic oxidation and cathodic reduction rates, or both.
The inhibitors form a protective film on the metal surface by physical (electrostatic) adsorption or chemisorption 1-6.
Corrosion inhibitors can be composed of inorganic or organic materials. Surfactants, polymers and substances containing O, N, S, P and aromatic compounds, as well as double bonds, are all examples of organic molecules that can be employed as inhibitors 6-11.
Despite the fact that MS easily rusts in humid air and has a high CR in extremely acidic environments, it is one of the most commonly used technical materials for automotive constructions and applications. Thus, MS corrosion resistance is critical. In addition to the standard processes, chemical inhibitors are an alternative way of preventing corrosion in acidic solutions 12-15.
Senggani is one of the plants that grows in Indonesia. Its leaves contain saponins, flavonoids and tannins. These organic chemicals are intended to be adsorbed onto the steel surface, reducing and maybe preventing corrosion 2,8.
Therefore, this research has been carried out with the aim of determining St-37 S CR in a HCl solution with or without SLE, and studying the metal changes by SEM analysis.
Materials and methods
St-37 S surface preparation
St-37 S bars were cut in coupons with a diameter of ± 2.5 cm and a thickness of ± 0.1 cm. Their surface was smoothed by Fe sandpaper, and rinsed with distilled water. Then, they were cleaned with acetone, to remove any grease that might have adhered to them. Furthermore, they were dried in an oven, at a T of 60 ºC. Afterwards, the St-37 S coupons were weighed, and the results were expressed as m1.
SLE preparation
SL were taken in the area surrounding the Andalas University forest. Only the green SL were taken, freshly dried, mashed, weighed up to 400 g, and extracted thrice with 2000 mL CH3OH, where they were kept for 3 days. The obtained extract was filtered, and the solvent was evaporated using a rotary evaporator (Heidolph W2000). The obtained concentrated SLE was placed into a 100 mL glass beaker, to make a solution with different C (0, 0.2, 0.4, 0.6 and 0.8%).
SLE phytochemical screening
SLE phytochemical screening was done to qualitatively determine the presence of flavonoids, triterpenoids, steroids and phenolic compounds, using the following method: 1 g of the SLE sample was put into a test tube, and macerated with CH3OH that had been heated (on a water bath) for 15 min. Then, it was filtered hot into another test tube, and all the CH3OH was let to be evaporated.
Afterwards, 5 mL each CHCl₃ and water were added to the sample in a ratio of 1:1. The mixture was well shaken, transferred into a test tube, and left for a moment, until two layers of CHCl₃-H2O were formed.
The CHCl₃ layer at the bottom and the H2O layer were used for examining triterpenoid and steroids, and phenolic and flavonoids, respectively.
Tests for flavonoids, phenolic, triterpenoids and steroids, and alkaloids compounds
Tests were made for the detection of the following compounds: for flavonoids, some of the H2O layer was taken and transferred with a pipette into a test tube. Then, concentrated HCl and a few grains of Mg powder were added to it. The change in color of orange to red indicated their presence; for phenolics, a portion of the H2O layer was put by a pipette into a test tube. Then, FeCl3 was added to it. Blue coloration indicated their presence; for steroids and triterpenoids, a drop each of acetic anhydride and concentrated H2SO4 were put into a hole plate from the CHCl₃ layer. The appearance of green or blue, and red colors, respectively, indicated their presence; finally, for alkaloids, 2-4 g of the sample were cut into little pieces, crushed in a mortar with sand and 10 mL of 0.05 N CHCl₃-NH3, and then slowly agitated or ground. The solution was filtered through a small funnel with a cotton swab, and the filtrate was transferred into a test tube, where 10 drops of 2 N H2SO4 were added and gently shaken, for a few moments, until NH3 and CHCl₃ layers were separated. With a pipette, NH3 layer was removed and put into a tube. Then, Meyer's reagent was added. The appearance of a white precipitate indicated their presence.
HCl corrosive medium preparation
103.5 mL of a 37% HCl solution were pipetted and put it into a 250 mL volumetric flask that already contained distilled H2O. Furthermore, distilled H2O was added up to the limit mark. The obtained 5 N HCl solution was used to prepare the HCl corrosive medium. The prepared steel was immersed into the pippeted 10 mL HCl solutions that were used for the tests.
HCl corrosive medium preparation with SLE
SLE with different C (0, 0.2, 0.4, 0.6 and 0.8%) was mixed with 10 mL of the 1.0 N HCl solution. Then, distilled H2O was added until the volume was 50 mL.
CR based on the WL method
St-37 S was immersed in 50 mL of the 1 N HCl solution, at various C, with and without SLE, at T of 30, 40, 50 and 60 ºC, for 7 h, using a water bath. The steel was then cleaned, rinsed and dried in the oven, at 60 ºC. After drying, St-37 S was weighed, and the findings were expressed as m2.
PDP method
In PDP measurements, St-37 S (with a diameter of 2.54 cm and a surface area of 0.020 cm2), Pt and Ag/AgCl were used as WE, AE and RE, respectively. The three electrodes were immersed in a vessel containing HCl without and with 0, 0.2, 0.4, 0.6 and 0.8% SLE. Then, they were connected to a potentiostat, and E was adjusted, so that the curve of the relationship between E vs I was obtained. In the PDP measurements, the curve of the relationship between E (mV) and current log (mA/cm2) was obtained. E was set from -1000 to 500 mV, in order to obtain a PDP curve 14-17.
FTIR spectroscopy
FTIR (Thermo Scientific Nicolet iS10) analysis was carried out by measuring the corrosion of St-37 S, and washing, drying and analyzing the metal, using a KBr pellet plate. FTIR analyses were also carried out for SLE.
SEM
St-37 S was immersed in 1 N HCl, without and with SLE, for 7 h. Then, it was dried and analyzed by SEM (Hitachi S-3400N).
Results and discussion
Phytochemical screening
The presence or absence of alkaloids, flavonoids, phenolics and triterpenoids compounds in SLE was determined by phytochemical screening. The + and - signs indicate them in Table 1.
Table 1 Phytochemical screening results on SLE.
| Phytochemical screening | SLE |
|---|---|
| Alkaloids | + |
| Flavonoids | ++ |
| Phenolic | + |
| Triterpenoid | + |
| Steroids | - |
SLE corrosion IE(%) evaluation by WL
C effect on St-37 S CR with T variations
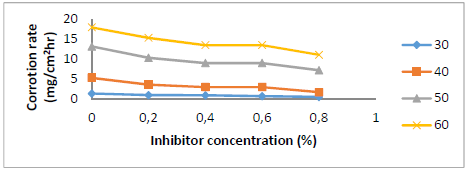
Fig. 1 shows SLE C (0 to 0.8%) effect on St-37 S CR in 1 N HCl. CR decreased as SLE content increased. It was only 0.78 mg/cm2/h with 0.8% SLE.
St-37 S CR IE(%) by SLE
Fig. 2 shows IE(%) with different SLE C. As SLE C was increased, its IE(%) also rose, reaching 67% at 0.8% in a HCl medium. The stronger SLE adsorption onto the St-37 S surface resulted in the formation of a thin layer that protected the metal, resulting in a decrease in CR and an increase in IE(%) 18-19. SLE acted as a ligand, because of its lone pair of electrons donated to the Fe3+ center. This compound complex protected St-37 S from HCl attack. The protective layer inhibited aggressive ions from reaching the metal, reducing its CR in HCl 18-20.
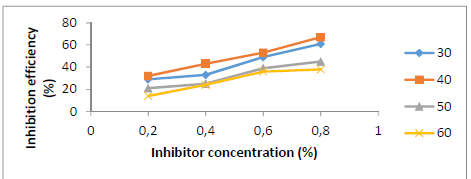
Figure 2 SLE C effect on its IE(%) for St-37 S corrosion in a 1 N HCl solution, at different T, for 7 h.
E a determination
The St-37 S CR value in 1 N HCl without and with SLE, at various T of 30, 40, 50 and 60 ºC, was used to determine Ea. The relationship between 1/T and ln V produced a straight line, as shown in Fig. 3 graph. The slope value was Ea/2.303 R.

Figure 3 Arrhenius flow (1/T (K-1) vs ln V) for St-37 S CR in 1 N HCl, with an immersion time of 7 h.
Table 2 shows that Ea with SLE was higher than without it. The high Ea suggests that the reaction was difficult to initiate, due to the layer formed by SLE adsorbsion onto St-37 S. This layer protected the metal against HCI attack and corrosion 20-26.
Table 2 Ea, ∆H° and entropy ∆S° values without and with SLE.
| Medium | Ea (kJ/mol) | ∆H° (kJ/mol) | ∆S° (kJ/mol) |
|---|---|---|---|
| 1 N HCl | 73.38 | 29.70 | 82.61 |
| 1 N HCl + 0.2 % SLE | 79.36 | 30.99 | 77.81 |
| 1 N HCl + 0.4% SLE | 79.73 | 48.19 | 27.46 |
| 1 N HCl + 0 ,6% SLE | 80.95 | 50.47 | 20.02 |
| 1 N HCl + 0.8% SLE | 89.76 | 51.17 | 17.71 |
∆H° value was positive, indicating that the occurred process was an endothermic reaction. ∆H° value of a reaction with an inhibitor is higher than without it. This demonstrates that the corrosion process requires a significant amount of energy. ∆S° value with various SLE C was also higher than without the inhibitor. This demonstrates that adding inhibitors to metals slows down the corrosion process.
SLE corrosion IE(%) analysis by the adsorption isotherm method
Fig. 4 shows an adsorption isotherm based on the WL method analysis that follows the Langmuir’s adsorption isotherm, because the path between C and C/θ gave a straight line, with a R2 of 0.9126.
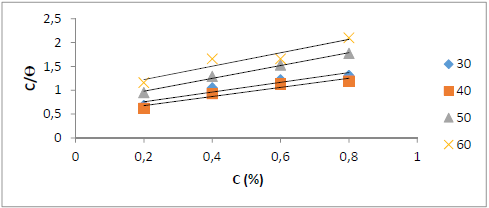
Figure 4 Langmuir’s adsorption isotherm for St-37 S corrosion in 1 N HCl, for 7 h of immersion time, based on the WL method.
Kads and ΔGads values for SLE adsorption on the St-37 S surface is shown in Table 3. The inhibitor adsorption onto the steel surface was considered physisorption, if the ΔG value was greater than -20 kJ/mol. The inhibitor and steel had a weak bond in this kind of absorption, which caused the complex between them to be easily dissociated.
Table 3 Kads and ΔGads values, at T from 30 to 60 ºC.
| Temperature (ºC) | Kads (mmol⁻¹) | ∆Gads (kJ/mol) |
|---|---|---|
| 30 | 1.818 | -11.623 |
| 40 | 2.040 | -12.306 |
| 50 | 1.408 | -11.703 |
| 60 | 1.063 | -11.287 |
SLE corrosion IE(%) analysis by PDP method
Fig. 5 indicates that the reactions occurred with both anodic and cathodic processes, based on extrapolated data from the Tafel plot. SLE inhibited anodic corrosion by its adsorption, which inhibited the oxidation reaction or reduced the metal solubility. SLE also inhibited cathodic corrosion by the reaction between it and HCl H+ ions, which mitigated the reduction process of H+ ions into H2. Ecorr value changed towards anodic and cathodic directions. Its value that went up and down indicates the stability of SLE adsorption onto the St-37 S surface. Icorr was caused by the movement of oxidized metal electrons in the HCl medium 27-34.
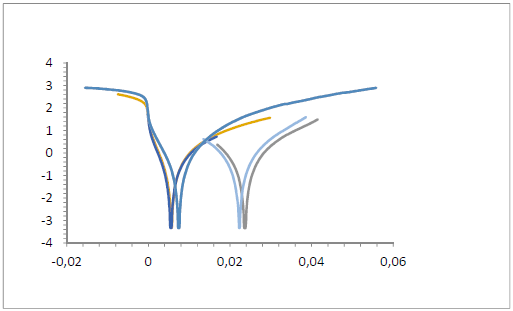
Table 4 shows that, when SLE C were increased, Icorr values fell. The decrease in Icorr was caused by SLE, because the electrons movement of the oxidized St-37 S in 1 N HCl decreased. With higher SLE C, IE(%)increased. The highest IE(%) (69.72%) was obtained from the extrapolated Tafel slope value with SLE addition at a C of 0.8%.
Table 4 Ecorr, Icorr, IE(%) and extrapolated Tafel plots values without and with SLE.
| SLE C | Ecorr (V) | Icorr (µA/cm2) | EI (%) |
|---|---|---|---|
| 0 | 0.0068 | 0.0182 | - |
| 0.2 | 0.0268 | 0.00913 | 49.83 |
| 0.4 | 0.0632 | 0.00872 | 52.08 |
| 0.6 | 0.0243 | 0.00774 | 57.47 |
| 0.8 | 0.0523 | 0.00551 | 69.72 |
FTIR analysis
FTIR spectrum of 0.5% SLE and corrosion products (rust) from St-37 S immersion in 1 N HCl, for 7 h, at 30 ºC, is shown in Fig. 6. Fig. 6a shows SLE spectrum, which contains the hydroxyl group of -OH (3500-3000 cm-1), CH (3000-2500 cm-1), C = C (1640-1610 cm-1), and CO (1042-1448 cm-1) stretchings, and a low CO2 vibration intensity peak at wave number 2360.37 cm-1. In Fig. 6b, there is a shift in -OH from the wave number 3393.75 to 3432.19 cm-1, a shift in the C=C stretching group from the wave number 1616.78 cm-1 to 1637.66 cm-1, and a shift in the other functional groups. This tended to happen when SLE interacted with the St-37 S surface, forming a thin protective layer.
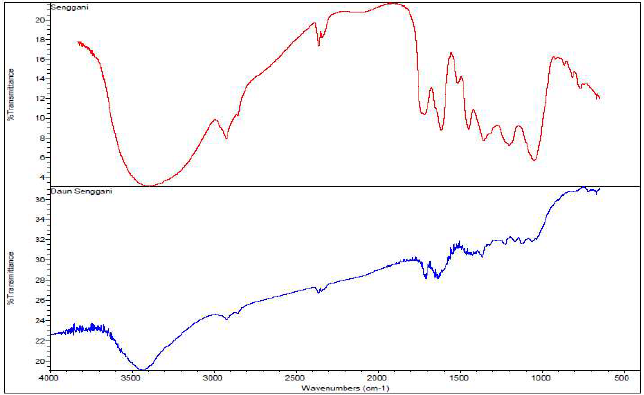
Figure 6 FTIR spectra of (a) SLE and (b) corrosion products from St-37 S immersion in 1 N HCl with SLE, for 7 h.
SEM analysis
Fig. 7 shows that there was no damage caused by SLE presence. This was due to the SLE adsorption on the St-37 steel surface, which formed a protective coating that protected the metal and caused it to corrode only slightly. Fig.7 (a) shows the St 37 S surface without treatment, at 100 x magnification. The metal surface still looks good, not porous, and did not crack, because there was no interaction with HCl. Fig. 7 (b) shows the steel surface after 7 h of immersion in HCl. Corrosion caused obvious holes and brownish rust on the metal surface, due to its interaction with H+ and Cl- ions. Fig. 7 (c) shows St-37 S surface immersed in HCl with 0.5% SLE, revealing that it was less damaged than the one without it, because the inhibitor formed a protective layer on the metal.

Conclusions
According to the findings, SLE can be employed as a corrosion inhibitor. IE(%) was 67% percent for tests based on WL, and 69.72% for measurements based on PDP, at the optimum extract C of 0.8% in 1 N HCl. Icorr decreased with SLE increasing C, according to the PDP study. The Ea value increased with higher SLE C, indicating that corrosion was more difficult to achieve. SEM results also revealed a significant difference in IE(%) without and with SLE.
Authors’ contributions
L. Anggraini: conceived and designed the analysis; wrote the paper. Emriadi: conceived and designed the analysis; performed the analysis; wrote the paper. Y. Stiadi: collected the data; inserted data or analysis tools; performed the analysis. S. Zulaiha: inserted data or analysis tools; performed the analysis. H. Pardi: inserted data or analysis tools; performed the analysis; wrote the paper.
Abbreviations
1/T: first-order reaction
AE: auxiliary electrode
C: concentration
C/Ɵ: concentration per degree of closure
CH3OH: methanol
CHCl₃: chloroform
CR: corrosion rate
E: electric potential
Ecorr: corrosion potential
FeCl3: ferric chloride
FTIR: Fourier transform infrared spectroscopy
H2SO4: sulfuric acid
HCl: hydrochloric acid
I: electric current
Icorr: corrosion current density
IE%: inhibition efficiency
KBr: potassium bromide
ln V: reactant velocity
m1: initial weight
m2: final weight
MS: mild steel
NH3: ammonia
PDP: potentiodynamic polarization
R: reaction rate
R2: correlation coefficient
RE: reference electrode
SEM: scanning electron microscopy
SLE: Senggani (Melastoma candidum D. Don) leaf extract
St-37 S: stainless steel 37
T: temperature
WE: working electrode
WL: weight loss
Symbols definition

