


 Inglês (pdf)
 Artigo em XML
 Referências do artigo
 Enviar este artigo por email
 Citado por SciELO
  Similares em
SciELO
Similares em
SciELO 
 Permalink
Introduction
In recent years, the quality of water resources has been affected, due to population increase, industrial production, intensive agriculture and rising urbanization. Domestic and industrial effluents contain various organic and inorganic contaminants that are discharged into the environment and pollute it 1. To prevent the shortage of clean water in water-stressed nations, the reuse and treatment of municipal and rural effluents, for industrial and agricultural purposes, can be the best solution 2. Over 7 x 10⁵ tons of dyes and pigments are produced every year, and 10 to 15% of them are discharged into the effluents, causing several problems to aquatic life. As worldwide environmental regulations tighten, several methods for removing such dyes have been developed, which are low-cost and high-efficient for treating polluted wastewater 3. Dyes stability against chemical oxidation methods hinders their removal by traditional biochemical and physicochemical processes 4. Also, some conventional treatment procedures for wastewater, such as filtration and chemical oxidation, have disadvantages such as their high cost, use of chemical reagents, production of harmful secondary pollutants, and being time-consuming 5. Due to the above-mentioned reasons, researchers have been looking for more cost-effective purification methods that have high efficiency in the treatment of colored effluents. PC oxidation process, based on semiconductors such as TiO2, is a low-cost, clean and environmentally friendly method that has attracted the attention of researchers 6,7. It has shown high efficiency for the photo-mineralization of a wide range of organic and dyes pollutants, without hazardous byproducts (H20 and CO2). The three TiO2 crystalline polymorphs are Ant, Rt and Brk, which have unique chemical and physical characteristics that make them suitable for various applications. Different methods, such as SG 8,9, solvothermal 10,11 and hydrothermal 12 techniques, CVD 13, MWs 14-17 and ultrasounds 18-20, have been reported for TiO2 NS synthesis, which can control their structural, textural and morphological properties. When the source of organometallic precursors reacts with water, hydrolysis and condensation processes occur simultaneously. Several experimental parameters, such as amounts of raw materials, hydrolysis temperature, stirring conditions and type of organic solvent, affect these two processes 21. MW-based synthesis method is one of the most low-cost, simple, energy-saving and time-efficient approaches for of TiO2 NS preparation, which results in better yields with a shorter reaction time 22,23. The electromagnetic spectrum MW region is located between infrared and radio waves. The materials interaction with the electromagnetic radiation electric field causes the movement of ions and molecular dipoles, which explains liquids heating by MW. Molecules with µ attempt to align with the produced field, causing rotation and movement. This movement generates kinetic energy that is then transformed into thermal energy and, hence, heat. MW-assisted synthesis has been effectively used for developing a wide variety of inorganic and organic molecules, complexes and NP, as well as industrial processes 23. Liquids with high molecular dipoles, such as H2O and ETG, have shown an increase in temperature caused by MW irradiation 24. H2O is known to absorb a large amount of MW radiation, due to its polar properties. MW effect on H2O occurs through its dielectric interaction (dipole induced) with the electric field, which produces thermal energy. ETG is also largely used, due to its high reducing power, BP and δ (197 ºC and 1.350 against 100 ºC and 0.123 for water, respectively) 23.
Most published articles studied the effect of preparation parameters, such as MW power 15, irradiation time 25,26 and use of a pure solvent, on TiO2 morphology and phase 16. In the present study, so as to investigate TiO2 physicochemical properties and PC efficiency, SG and MW-assisted approaches were used for its NS synthesis. ETG and distilled H2O were used as solvents, in different proportions, for studying their effect on the morphology of NP synthesized by SG and MW-assisted approaches. PC activity and the transformation of electromagnetic energy into heat are the functions of solvents ratio. The obtained samples were characterized by XRD, EDX/SEM, Raman, FTIR, DLS, N2 physisorption and UV/visible DRS techniques. PC activity of the NP was studied by E131 VF degradation.
Experimental section
Materials and synthesis details
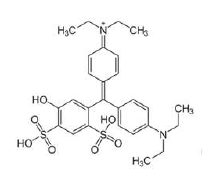
TTIP (98%) and pure ETG were purchased from Acros Organics. E131 VF, which was selected as an organic pollutant model, was purchased from Sigma Aldrich (C27H31N2O6S2-Na; purity: 50%; molecular weight: 565.67 g). Fig. 1 shows the dye structure. The MW reactor used for TiO2 synthesis was WBFY-201 Microwave Chemical Reactor, designed by Zhengzhou Keda Machinery and Instrument Equipment Co., Ltd.
TiO 2 preparation via MW-R method
TiO2 NP were prepared by a modified assisted MW-irradiation synthesis method (16). A fixed volume of TTIP (10 mL) and various ratios of distilled H2O/ETG, as a solvent mixture (0 < H2O/ETG < 100%), were used. TTIP was added to the solvent mixture and stirred for 40 min. Milky-turbid solutions were obtained with an increasing number of particulates, at higher ETG percentages. The mixture was then put for 10 min in a domestic MW reactor (400 W (2.45 GHz)), for inducing TiO2 formation, and a reflux apparatus was used during irradiation. The sample was separated, washed several times with H2O and ethanol, and the pale-yellow precipitate was collected. After drying the samples at 200 ºC, for 2 h, their color changed from yellow to orange. Then, the samples were calcined, at 500 ºC, for 4 h, in air, and their color changed to gray. The prepared TiO2 samples were named x% ETG MW-R. Some difficulties, such as overheating, prevented the authors of the present study from preparing 100 % ETG MW-R.
TiO 2 preparation via SG method
TiO2 NP were synthesized by the SG method reported in 27, with some modifications. A mixture of 10 mL TTIP and 100 mL H2O was stirred for 30 min, at room temperature, and, then, for 4 h, at 65 ºC, so as to form a white gel. The gel was dried at 200 ºC, for 2 h, and a very light-yellow precipitate was obtained. This sample was calcined at 500 ºC, for 4 h, and its color changed to bright white. The sample named 100% H2O SG was prepared by adding 10 mL TTIP to 100 mL ETG (after calcination, it became light gray).
PC tests
E 131 VF degradation rate was followed by measuring its A at λmax of 640 nm. PC degradation curves were plotted as A (in AU) vs. time (in min), for calculating the RC from the nonlinear kinetic model. A suspension containing 0.08 g TiO2 and a 100 mL E 131 VF aqueous solution (20 mg/L) was stirred in the dark, for 30 min, in order to reach A-D equilibrium. Then, the sample was placed in the photo reactor, irradiated by three UV-C lamps (λmax= 256 nm, 8 W) and placed 10 cm above a glass bowl (Luzchem LZC-4V, Canada), under continuous magnetic stirring. The PC reactor was equipped with a fan, for keeping the temperature at 28 ºC, and eliminating the heat from the lamps. Irradiation tests were done separately by one of three types of lamps: UV-C, UV-A (λmax= 360 nm, 8 W) and visible light lamps (8 W).
Characterization
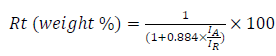
The machine used for XRD scans was a D8 advance diffractometer, from Bruker AXS systems. The X-ray source consisted of a Cu tube emitting X-rays of Kα radiation, with the λ of 1.5418 Å. Rt phase percentage was obtained by
 ***
***
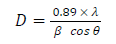
where IA and IR are the diffraction intensity of Ant and Rt phases, respectively 27. TiO2 mean crystal size was determined by Scherer equation.
 ***
***
where D is the average crystallite size, λ is the x-ray wavelength (0.1541 nm), β represents the FWHM diffraction, in radian, for a peak at 2θ = 25.4°. The samples FTIR spectra, using a KBr pellet, were recorded on a Jasco FT/IR-6300 spectrometer, in the wavenumber range from 400 to 4000 cm-1. Raman spectra were recorded by a Horiba Scientific spectrometer, operated by a green laser, at 532 nm. SEM images were prepared using a MIRA 3 series. Images were taken at several resolution values, in order to obtain a full observation of the surface morphology. An EDX spectrometer detector, attached to SEM, was used to obtain micro-chemical information. UV/visible diffuse reflectance spectra were obtained using a Jasco V-570 spectrophotometer, in order to calculate PC EG. The prepared samples surface area was determined via a fully automated three-station micromeritics 3Flex surface characterization analyzer, using N2 gas. TiO2 particles where degassed and activated at 180 ºC, overnight, before BET measurements. A NanoPlus Zeta Potential and a NP analyzer were used to perform DLS measurements. The suspension was prepared with 0.1 mg of each sample in 3 mL DMSO.
Results and discussion
XDR analysis
XRD patterns of TiO2 samples synthesized by MW-assisted approaches are shown in Fig. 2a.
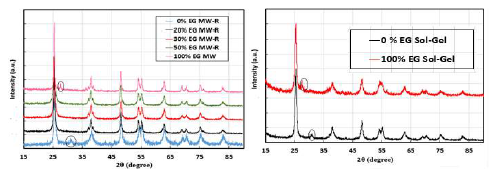
Several major diffractions were observable at 2θ (25.4, 37.8, 48.1, 54, 55.2 and 62.7°), which correspond to the Ant phase reflection 27,28. For the 100% ETG MW sample, it occurred a diffraction, at 2θ, of 27.56°, which indicates that Rt phase was also present. In 0% ETG MW-R sample XRD pattern, the diffraction, at 2θ, of 30.8°, was assigned to Brk phase. XRD of the samples prepared by SG technique were not as sharp as those of MW method. The sample prepared with H2O showed Ant and Brk phases, and the sample prepared by ETG presented Ant and Rt phases (Fig. 2b). Brk phase appearance was probably a critical factor for the inhibition of Ant transformation into Rt, in the samples that were prepared just with pure H2O.
Rt phase was calculated according to equation 1 (at 2θ of 25.4° (IA) and 27.3° (IR)). 9.3 and 20% Rt were obtained for 100% ETG MW and 100% ETG SG samples, respectively (Table 1). The samples prepared by MW-R did not contain Rt phase, except for the sample with 10% ETG (6.3%). Also, TiO2 crystallites NP average dimensions were estimated by Scherer equation, and are presented in Table 1.
Table 1 Samples average crystal size dimension and Rt phase (%).
| Sample | Rt phase % | Crystalline size (nm) |
| 0% ETG MW-R | - | 19.5 |
| 10% ETG MW-R | 6.3% | 25.1 |
| 20% ETG MW-R | - | 21.2 |
| 30% ETG MW-R | - | 19.2 |
| 50% ETG MW-R | - | 16.5 |
| 100% ETG MW | 9.3% | 15.1 |
| 0% ETG SG | - | 15.7 |
| 100% ETG SG | 20% | 15.1 |
The obtained data show that they decreased with an increase in ETG%. Also, TiO2 NP samples prepared by SG had a smaller average size than that of the others.
FTIR spectroscopy analysis
The FTIR spectra of the samples prepared by MW-R method, with different ETG percentages, are displayed in Fig. 3a.
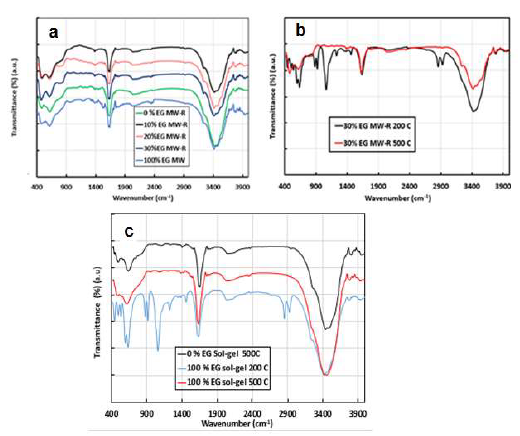
Figure 3 FTIR spectra of TiO2 samples prepared by: (a) MW-R; (b) MW-R with 30% ETG at 200 ºC, and calcined at 500 ºC; (c) SG method, at 200º C, and calcined at 500 ºC.
The spectra show three distinct vibrations, at 3420, 1620 and 620 cm-1. Vibrations at 3420 and 1620 cm-1 are O-H stretching and O-H bending, respectively. They are due to physically adsorbed water molecules from the atmosphere, or to ETG molecules 29. Hydroxyl groups are necessary for the PC degradation process. They react with photo-induced holes, and produce hydroxyl radicals that are strong oxidants 21. Vibrations at 476 and 620 cm-1 are due to TiO2 lattice Ti-O and Ti-O-Ti bonds (known as fingerprints) 30. FTIR spectra of 0 % ETG and 100 % ETG prepared by SG showed similar spectra to those prepared by MW-R (Fig. 3c). The absence of ETG vibrations, which are the alkane C-H stretching at 2900 cm-1, the C-H scissor and bending at 1450-1292 cm-1 and the alcohol C-O stretching at 1250 cm-1, confirms the elimination of a large amount of the former, during the samples calcination, or the remaining of it and of some combustion products in the samples pores (not detectable by FTIR) (Figs. 3b and 3c) 31,32.
Raman spectroscopy analysis
x% ETG MW-R samples Raman spectra consist of six vibrations located at 144, 200, 399, 513, 519 and 639 cm-1 (Fig. 4a), which confirm the formation of Ant phase for TiO233,34.
The vibrations at 144, 200 and 639 cm-1 can be assigned to symmetric stretching vibrations of the O-Ti-O bond (Eg mode). The peak at 513 cm-1 (A1g mode) can be attributed to Ant phase O-Ti-O anti-symmetric bending vibration. The magnified Raman spectrum of the 0% ETG MW-R sample (Fig. 4b) shows Brk phase that is characterized by several vibrations in the range from 210 to 330 cm-1, in addition to Ant phase 35.
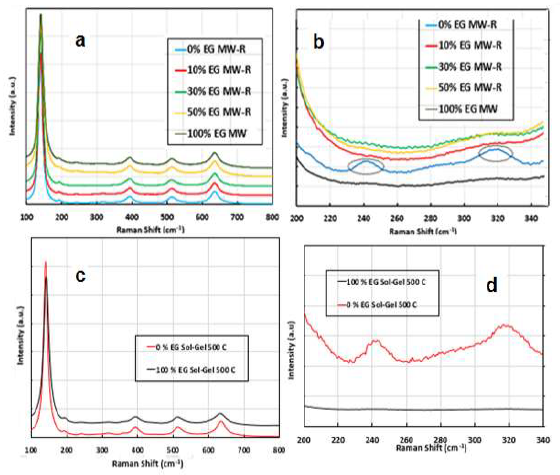
Similar bands were observed with 0 % ETG prepared by SG (Fig. 4d). In the same conditions, the preparation method did not affect TiO2 phase(s). Rt phase was not detected by Raman technique (nor by XRD) in the samples prepared with ETG. This might be due to the LOD of each technique.
SEM/EDX analysis
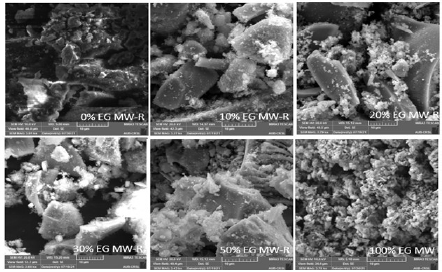
SEM images of the TiO2 prepared samples (Fig. 5) reveal that NP have smooth, irregular shapes and different agglomerate sizes.
UV/vis DRS analysis
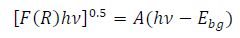
The reflectance spectra were converted to K-M diagrams, using the K-M relation, to calculate the samples EG (Table 2).
 ***
***
where A is a constant, F(R) is K-M function, hυ is photon energy and Ebg refers to EG. EG of the TiO2 samples prepared with pure distilled H2O (MW-R or SG) was very close to the Ant reported value (3.10 to 3.20 eV) 27,36. TiO2 Ant and Rt phase EG were 3.20 and 3.00 eV, respectively.
Table 2 Chemical composition of the prepared samples (Atomic percent: At%)
| Sample | C (At %) | O (At %) | Ti (At %) | Ti/O ratio |
| 10% EG MW-R | 3.41 | 71.43 | 29.23 | 0.41 |
| 20% EG MW-R | 1.84 | 70.06 | 28.10 | 0.40 |
| 30% EG MW-R | 2.85 | 64.76 | 32.39 | 0.50 |
| 50% EG MW-R | 2.56 | 66.12 | 31.32 | 0.47 |
| 100% EG MW | 3.09 | 68.54 | 35.89 | 0.52 |
| 0% EG Sol-Gel | 3.49 | 70.50 | 26.10 | 0.37 |
| 100% EG Sol-Gel | 3.32 | 70.79 | 25.68 | 0.36 |
The samples EG shifted to lower values with higher Rt percentages (Table 3).
Table 3 Samples EG and Rt phase percentage.
| Sample | Rt phase % | E G (eV) |
| 0% ETG MW-R | - | 3.10 |
| 10% ETG MW-R | 6.3% | 2.97 |
| 20% ETG MW-R | - | 3.10 |
| 30% ETG MW-R | - | 3.10 |
| 50% ETG MW-R | - | 3.07 |
| 100% ETG MW | 9.3% | 2.80 |
| 0% ETG SG | - | 3.20 |
| 100% ETG SG | 20% | 2.94 |
DLS analysis
DLS particle size distribution shows a skewed Gaussian shape (Fig. 6).
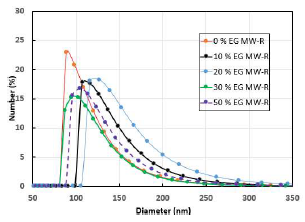
The mean diameter of the samples prepared by the MW-R method is higher than that of P25 (~110 nm) 37. D50, or mean size of the samples, is high, due to agglomeration 38. The 0% ETG MW-R sample has the lowest D50 (and mean) and the narrower distribution (PI: 0.64), whereas 20 % ETG MW-R sample has the highest mean and PI (1.5), so there was no correlation between ETG percentage in the mixture (ETG-H2O) and the samples mean size (Table 4).
Table 4 Characteristic parameters of the samples DLS analysis (PI).
| Sample | PI | D10 (nm) | D50 (mean) (nm) | D90 (nm) |
| 0 % ETG MW-R | 0.64 | 84 | 102 (117) | 149 |
| 10% ETG MW-R | 0.90 | 103 | 125 (148) | 181 |
| 20% ETG MW-R | 1.50 | 111 | 137 (157) | 201 |
| 30% ETG MW-R | 0.84 | 86 | 107 (120) | 154 |
| 50% ETG MW-R | 1.02 | 93 | 115 (129) | 169 |
| 100% ETG MW | 3.38 | 96 | 118 (131) | 162 |
| 0% ETG SG | 1.78 | 81 | 100 (117) | 142 |
| 100% ETG SG | 0.92 | 100 | 121 (136) | 170 |
BET analysis
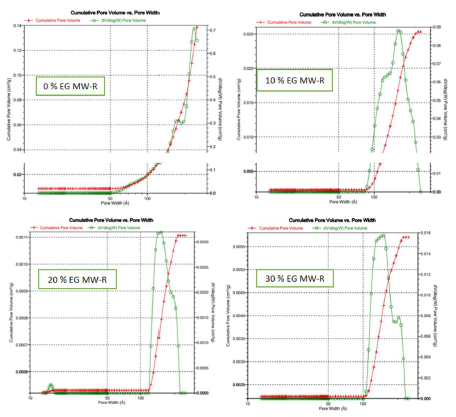
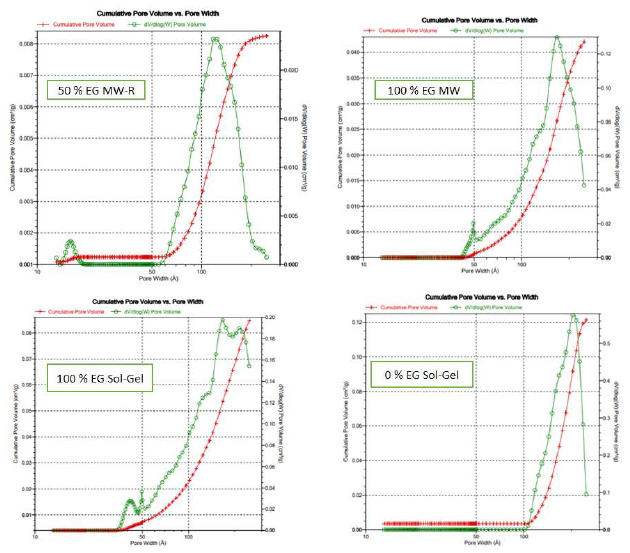
MW-R samples surface area and pore volume significantly decreased with higher ETG percentages (Table 5).
Table 5 Textural properties of the prepared samples.
| Sample | Pore volume (cm3/g) | Average pore diameter (Å) | Pore area (m2/g) | Surface area (m2/g) |
| 0% ETG MW R | 1.590 | 165.72 | 503.1 | 56.94 |
| 10% ETG MW R | 0.019 | 31.53 | 24.2 | 14.12 |
| 20% ETG MW R | 0.021 | 34.67 | 24.6 | 1.78 |
| 30% ETG MW R | 0.078 | 36.70 | 85.6 | 8.20 |
| 50% ETG MW R | 0.094 | 58.20 | 107.7 | 5.97 |
| 100 % ETG MW | 0.156 | 134.41 | 203.2 | 13.27 |
| 100% ETG SG | 0.304 | 118.58 | 115.3 | 37.07 |
| 0% ETG SG | 0.948 | 128.67 | 389.1 | 46.74 |
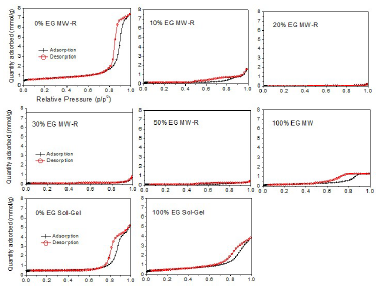
This may be due to NP aggregations caused be the increase in ETG%. ETG did not disappear totally after two consecutive calcinations, and TiO2 color was gray. ETG or some products residues during the samples calcination decreased the pores volume and area. The samples synthesized without ETG showed higher surface area and pore volume than those of other samples, regardless of the synthesis method (SG or MW-R) (Table 5). These samples also showed that TTIP is related to mesoporous materials (Fig. 7).
The samples pores volume distribution is presented in Figs. 8 and 9.
E131 VF kinetic photodegradation
The kinetic experiments were performed under different conditions. For the samples photolysis and adsorption tests, the decrease in A value at λmax (640 nm) was less than 10%. Therefore, both photolysis and adsorption phenomena were neglected. In UV-C irradiation and PC presence, 94% dye degradation was obtained, within the same duration. The degradation efficiency was calculated by Equation 4.
 ***
***
Fig. 10a displays E131 VF PC degradation in the presence of x% ETG MW-R samples. The dye degradation followed the first-order kinetics that can be represented by: C = Coe-kt (or A = Ao e-kt), where C and C0 are concentration and initial concentration, t is time, A and Ao are absorbance and k is the RC. PC tests were repeated three times, and the average RC obtained by MW-R samples was calculated from the nonlinear kinetic curves in Fig. 10a. Fig. 10c shows RC variation during the photo degradation tests. A decreasing trend in the RC, along with the increase in ETG percentage, were observed. This it is most probably due to the screening effect of residual ETG (undetectable by FTIR), which prevented the catalyst from absorbing UV radiation, or to ETG or some combustion products that blocked TiO2 pores. The sample prepared by pure H2O has shown better PC activity than that of those synthesized by the mixture of ETG and H2O, due to higher surface area and Rt phase absence. Also, the samples prepared by SG (Fig. 10b) have higher photo activity than those prepared by MW-R (Table 6).
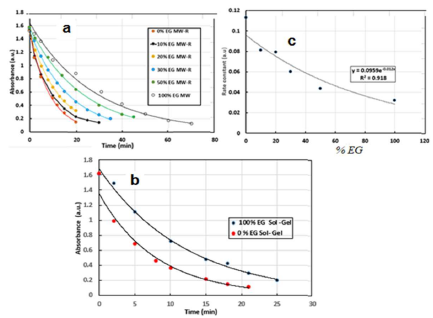
Figure 10 (a) and (b): curves of E131 VF photo degradation by TiO2 NP; (c) RC variation as a function of ETG percentage for MW-R samples.
The difference in the photo activity between the two samples prepared with ETG (gray color of 100 % ETG MW-R and white color of 100 % ETG SG) was due to ETG total elimination in the SG sample, and to a higher surface area. The 0% ETG SG sample showed higher photo activity than that of 100 % ETG SG, because of Rt phase absence, and higher surface area (Table 6). TiO2 PC activity remained approxim. constant under UV and UV-C, but, under visible light, no degradation occurred.
Table 6 Samples RC, surface area and Rt phase percentage.
| Sample | RC (AU) | Surface area (m 2 /g) | Rt % |
| 0% ETG MW-R | 0.113 | 56.94 | - |
| 10% ETG MW-R | 0.081 | 14.12 | 6.3% |
| 20% ETG MW-R | 0.075 | 1.78 | - |
| 30% ETG-R | 0.060 | 8.20 | - |
| 50% ETG MW-R | 0.044 | 5.97 | - |
| 100% ETG MW | 0.032 | 13.27 | 9.3% |
| 100% ETG SG | 0.080 | 37.07 | 20% |
| 0% ETG SG | 0.130 | 46.74 | - |
Conclusion
TiO2 NP were prepared by MW-R and conventional SG methods, using H2O and ETG as solvent mixture, with different proportions (0 < H2O/ETG < 100%). XRD and Raman results confirmed that the obtained dominant crystal phase was Ant, in addition to traces of Brk or Rt phases that appeared in some samples. EG calculations using K-M curves showed that they decreased by increasing Rt phase percentage. The high PC activity in E131 VF degradation occurred in 0% ETG SG and 0% ETG MW-R samples, due to higher surface area, and Rt phase absence. Kinetic evaluations showed that, as ETG percentage increased, NP PC performance decreased. This was due to the screen effect and blockage of the pores by ETG molecules, or by some combustion products that were produced during the samples calcination.
Acknowledgements
The author thanks the Lebanese University for providing financial assistance to carry out this work, and the American University of Beirut (AUB) for the help in doing the analysis in the KAS, CRSL laboratory.
Authors’ contributions
F. Kassir: collected the data; did the preparation of the catalyst and the kinetic study and XRD and FTIR analysis (Master 2 student). M. Azoury: collected the data; did the preparation of the catalyst and the kinetic study and the Raman experiment (Master 2 student). Z. Harajli: collected the data; did the SEM and the UV reflection study DRS at AUB. P. Damacet: collected the data; did the BET and the DLS analysis at AUB. M. El Jamal: designed the analysis and selected the parameters for study; did the paper writing and editing. Ebrahimian Pirbazari: did the paper writing and editing.
Abbreviations
A: absorbance
Ant: anatase
AU: arbitrary unit
BET: Brunauer-Emmett-Teller
BP: boiling point
Brk: brookite
CVD: chemical vapor deposition
D: desorption
DLS: dynamic light scattering
DMSO: dimethyl sulfoxide
DRS: differential reflectance spectroscopy
E131 VF: food dye
EDX: energy dispersive X-ray spectrometer
EG: bandgap energy
ETG: ethylene glycol
FTIR: Fourier-transform infrared spectroscopy
FWHM: full width at half maximum
KBr: potassium bromide
K-M: Kubelka-Munk
LOD: limit of detection
MW: microwave
MW-R: microwave-assisted reflux
NP: nanoparticles
NS: nanostructures
PC: photocatalytic
PI: polydispersity index
RC: rate constant
Rt: rutile
SEM: scanning electron microscopy
SG: sol-gel
TiO2: titanium dioxide
TTIP: titanium IV isopropoxide
XRD: X-ray diffraction
Symbols definition

