


 Inglés (pdf)
 Articulo en XML
 Referencias del artículo
 Enviar articulo por email
 Citado por SciELO
  Similares en
SciELO
Similares en
SciELO 
 Permalink
Introduction
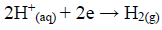
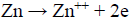
Zn is one of the most important non-ferrous metals, which is extensively used in metallic coatings. Since Zn has a sufficiently negative standard electrode E, it is highly reactive and acts as a sacrificial anode for cathodic protection 1. Despite its highly negative electrode E, a protective layer, either of ZnO or Zn(OH)2), forms on the Zn surface, in near-neutral aqueous solutions, under normal atmospheric conditions, which prevents it from further reactions. This layer provides a better corrosion resistance for Zn, which is why this metal is used as a galvanizing element for Fe and steel. In marine environments, Zn corrosion is influenced by the environment salt content. Several studies concerning the action of organic compounds on the Zn corrosion behavior in alkaline solutions have been made. Zn corrosion proceeds through two partial reactions. The partial cathodic reaction involves HER and Zn oxidation and soluble formation:
 ***
***
 ***
***
Several techniques, chemical and electrochemical methods, have been used to study metals corrosion in various aggressive media 2-7. The use of corrosion inhibitors is one of the effective measures for protecting metals surfaces against dissolution. From the review of previous works, there is the need to examine Zn corrosion inhibition in alkaline media, using plant-based inhibitors such as MLE. Mango is an edible juicy stone fruit. It belongs to the flowering plant family Anacardiaceae. Though many of its species are found in nature as wild plants, mango is cultivated in many tropical and subtropical regions. Different parts of the mango tree are used for medical purposes 8,9. The aim of this study was to study Zn corrosion inhibitor in a NaOH medium using MLE.
Materials and methods
All the chemicals used in this experiment were of analytical grade. 1.0 M NaOH was used as the corrosive medium. Zn (98%), with the composition of Si (0.35%), Fe (0.28%), Cu (0.04%), Al (0.27%), Cr (0.33%), Ti (0.13%) and Sn (0.4%), was mechanically cut into coupons (5 x 4 cm), and used for the corrosion inhibition study. The extraction method used by 10 was adopted for obtaining MLE. Methods used by 11,12 were adopted for the MLE Pc analysis.
Thermometric method of study
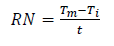
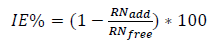
In the thermometric method of study, Zn samples were immersed in beakers containing NaOH media with and without inhibitor. The beakers were placed in a thermostat set at 30 ºC. The corrosion reaction progress was monitored, and the T values of the system with the Zn sample and the test solution were regularly recorded, until a steady T was obtained. Equations (3) and (4) were used for the reaction number and IE(%) determination 10,13,14.
 (3)
(3)
where Tm and Ti are the maximum and initial T (in ºC), respectively, and t is the time in minutes elapsed to reach Tm.
 (4)
(4)
where RNfree and RNadd are RN (in ºC/min) for Zn dissolution in NaOH media without and with inhibitor, respectively.
Gravimetric method of study
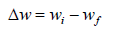
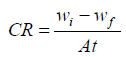
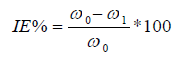
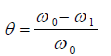
The gravimetric method of study was carried out using one factor at a time, and RSM. Thermodynamic parameters of Ea, Qads and G of the corrosion inhibition process were determined. CCD of DES was employed in RSM. WL, CR, IE(%) and ( were calculated using standard equations (5), (6), (7) and (8), respectively 10.
 ***
***
 ***
***
 ***
***
 ***
***
where wi (g) and wf (g) are the initial and final weight of the Zn samples, respectively, (1 (g) and (0 (g) are WL values with and without MLE, respectively, A (cm2) is the total area of the Zn sample and t (h) is IT.
Linearized Arrhenius model of equation (9) was used to determine Ea (kJ/mol-1), while equation (10) was employed to evaluate Qads (kJ/mol-1) 15-18.
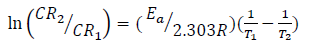 ***
***
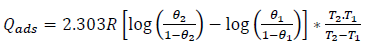 ***
***
where Zn CR, at T1 and T2, are CR1 and CR2, R is the universal gas constant (kJ/kmol/K), and θ1 and θ2 are θ, at T T1 and T2, respectively.
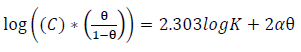
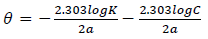
The data obtained for θ were fitted into Langmuir’s, Frumkin’s, Temkin’s and Flory-Huggins’s adsorption isotherms, which are expressed in Equations (11), (12), (13) and (14), respectively 10,17,19-21.
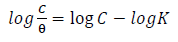 ()
()
 ***
***
 ***
***
 ***
***
where α is the lateral interaction term describing the interaction in the adsorbed layer and a is the attractive parameter.
Results and discussion
MLE Pc
In Table 1, MLE quantitative analysis shows that alkaloids, cardiac glycosides, flavonoids, phenolics, phytates, saponins and tannins Pc are present in the inhibitor at various degrees. MLE Pc qualitative results are denoted with the symbols: +++ (highly concentrated); ++ (concentrated); + (in traces); and - (absent or too low to be qualitatively observed). The difference in the results may be attributed to MLE biochemical variations 22. MLE is predominantly made up of flavonoids, alkaloids and tannins (471.7, 458.3 and 115.0 mg/100 g, respectively).
Thermodynamic measurements
Thermodynamic measurements results are presented in Table 2. Higher C increased MLE IE(%). Highest IE(%) of 84.25% was obtained at 1.0 g/L. This indicates that MLE is a suitable inhibitor for Zn corrosion inhibition in a NaOH medium.
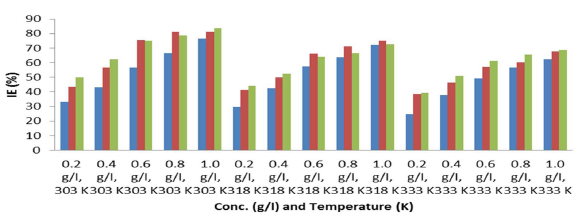
Gravimetric results
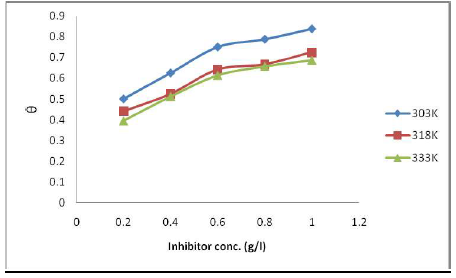
Gravimetric method results are shown in Fig. 1. IE(%) increased with higher MLE C, but decreased with a rise in T. Also, ( increased with higher inhibitor C, but decreased with a rise in T (Fig. 2).
Ea and Qads for Zn corrosion inhibition in NaOH with MLE are shown in Table 3. Ea increased with higher C. Ea was lower than the threshold value of 80 kJ/mol required for chemisorption. Qads negative sign showed that the inhibitive process was an exothermic reaction.
Table 3 Ea and Qads for Zn corrosion inhibition.
| MLE conc. (g/L) | Ea (kJ/mol) | Qads (kJ/mol) |
|---|---|---|
| 0.2 | 47.008 | -5.102 |
| 0.4 | 51.743 | -4.302 |
| 0.6 | 62.759 | -10.091 |
| 0.8 | 65.488 | -21.496 |
| 1.0 | 77.036 | -23.210 |
Table 4 shows that Zn WL and CR and MLE IE(%) were dependent from C, T and time. IE(%) increased with higher MLE C. MLE IE(%) analysis is presented in Fig. 3.
Table 4 RSM result of Zn corrosion inhibition by MLE in NaOH.
| SD | RNn | MLE C (g/L) | T (K) | t (h) | WL (g) | CR (mg/cm2h) | IE (%) |
|---|---|---|---|---|---|---|---|
| 14 | 1 | 0.6 | 318 | 5 | 0.043 | 0.430 | 64.17 |
| 20 | 2 | 0.6 | 318 | 3 | 0.027 | 0.450 | 66.25 |
| 13 | 3 | 0.6 | 318 | 1 | 0.020 | 1.000 | 57.45 |
| 7 | 4 | 0.2 | 333 | 5 | 0.083 | 0.830 | 39.42 |
| 12 | 5 | 0.6 | 333 | 3 | 0.040 | 0.667 | 56.99 |
| 8 | 6 | 1.0 | 333 | 5 | 0.043 | 0.430 | 68.61 |
| 5 | 7 | 0.2 | 303 | 5 | 0.040 | 0.400 | 50.00 |
| 18 | 8 | 0.6 | 318 | 3 | 0.027 | 0.450 | 66.25 |
| 3 | 9 | 0.2 | 333 | 1 | 0.040 | 2.000 | 24.53 |
| 9 | 10 | 0.2 | 318 | 3 | 0.047 | 0.783 | 41.25 |
| 1 | 11 | 0.2 | 303 | 1 | 0.020 | 1.000 | 33.33 |
| 15 | 12 | 0.6 | 318 | 3 | 0.027 | 0.450 | 66.25 |
| 6 | 13 | 1.0 | 303 | 5 | 0.013 | 0.130 | 83.75 |
| 4 | 14 | 1.0 | 333 | 1 | 0.020 | 1.000 | 62.26 |
| 11 | 15 | 0.6 | 303 | 3 | 0.020 | 0.333 | 62.26 |
| 17 | 16 | 0.6 | 318 | 3 | 0.027 | 0.450 | 66.25 |
| 16 | 17 | 0.6 | 318 | 3 | 0.027 | 0.450 | 66.25 |
| 2 | 18 | 1.0 | 303 | 1 | 0.007 | 0.350 | 76.67 |
| 10 | 19 | 1.0 | 318 | 3 | 0.023 | 0.383 | 71.25 |
| 19 | 20 | 0.6 | 318 | 3 | 0.027 | 0.450 | 66.25 |
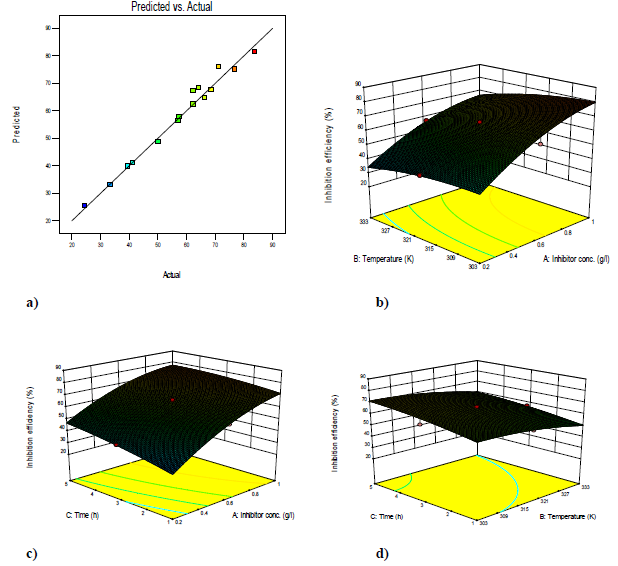
The plot of predicted versus actual IE(%) was used to test the significance of the model. The predicted vs. actual plot gave a linear graph. The graph (3-D surface plot) showed the relationship between the factors and the designed experiment response. It showed that IE(%) increased with higher C, but decreased with a rise in T. The mathematical expression describing the relationship between IE(%) and C, T and t factors is represented by equation (15). IE(%) is a function of the inhibitor C (g/L), T (K) and t (h). The highest power of, at least, one of the variables was 2, which showed that the model is a quadratic one. The model for Zn corrosion inhibition by MLE in NaOH is:
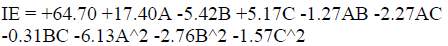 ***
***
Conclusion
MLE is predominantly made up of flavonoids, alkaloids and tannins (471.7, 458.3 and 115.0 mg/100 g, respectively). Zn ( by MLE increased with the inhibitor higher C, but decreased with a rise in T. A quadratic model adequately described the relationship between IE(%), C, T and t factors. High IE(%) of 83.75% was obtained at MLE C of 1.0 g/L, T of 303 K and IT of 5 h. MLE is a suitable inhibitor for Zn corrosion in a NaOH medium.
Author’s contributions
M. Omotioma: conceived and designed the analysis; collected the data; contributed with data or analysis tools; performed the analysis; wrote the paper. O. D. Onukwuli: contributed with data or analysis tools; performed the analysis; wrote the paper. C. O. Nevo: wrote the paper.
Abbreviations
C: concentration
CCD: central composite design
CR: corrosion rate
DES: design expert software
E: potential
Ea: activation energy
G: free Gibbs energy
HER: hydrogen evolution reaction
IE(%): inhibition efficiency
IT: immersion time
K: adsorption equilibrium constant
MLE: mango leaf extract
NaOH: sodium hydroxide
Pc: phytochemical
Qads: heat of adsorption
RN: reaction numbers
RSM: response surface methodology
SD: standard deviation
T: temperature
WL: weight loss
ZnO: zinc oxide
Zn(OH)2: zinc hydroxide

