


 Inglés (pdf)
 Articulo en XML
 Referencias del artículo
 Enviar articulo por email
 Citado por SciELO
  Similares en
SciELO
Similares en
SciELO 
 Permalink
Introduction
Cu ED obtained from acidic solutions is perhaps one of the best researched processes in electroplating, due to its tremendous technological importance and wide applications; a half century ago, in the automotive industry and, now, in semiconductors 1,2. It is known that bright Cu coatings cannot be obtained from simple acidic electrolytes, since the former are coarse-grained and powdery. For obtaining fine-grained coatings, organic additives are of prime importance. As a side effect of plating, these additives are destructed. It is assumed that these organic additives have a polarizing effect on Cu ED process. At the same time, they have an adsorption-desorption action, especially in the ED of micro- and nano-sized semiconducting products 1-4.
Numerous attempts have been made to avoid additives, especially in the case of thicker coatings, due to their incorporation (or parts thereof) into the Cu layer, which unfavorably alters some of its properties, for instance, increasing its hardness and worsening its ductility. Alloying with small metal amounts, in order to improve the coating brightness and reduce its grain size, is considered a successful option. For instance, a low percentage of Co or Ni provides brightness to Au plated layers 5, and 1-2% of Sb increase Ag brightness, hardness and wear resistance 6.
During Ag-Sb ED, the most vivid examples of self-organization have been observed 7-12. This self-organization is expressed by the formation and propagation of some periodic spatiotemporal structures, both on the coating surface and depth. Clear, highly visible lamellae made of layers with different compositions and properties have been reported 10,11. Sb CD within a certain range acts as a brightening agent on Ag ED 7. The hypothesis that the CD Sb may also act as a brightener in Cu deposition, similar to its action in the Ag-Sb alloy, was the focus of the present research.
In a previous work 13, a preliminary study of CD Cu and Sb from MSA electrolytes was presented. Moreover, it has been shown that CD Sb results in an increase in the layers internal stress, producing visible cracks 14. At certain electrolysis conditions, heterogeneous coatings are obtained, indicating the initial stages of the formation of periodic structures 13,14.
The present research had two goals: to find the electrolyte composition, as well as the electrolysis conditions under which the formation, observation and study of well-pronounced periodic structures on the electrode surface, during Cu-Sb alloy deposition, was possible; and to study the electrode processes arising during the alloy ED from MSA electrolytes, as well as the phase and morphological characteristics of the resulting coatings, depending on their composition.
Experimental
The electrolyte composition was: 40 g/L-1 Sb, as K(SbO)C4H4O6.0.5H2O; 4 g/L-1 Cu, as CuSO4·5H2O; 20 mL/L-1 MSA; and 90 g/L-1 KNaC4H4O6.4H2O. Chemical substances of pro analysis purity and distilled water were used to prepare the electrolyte.
The redox processes of the investigated electrolytes were characterized by the CV technique, at a SR (V) of 20 mV/s-1.
The experiments were carried out in a three-electrode glass cell with a volume of 100 mL, at room T, without stirring the electrolyte. Pt was used for one WE (1 cm2) and two CE (around 4 cm2). An Ag|AgCl electrode was used as RE, of which Eº with respect to the normal H electrode was 0.197 V. Eº in the presented figures (X axis) was scaled vs. Ag|AgCl. The experiments were performed with a Princeton Applied Research computer-controlled model 273A potentiostat-galvanostat, with the PowerSuite corrosion research program.
Prior to deposition, the brass substrates (CuZn37), with an area of 2 x 1 cm, were degreased and subsequently dipped into 20% H2SO4. The coatings were deposited into a 100 cm3 cell, at room T, under galvanostatic or potentiostat conditions, on CuZn37. The alloy coatings, with a thickness of about 1-10 μm, were deposited in the glass cell, at room T, without stirring. The alloy composition and ED rate, and the deposited coatings thickness were determined by X-RF analysis, with a Fischerscope X-RAY XDAL instrument, at 9 points (3 points each at the top, middle and bottom of the electrode). The results were taken as the average of the entire coating. Gravimetric measurements were also carried out. Sb or Cu distribution throughout the coatings surface was examined by EDS analysis.
The phase composition was characterized by X-RD, using a PANalyticalEmpyrean X-ray instrument equipped with a multichannel detector (Pixel 3D), with Cu-K𝛼 radiation at the parameters of 45 kV/40 mA, in a 2𝜃 range from 20 to 115⁰, with a scan step of 0.01⁰, for 20 s.
The coatings surface morphology and composition were investigated with a Carl Zeiss MERLIN microscope system, using different detectors (BSD4, HESE2, InLens and EsB), at various accelerating voltages, from 3 to 20 kV.
Cross-sections of the deposited coatings were examined by SEM, using a Tescan VEGA TS 5130 MM equipped with an EDS detector, INCAPentaFET-x3 (Oxford Instruments), for the chemical composition analysis.
Cu ions oxidation state was investigated by EPR spectra which were recorded as the first derivative of the absorption signal on a Bruker EMXplus spectrometer, within the T range from 90 to 400 K. The g-factor was determined in relation to the Mn2+/ZnS standard. The signal intensity was determined by double integration.
Results and discussion
Fig. 1 presents the ED processes in the alloy electrolyte prepared in a sequence where firstly CuSO4 was dissolved (curve 1), and then MSA (curve 2), KNaC4H4O6.4H2O (curve 3) and MSA salt, in the form of K2Sb2C8H4O123 H2O (curve 4), were added.
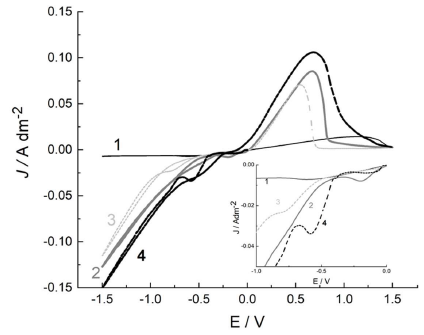
Figure 1 CV curves in the alloy electrolyte: CuSO4 electrolyte (curve 1); MSA (curve 2); KNaC4H4O6.4H2O (curve 3); and MSA salt in the form of K2Sb2C8H4O12 3 H2O (curve 4).
The initial Eº was 0 V, up to -1.5 and 1.5 V vs RE, respectively. Cu ions reduction from the aqueous solution proceeded at positive Eº (0.34 V) and, in accordance with the ions low C in the solution, at low dj (curve 1). The reduction process in the CuSO4 solution (Fig. 1, curve 1) reached the maximum rate at -0.65 V (dj of 8 mA/cm-2). At a more negative Eº, dj was 6 mA/cm-2.
In the anodic region, a broad peak with a maximum below 1.3 V was observed. MSA addition (curve 2) significantly accelerated the cathodic process rate, which is associated with an increase in the solution acidity and HER rate. The large anodic peak, with a maximum of about 0.5 V, can be related to the larger amount of Cu deposited during the cathodic period.
It is known that the throwing power of an electrolyte is defined as the product of the solution κ and of the η derivative over dη/dj (slope of the η-j curve) 15. Despite that the solution κ does not linearly depend on the acidic solution C, some reasonable approximation in the diluted electrolytes might be done. MSA addition increased the solution κ, and Cu ions low C strengthened the electrical resistivity. As a result, the electrolyte macro-throwing power increased.
MSA has been used as an environmentally friendly alternative to H2SO4, with the main advantage of the Cu salts being more soluble in the former 16.
Cu ions oxidation state in the MSA electrolyte can be monitored by EPR studies. EPR is a convenient and sensitive method to investigate Cu (II) compounds, due to their weak spin-orbit coupling and high sensitivity (local stereochemistry and molecular motion). Also, EPR data are absolute and comparable, and their main parameters, such as g-factor and hyperfine constant, are already well-recognized in the comments on Cu complexes 17. Fig. 2 shows Cu ions EPR spectra in an aqueous CuSO4 solution without and with MSA.
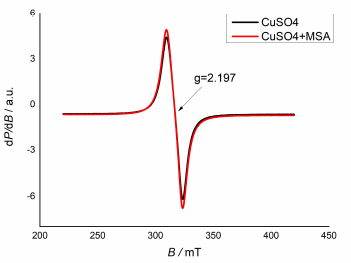
EPR spectra of both solutions show identical isotropic signals, with a giso of 2.197. This is an indication that MSA is not a complexing agent for Cu2+ cations. KNaC4H4O6.4H2O addition (Fig. 1, curve 3) did not lead to a significant change in the cyclic curve appearance, due to the weak C4H6O6 2- ions complexing action with respect to the Cu ones 18.
C4H6O6 2- ligands addition to Cu electrolytes for electroless deposition has been practiced, but the known data are related to the neutral and alkaline electrolytes. In an acidic medium, C4H6O6 2- (which is highly protonated and, therefore, has a decreased complexation efficiency) complexing action can be judged from the data obtained from the EPR spectra.
The investigated electrolyte molar ratio of Cu ions to those of C4H6O6 2- is 1:5. The chelates formed in 1:1 Cu-C4H6O6 solutions have been extensively investigated by EPR, in the range of pH 2 from 11. However, their structures remain unclear, due to the multi-dentate character of C4H6O6, which can participate in polymeric complexes, and to its several ionizable H atoms that make the complex formation very pH dependent 19.
A slight change in the g-factor, after C4H6O6 2- addition to the electrolyte, from 2.197 to 2.182, hints at the weak compound ions complexation with respect to Cu (Fig. 3). The results show a negligible change in the surrounding Cu ion, but this was important to exclude the formation of some polymeric adsorbates, which, in some cases, could be autocatalytic in the pattern formation process 12.
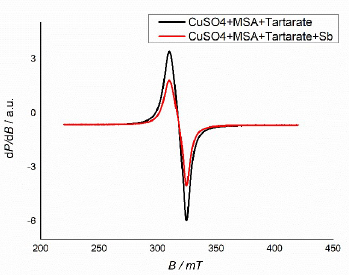
Figure 3 CuSO4 and MSA solutions EPR spectra, after C4H6O6 (black curve) and Sb (red curve) sequential addition.
CuSO4 and MSA solutions EPR spectra show an anisotropic signal, with a perpendicular and parallel component (giso = 2.182).
The addition of a Sb salt, such as K2Sb2C8H4O12·3 H2O, led to the appearance of a peak in the CV curve, with a maximum at -0.5 V, which corresponds to Sb deposition (Fig. 1, curve 4). The standard Sb electrode Eº of 0.212 V was clearly related to the C4H6O6 2- ions complex formation.
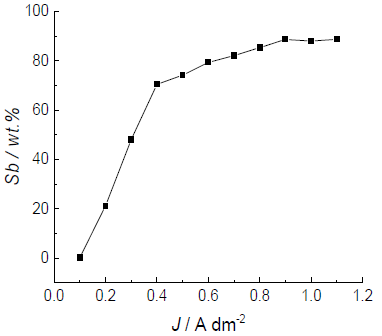
The coatings Sb content dependence on dj is shown in Fig. 4, where the alloy composition was determined by X-RF analysis (see experimental part).
At the lowest applied dj of 0.1 A/dm-2, pure Cu was deposited. It is obvious that the coating Sb content increased very sharply, even at very low dj values, and, at 0.4 A/dm-2, it reached 70 wt%. The deposition was performed within the same time (30 min). The cathodic efficiency of the process with the respective deposition rate was different: 0.05 µm/min-1 at 0.1 A/dm-2; and 0.3 µm/min-1 at 0.4/A dm-2.
This behavior seems to be logical, considering that Cu is the nobler metal, even in extremely small amounts in the electrolyte, meaning it was almost always deposited at the limiting dj, which, judging by the CV curve, should be in the order of 0.1-0.15 A/dm-2. However, a similar course of the curve was observed at another ratio of the two metals in the electrolyte, where the Sb content also steeply increased from 0.4 to 0.5 A/dm-2, which was further attributed to their very close deposition Eº in the investigated MSA-C4H6O6 -2 electrolytes 14. In all cases, the alloy deposition from MSA-C4H6O6 -2 electrolytes was regular, according to the classification made by Brenner 5.
The coatings obtained at low dj values, with Sb contents from 5 to 20 wt%, were bluish, bright and shiny. At a higher Sb content (with an average composition from 45 to 60 wt%), they were heterogeneous, with well-defined spatiotemporal structures on their surfaces. Obviously, this heterogeneity was due to Cu lattice saturation with Sb, at the formation of a solid solution, and to the transition into a spontaneous formation of a new more Sb-rich phase at higher dj values. According to the metallurgically derived Cu-Sb alloy phase diagram 20, the Cu crystal lattice saturates after reaching about 30 wt% Sb. So, the formation of phase heterogeneous coatings under these conditions is logical. The formation of spatiotemporal structures during the alloys ED fits into the process of non-linear dynamics, where the reaction-diffusion mechanism is coupled with some adsorbing effect (some autocatalytic steps).
Under certain conditions, the various Sb-rich phases on the electrode surface arranged themselves into periodic structures, such as waves, spirals and other shapes. Such cases of resulting heterogeneous coatings in the form of spiral formations are illustrated in Fig. 5.
Fig. 5 shows that Sb-rich areas are coarse grained and made up of big aggregates (up to 1 μm). Cu-rich areas have a much smoother morphology. It should be noted that the thickness of the formed complex during the different sublayers (Cu and Sb) ED was substantially smaller than the penetration depth of the electron beam during EDX analysis. As a result, the beam penetrated through several light and dark sublayers.
The comparison of the heterogeneities with the ones obtained by various other alloy systems (Ag-Sb 7-9, Ag-In, Ag-Cd, In-Co and Pd -In 21-28) ED allowed us to suggest that this is a similar system, in which the structures appeared early in the plating process, and, during it, they moved, annihilated and reappeared with increasing coating thicknesses.
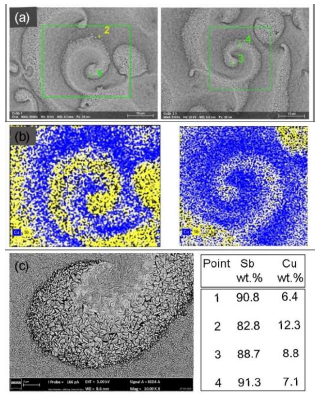
Figure 5 Heterogeneous coatings with spatiotemporal structures on the electrode surface: a) SEM image of the deposited coating at 0.4 A/dm-2; Sb average content of 85 wt% and thickness of 8 µm; b) elemental mapping of Cu and Sb locally enriched on the electrode surface; and c) typical morphology of Sb-richer areas, with large and triangular crystallites.
Fig. 6 presents the coatings phase composition as a dj function (Sb content in the coating).
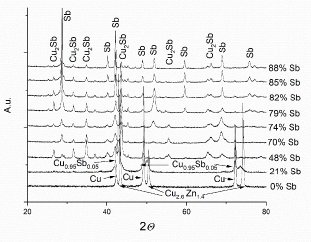
At Sb compositions up to 20 wt%, only the reflections of the Cu alpha (α) phase were observed, which is consistent with the phase diagram. The Cu2.6Zn1.4 phase recorded peaks were due to reflexes from CuZn37, on which the coatings were deposited. At 21 wt% Sb, Cu0.95Sb0.05 phase also appeared. At a higher Sb content, the reflexes of only two phases were observed, that of intermetallic Cu2Sb and of pure Sb.
The presence of heterogeneities on the coating surface leads to the logical question: was there any evidence of coating heterogeneity in its depth?
Fig. 7 shows a cross-section of an alloy coating with a thickness of about 9 µm, of which surface structures show Cu (red), Sb (green) and C (blue) spectra in a line through the coating depth.
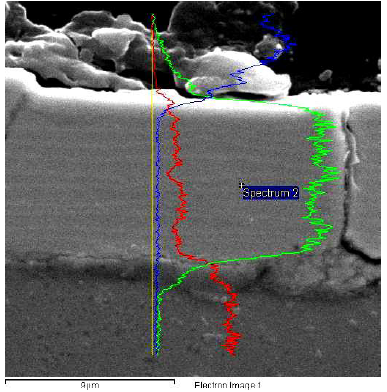
Figure 7 EDS line image of a cross-section of the Cu-Sb alloy coatings, with a thickness of 9 µm, onto CuZn37 (the sample presented in Figs. 5 and 6), which shows Cu (red), Sb (green) and C (blue) spectra.
The Cu line is of increased intensity in the resin area, in which the specimen is embedded. The signal low level indicates a probable small Cu incorporation into the K2CO3 coating in the electrolyte. Some very weak oscillations in Cu and Sb spectra were recorded, which may be related to the coating multi-layering, and to the small oscillations of the Sb contents in it. About ten sublayers were observed across the coating thickness. The darker sublayers are those with a richer Cu content, which are significantly thicker than the lighter ones that have a higher Sb content.
Such multilayered architecture has been seen in all coatings, where the Sb contents corresponded to more than 70 wt%. It should be noted that the same layer-by-layer morphology has also been observed during Ag ED with Sb and In, as well as of In with Co 10,11,26,27, in which the top surface was covered with spatiotemporal patterns.
This multi-layered architecture must be connected with some oscillations of the process. J oscillations were observed in Ag-Sb 10,11, but not in Ag-In 20 and In-Co 23,28,29 alloys ED. In Cu-Sb ED case, galvanostatic curves (E-t transient) show a single spike during the first 10 s of deposition, followed by the estimation of a constant Eº (Fig. 8).
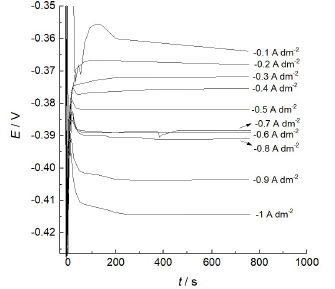
Figure 8 E-time transient recorded at the Cu-Sb alloy potentiostatic deposition from 0.1 A/dm-2 to 1 A/dm-2, with a step of 0.1 A/dm-2.
Visible oscillations could not be seen, and this is valid for dj-t transient (Fig. 9).
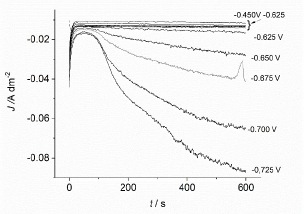
Figure 9 J-time transient recorded at the Cu-Sb alloy potentiostatic deposition from -0.475 to -0.725 mV, with 25 mV steps.
Some phenomenological explanation could be that, since Cu was deposited at a limited dj, at certain time, some Cu ions depletion happened at the double layer vicinity. A more intensive Sb ED was accompanied by an intensive HER. Due to the natural convection effect on the double layer vicinity, stirring occurred, and a new portion of the Cu ions started coming from the electrolyte bulk, restarting the Cu-reach lamellae ED process. We recall that all experiments were performed in the vertical electrode, of which natural convection was not suppressed, without stirring.
Conclusions
This research studied the electrolysis conditions in which spatiotemporal structures could be observed for the first time under strictly controlled settings, during Cu-Sb alloy ED.
Spatiotemporal structures appeared when Sb content was higher than 70 wt% in the coatings. The richer in Sb was the area, the bigger were the formed crystallites. Most likely, the structures different optic and morphologic areas consisted of Cu2Sb and Sb phases. As a self-organization phenomenon, deposits in depth self-assembled structure were observed, and the layers were characterized. This will allow the next steps in the investigation of the properties of this unique alloy system.
Acknowledgements
This work was financially supported by the Operational program ‘Science and education for smart growth’ of the Ministry of Education and Science, Republic of Bulgaria, Project BG05M2OP001-2.009002. The authors would like to acknowledge Prof. Stoyanova from Institute of General and Inorganic Chemistry, Bulgarian Academy of Sciences, for commenting on the electronic paramagnetic resonance results. Uroš Lačnjevac and Nikola Tasić, colleagues from the Institute from multidisciplinary research, University of Belgrade, are greatly acknowledged for having performed the layers cross-section.
Authors’ contributions
Vasil Kostov: collected the data; contributed with data or analysis tools; performed the analysis. Tsvetina Dobrovolska: conceived and designed the analysis; contributed with data or analysis tools; wrote the paper.
Abbreviations
Ag|AgCl: silver chloride
C: concentration
C4H6O6 2-: tartaric acid
CE: counter electrode
CuSO4: copper sulfate
CuSO4·5H2O: copper (II) sulfate pentahydrate
CV: cyclic voltammetry
dj: current density
Eº: potential
ED: electrodeposition
EDS: energy dispersive spectroscopy
EPR: electronic paramagnetic resonance
giso: isotropic g-factor of proportionality
H2SO4: sulfuric acid
HER: hydrogen evolution reaction
j: current
K2CO3: tartar salt
K2Sb2C8H4O123 H2O: potassium antimonyl tartrate
KNaC4H4O6.4H2O: potassium sodium tartrate
K(SbO)C4H4O6.0.5H2O: antimony potassium tartarate
Mn2+/ZnS: divalent manganese cation/zinc sulfide
MSA: methanesulfonic acid
RE: reference electrode
Redox: reduction and oxidation
SEM: scanning electronic microscopy
SR: scan rate
T: temperature
WE: working electrode
X-RD: x-ray diffraction
X-RF: X-ray fluorescence

