


 English (pdf)
 Article in xml format
 Article references
 Send this article by e-mail
 Cited by SciELO
  Similars in
SciELO
Similars in
SciELO 
 Permalink
Introduction
Ec is a science which, although has been increasingly less used under this explicit name, is often located in the background of many current scientific issues in several fields said to have a strong technological and societal impact. It is very often present in the fields of: new energies, with batteries, fuel and solar cells; health vigilance; green chemistry, with electro-catalysis; nano and neurosciences, with ultra-microelectrodes and Ec microscopy. Understanding the physicochemical phenomena that rule the Ec problematic is a necessary step towards the development of these fields. Like any other analytical technique, Ec needs the use of a broad range of measurements devices able to quantify the physicochemical phenomena in the form of understandable information that is usable by the chemists and other users.
Among these devices, the present study focuses on the potentiostat, which is an electronic measuring equipment required for driving a three-electrode system 1, and perform most electroanalytical experiments. It consists of an electrical circuit that is usually described in simple terms by operational amplifiers. In principle, a potentiostat measures E difference between the WE and RE of a three-electrode cell, passes I through the cell across the CE, and measures it using the ohmic drop across the resistor. E of the WE is maintained at a constant level with respect to the RE, by balancing I at the CE 2.
Potentiostats are widely used in many areas, such as the study of corrosion phenomena in aquatic environments, and biosensors design 3,4. Potentiostats available on the market offer a wide range of features and specifications. Unfortunately, their prices are high 5,6. Therefore, many laboratories have started to design their own potentiostats, and one of the purposes of this work was to design potentiostat units at low prices, but still competitive in terms of basic functionality 7-10.
This paper studies corrosion extensively, which is a degeneration of a material, due to the reaction with its environment. Test conditions, such as T, O exclusion and electrolyte composition, can be modified for better understanding the corrosion mechanism in specific environments and fields. Ec analysis is effective for selecting materials during design stage or forecasting mechanisms failure and lifespan during operations. The WE is the material studied in Ec corrosion studies. It is oxidized in a controlled process. Reactions are matched to maintain charge balance at a generally inactive (e.g., Al) CE. A RE is used to survey E of the near-surface WE. Different techniques are used to monitor corrosion resistance. In potentiostatic measurements, E of the WE is sustained, and I is measured as a function of time. In PD measurements, E usually increases gradually, and the I vs. voltage is measured. I/V curve around Ecorr (where I = 0) can be fitted (Tafel analysis), giving equilibrium CR. Higher V floats can be used to determine passivation and its breakdown. CV is a particular form of PD analysis, where E is floated up and down. All the above mainly help on giving quantitative and reproducible information on the CR and corrosion mechanism analysis.
Materials and methods
The electronic circuit core is a quadruple operational Amp, with FET inputs, a circuit for which the input C are extremely low 11 (typically less than 100 pA). We have used a TL 084 CN in a 14 pin DIP package 12.
Potentiostat study, conception and simulation
Potentiostat schematic diagram
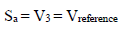
In general, E is measured in an Ec three electrode (RE, WE and AE) cell, as shown in Fig. 1, under static conditions. The cell composition remains almost unchanged, due to the negligible I that flows through it 13.
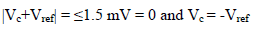
Amp A was an ordinary follower. The RE (calomel) was connected to the E+ Amp A input. It was crossed by negligible I (less than 100 pA). Therefore:
 ()1
()1

The fundamental role of Amp B is to impose, between the WE and CE, a PD that it is fixed and adjustable between the WE and RE. This PD was obtained by a divider bridge connected from -15 to +15 V. It was formed by two fixed resistors of 10 kΩ, and a potentiometer of the same value. One can adjust the PD of the Vc with the potentiometer slider. At Amp B input:
 ()2
()2
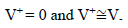
The I, entering at E-, from Amp B, is practically zero, hence:
 ()3
()3
 ()4
()4
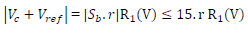
because Sb reached a maximum of 15 V (supply V). For
 ()
()or better, for
 ()6
()6
then,
 ()7
()7
Amp C acts as a I/Vc.
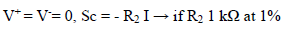 ()8
()8
Then, CV intensity indicated -1 V for an intensity of 1 mA (within 1%). Being limited to 15 V by the supply V, it was necessarily limited to 15 mA. Therefore, it was necessary to adapt the solutions C and the electrodes dimensions.
Amp D is a simple inverting gain Amp (-1), at which the CV V indicates:
 ()9
()9
The measurement is carried out without debiting the RE. However, the operational Amp C is operating in linear mode:
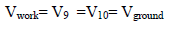 ()10
()10
Then,
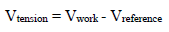 ()11
()11
Regarding IC protection against any possible connection error of the external power supply, the two diodes were used for this objective 14. If this is not well filtered, two 47 mF capacitors can be added between the power supply and the ground. nF capacitors prevent possible instabilities 15. For IC improvements, (Fig. 2) we can replace the control V from the potentiometer by a ramp from a low frequency generator (with a continuous sweep), and read the two V values with a plotter or a computer and, thus, automatically, I = f (V) 16.
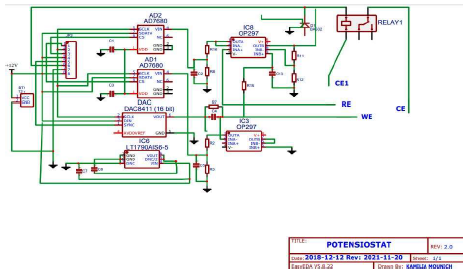
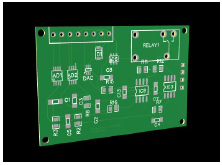
Fig. 3 gives 2D renders of the printed circuit board design, showing their nomination and location, and the board unpopulated board front side. JP2 is the connector pin that was plugged to the terminal measurement cathode and anode.
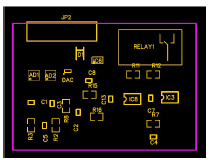
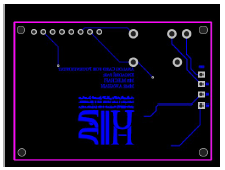
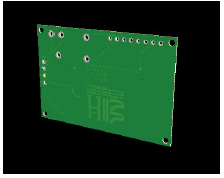
Fig. 4 shows the electronics extra line that was impossible to trace on the upper layer. The university logo and card name were added as reference.
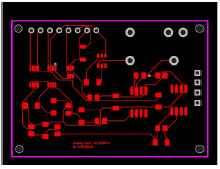
All principal electronics circuits were traced on the upper layer, as shown in Fig. 5, onto which the SMD components were welded.
Figs. 6 and Fig. 7 represent the 3D image which is close to the reality.
Chemical studies techniques
Three plants were studied, in order to assess their IE% against Al 5005 alloy corrosion (Fig. 8), and to test our device.
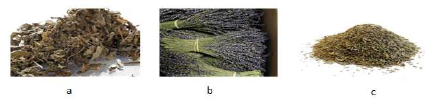
Artemisia, also called Chih, is a very popular remedy that facilitates digestion, calms abdominal pain and certain liver ailments, and it is antidiabetic. Its roots are indicated against certain nervous disorders 17. Artemisia vulgaris is one of the plants insufficiently reported that is traditionally used to protect metallic wares, agricultural tools and household utensils, with other plants, such as Berberis aristata and Mahonia nepalensis18. Lavender is a fragrant bushy shrub that belongs to the Lamiaceae family, with slender and gray-green leaves. It is sought after for its antiseptic and calming properties, and for its fragrances. Thyme is a fragrant shrub that grows spontaneously in North Africa (Morocco, Tunisia, Algeria and Libya). It is characterized by strong antimicrobial properties, remarkable antioxidant effects, and it has an antifungal activity 19.
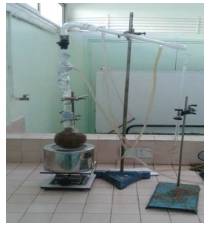
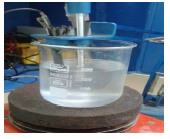
TEO extraction was done by hydro-distillation, using a Clevenger apparatus 20. 100 g of the the plant aerial part were introduced into a 2 L flask and saturated with distilled water. The whole was brought to a boil, until it was dry. TEO evaporated with the released water vapors that condensed, while crossing a cooler, then it was collected at the other end of the assembly (Fig. 9).
The obtained condensed vapors led to two phases. The organic phase had TEO, to which a desiccant (Na2SO4) was added, to eliminate water residues that were retained in this phase. TEO was kept in glass bottles, stored at 4 °C, and protected from light. The hydrolate aqueous phase had a significant TEO C.
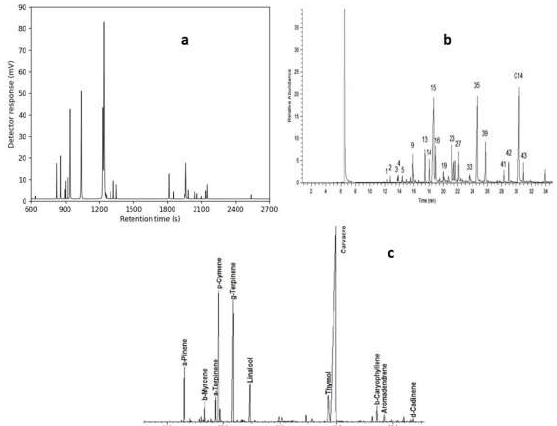
The influences of three important parameters on oil extraction process were examined, for obtaining the best processing conditions to achieve TEO maximum yield oil: water used as a solvent to the solid ratio of 5:1 and 14:1 (mL solvent/g plant); T from 30 to 100 ºC; and processing time. Artemisia, lavender and thyme main compounds are listed in Table 1, and their GCs of are shown in Fig. 10.
Table 1: Main compounds identified by GC/MS in three EOs.
| Artemisia | % | Lavender | % | Thyme | % | |
|---|---|---|---|---|---|---|
| Eucalyptol | 6,51 | linalol | 39,2 | p-cymene | 8,15 | |
| Bicyclo(3,2,0) hept-2-ene, 2-methyl | 4,31 | terpinene-4-ol | 4,32 | y-terpinene | 4,96 | |
| 1,3-cyclopentadiene, 1,2,5,5-tetramethyl | 15,6 | linalyl acetate | 33,1 | carvacrol | 83,8 | |
| Camphor | 29,8 | lavandulyl acetate | 4,52 | |||
| Bicyclo(2,2,1) heptan-2-one, 1,7,7-trimethyl-,(1S)- | 4,2 | E-β-ocimene | 3,09 | |||
| Arthole | 4,52 | Z-β-ocimene | 4,44 | |||
| 1,3-cyclopentadiene, 5,5-dimethyl-1ethyl | 3,8 | |||||
| Chrysanthenone | 8,21 | |||||
Ec experiments
The material used as WE in this study was Al 5005, in the form of plates (Fig. 11), with a well-defined surface of 1 cm2. Its composition given in mass percentages, by the supplier, is shown in Table 2.

Table 2 : Al 5005 composition.
| Al | >97 |
| Si | 0.3 |
| Fe | 0.7 |
| Cu | 0.2 |
| Mn | 0.2 |
| Mg | 0.5-1.1 |
| Cr | 0.1 |
| Zn | 0.25 |
| Others | 0.25 |
Ec cell
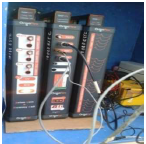
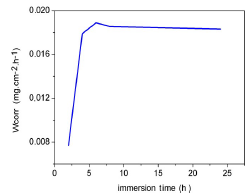
Ec tests were carried out using a conventional pyrex glass cell (Fig. 12), with a capacity of 250 mL, containing three electrodes: a rectangular Al plate (with a surface of about 1 cm2), SC and a Pt ring were used as WE, RE and CE, respectively. Before each experiment, the WE was polished with 600, followed by 1200 grade sandpaper, to have a smooth and shiny surface. Then, it was rinsed with acetone, and cleaned with distilled water.The results obtained from the conceived potentiostat device have been compared to the ones from the OrigaFlex potentiostat available in our laboratory (Fig. 13).
Monitoring OCP is one of the techniques for characterizing the corrosion of a given material. This method is based on thermodynamic foundations. Its principle consists in following E evolution of the electrode immersed in the electrolyte, during a given period of time. In some cases, we chose a pre-polarization of the sample, at a negative E (-2 V), for 1 to 2 min, to reduce the oxide formed on the electrode surface. In our case, the electrode was left alone until steady-state E, which was reached after 3 h.
Polarization curves
The metal-solution interface polarization curves are a fundamental characteristic of Ec kinetics, but only account for the slowest stage of the overall process, such as matter transport or species adsorption onto the electrode, at the interface. The device used for plotting the polarization curves consists of a classic assembly with three electrodes connected to a potentiostat, a computer and software, to allow the scanning protocol programming. Thus, to determine polarization curves, different E values were applied to the WE, through the CE, by a scanning protocol that imposed the increment. Stationary I that was established, after a certain time, in the electrical circuit between the WE and CE, was measured. Since the overall speed was determined by that of the slowest step, the polarization curves plot could thus be used to measure the CR. The plot enabled to determine precisely other Ec parameters of the metal in contact with an electrolyte, namely: Icorr, βc, βa, and Rp. The protocol gave quick measurements and its implementation was relatively simple.
EIS
EIS is a non-stationary (transient) method that provides information on the elementary steps that constitute the overall Ec process. It has several advantages: it allows for the precise determination of the CR, even when the metal is covered with a protective layer, and the evaluation of the inhibition rate, the characterization of the various corrosion phenomena (dissolution, passivation, pitting, etc.), and the study of the reaction mechanisms at the Ec interface. The graphical representation of an impedance (Z= ZRe + jZIm), in the complex plane for different frequencies, is called a Nyquist diagram, which places the ZRe and −ZIm values on the abscissa and on the ordinate, respectively. For this representation, it is necessary to use orthonormal markers. In this case, the frequency only appears indirectly on the diagram. The frequency analysis of the EIS will enable to differentiate the various elementary phenomena according to their characteristic frequency. Fast Ec phenomena (charge transfer) are solicited in the high frequency range, while slow phenomena (diffusion, adsorption) occur at low frequencies.
Results and discussion
Gravimetric study
Study of the effect of Al immersion time in 3% NaCl on its CR
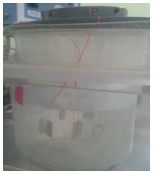
For the gravimetric experiments, the Al samples were immersed in beakers containing 500 mL 3% NaCl without additives, at room T, under aerated conditions (Fig. 14).
The Al CR was given by the following relationship:
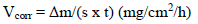 ()12
()12
where Δm = m0 - m1 represents the Al WL without inhibitor and with it. The given IE% was the average of two tests carried out under the same conditions, for each C. It was given by the following relationship:
 ()13
()13
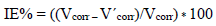
WL, over time, was found by removing the samples from the beakers, at 2, 4, 6, 8 and 24 h intervals. The samples were then gently washed under running water, immersed in absolute ethanol, dried with acetone, and then weighed. WL was taken as the difference between the initial weight of the samples and their weight at a given time. Fig. 15 represents the variation in the CR, as a function of the immersion time in a medium containing 3% NaCl without inhibitor, at 25 ºC.
We found that the CR of Al in 3% NaCl also increased with the immersion time, and then stabilized after 240 min. This was due to the continuous metal dissolution in the corrosive medium.
Study of three EOs IE% on Al corrosion in 3% NaCl
The study of the C effect of three different EOs on their corrosion IE% was carried out with Al samples. These samples were immersed in 3% NaCl, without inhibitors and with their different C. The corrosion IE% was determined after 4 h of immersion, at a T of 25 ºC, using a thermostat bath. Fig. 16 represents the device used for the gravimetric measurements.
Table 3 gives CR and IE% values, calculated by gravimetry, for different inhibitors C, in a 3% NaCl medium, at 25 ºC. Figs. 17 and 18 represent the evolution of the CR of Al immersed in a 3% NaCl medium, at 25 ºC, and the inhibitors IE%, as a function of their C, respectively.
Table 3: CR and IE% calculated for three inhibitors different C in a 3% NaCl medium, at 25 ºC.
| C | Artemisia | Lavender | Thyme | |||
|---|---|---|---|---|---|---|
| Wcorr | IE% | Wcorr | IE% | Wcorr | IE% | |
| 0 | 0.359242 | - | 0.359243 | - | 0.359243 | - |
| 100 ppm | 0.053264 | 85.173 | 0.11673 | 67.507 | 0.12121 | 66.261 |
| 200 ppm | 0.024211 | 93.260 | 0.085231 | 76.275 | 0.10763 | 70.038 |
| 300 ppm | 0.021509 | 94.013 | 0.082489 | 77.038 | 0.10194 | 71.623 |
| 400 ppm | 0.018514 | 94.846 | 0.077721 | 78.365 | 0.089951 | 74.961 |
| 500 ppm | 0.018318 | 94.901 | 0.076302 | 78.760 | 0.087500 | 75.643 |
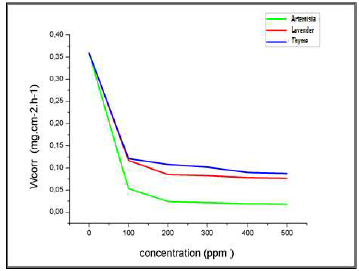
Figure 17: Variation in the CR of Al immersed in a 3% NaCl medium, at 25 ºC, without EOs and with their different C.
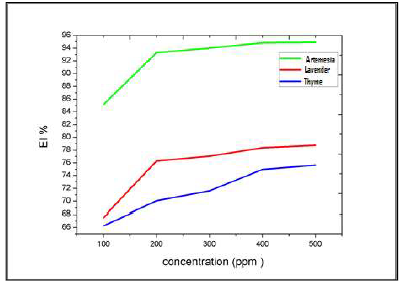
Figure 18: Variation in the CR of Al immersed in a 3% NaCl medium, at 25 ºC, without EOs, and with their different C.
For the three inhibitors (AEO, LEO and TEO), we noted that CR decreased, while the IE% increased with higher inhibitors contents, reaching its maximum values of: 93%, with 200 ppm AEO; 76%, with 200 ppm LEO; and 70%, with 200 ppm TEO. We noted CR and IE stabilization. In PDP tests, the Al sample was immersed for 6 min, in order to obtain a stable free E. Then, polarization was initiated.
Study of the different AEO C IE% effect on Al corrosion in 3% NaCl
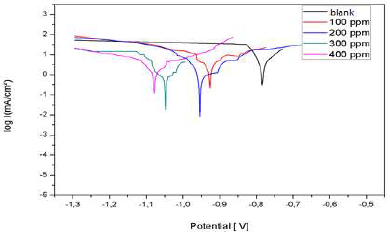
Fig. 19 shows the anodic and cathodic polarization curves, in the absence and presence of different AEO C. They were obtained after 1 h of immersion, at 25 ºC, in 3% NaCl.
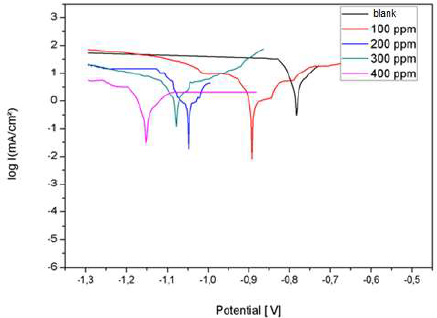
Table 4 groups together the Ec parameters values determined from the previously obtained polarization curves: Icorr, Ecorr, βc, βa and corrosion IE%, which is defined by:
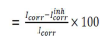 ()14
()14
where Icorrinh is Icorr recorded with AEO, in different C. These densities were determined by the cathodic and anodic lines extrapolation from Tafel to Ecorr.
Table 4: Values of the Ec parameters determined from the polarization curves.
| C (ppm) | Ecorr (mV) | Icorr (mA/cm2) | βa (mV) | βc (mV) | IE% |
|---|---|---|---|---|---|
| 0 | -761 | 64 | 116 | -438 | - |
| 100 | -868 | 9 | 117 | -64 | 85 |
| 200 | -1044 | 7,6 | 155 | -668 | 88 |
| 300 | -1096 | 6,92 | 70 | -426 | 89 |
| 400 | -1160 | 5,92 | 58 | -205 | 90 |
Interpretation
AEO addition shifted the polarization curves towards cathodic E. In addition, we noted that AEO essentially acted as a cathodic inhibitor.
The results in Table 4 show that Icorr decreased significantly with increasing AEO C, and Ecorr shifted to more negative values. Therefore, IE% increased with higher AEO C, reaching a maximum value of 88%, at 0.2 g/L. It can be seen that, with this C, AEO IE% remained almost constant, due to its solubility in 3% NaCl.
Study of LEO C IE% effect on Al corrosion in 3% NaCl
Al cathodic and anodic polarization curves in 3% NaCl, without LEO and with it, in different C, are presented in Fig. 20. They were obtained after 1 h immersion, and at 25 ºC. Icorr, Ecorr, βc, βa and IE% values, for different surfactant C, are reported in Table 5.
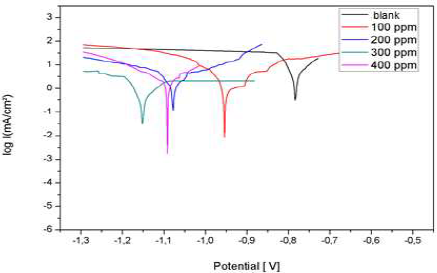
Figure 20: Al polarization curves in a 3% NaCl basic medium, without LEO and with it, in different C
Table 5: Al Ec parameters in a 3% NaCl medium, at 25 ºC, without LEO and with it, in different C, and its IE%.
| Experiment | ECorr (mV) | ICorr (mA/cm2) | βa (mV) | βc (mV) | IE(%) |
|---|---|---|---|---|---|
| 0 | -761 | 64 | 116 | -438 | - |
| 100 | -950 | 10 | 117 | -64 | 83 |
| 200 | -1670 | 9,5 | 58 | -598 | 85 |
| 300 | -1720 | 9 | 63 | -605 | 85 |
| 400 | -1181 | 8,6 | 58 | -205 | 86 |
Interpretation
The results show that IE% calculated from the Icorr values increased with higher inhibitor C, reaching 85% at 200 mg/L. Nevertheless, the polarization curves show that Icorr values for Al with different LEO C were lower than those for the blank sample. Moreover, this behavior reveals that LEO reduced Al corrosion in 3% NaCl. The results obtained for LEO show that it is a cathodic inhibitor.
Study of TEO C IE% effect on Al corrosion in 3% NaCl
Al polarization curves, without and with TEO, in different C, in 3% NaCl, at 25 ºC, are shown in Fig. 21.
Ec parameters (Icorr, Ecorr, βc, βa and IE %) values determined from the previously obtained polarization curves are reported in Table 6.
Table 6: Al Ec parameters in 3% NaCl, at 25 °C, without TEO and with it, at different C, and its IE%.
| C (g/L) | ECorr (mV) | ICorr (mA/cm2) | βa (mV) | βc (mV) | IE% |
|---|---|---|---|---|---|
| 0 | -761 | 64 | 116 | -438 | ------ |
| 100 | -920 | 18 | 157 | -426 | 71 |
| 200 | -968 | 12 | 189 | -713 | 81 |
| 300 | -1055 | 11 | 192 | -416 | 82 |
| 400 | -1092 | 10 | 203 | -458 | 84 |
When TEO was added to 3% NaCl, the polarization curves (Fig. 21) shifted towards cathodic E. The anodic process was approximately constant, so we can say that TEO had no effect on the anodic branch. These results indicate that TEO acted as a cathodic inhibitor. The results show that TEO addition to 3% NaCl considerably slowed down the corrosion process, with a significant value of 81% IE, for an inhibitor C of 0.2 g/L. According to the obtained results, Icorr considerably decreased with higher TEO C.
EIS
EIS plotted at E equal to Ecorr, for different C, was intended to complete the understanding of Al corrosion behavior in 3% NaCl, and its CI mechanism by the EO.
Study of different AEO C IE% effect on Al corrosion in 3% NaCl
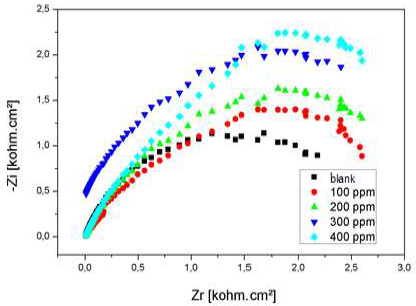
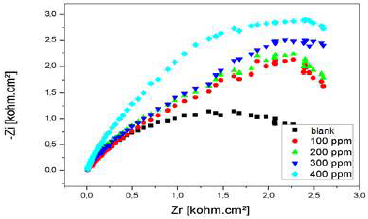
Nyquist diagram of Al immersed in 3% NaCl, without AEO and with it, in different C, after 30 min immersion, is presented in Fig. 22.
Ec parameters of Al, and AEO IE%, in different C, which were obtained by EIS, are gathered in Table 7. IE% was calculated from Rct values, according to the relationship:
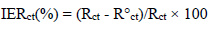 ()15
()15
where R°ct is Al charge transfer resistance values with and without AEO, respectively. Rct was calculated from the capacitive loop diameter. Cdl values (µf/cm-2) were determined from the following relationship:
 ()16
()16
Table 7: Al corrosion Ec parameters in 3% NaCl, at 25 ºC, with inhibitor and without it, in its different C, and AEO IE%.
| C (g/L) | Rct (kΩ/cm2) | Cdl (μF/cm-2) | IE(%) |
|---|---|---|---|
| 0 | 2,5 | 62 | - |
| 0,1 | 6,78 | 57,23 | 63 |
| 0,2 | 9,55 | 46,96 | 73 |
| 0,3 | 9,73 | 45,66 | 74 |
| 0,4 | 10 | 35,66 | 75 |
Interpretation
Rct values increased considerably with higher AEO C, while Cdl of the formed film decreased, reaching a value of 35.66 µF/cm-2. With an ever increasing inhibitor adsorption, the deposit thickness was greater, and Cdl was lower. Higher AEO C seemed to decrease the active sites present on the metal surface. This decrease may be due to the active surface blocking by the inhibitor adsorption onto Al surface, causing an increase in Rct, which gave a maximum IE(%) of 73%, at 0.2 g/L.
Study of LEO C IE% effect on Al corrosion in 3% NaCl
The Nyquist diagrams of Al immersed in 3% NaCl, without LEO and with it, in its different C, are shown in Fig. 23.
Al corrosion Ec parameters and LEO IE%, in different C, obtained by EIS, and using the equivalent circuit, are gathered in Table 8.
Table 8: Ec parameters obtained by Al EIS, without LEO and with it, in its different C, in 3% NaCl, at 25 ºC.
| C (g/L) | Rct (kΩ/cm2) | Cdl (μF/cm-2) | IE(%) |
|---|---|---|---|
| 0 | 2.5 | 66 | - |
| 0.1 | 5.88 | 49 | 57 |
| 0.2 | 6.82 | 46.56 | 63 |
| 0.3 | 6.91 | 42.36 | 63 |
| 0.4 | 7.06 | 40.11 | 64 |
From the impedance results given in Table 10, it was concluded that Rct values increased with higher LEO C. This behavior was due to the inhibitor adsorption onto the Al. On the other hand, there is an increase in the IE from 57%, for 0.1 g/L, to 63%, for 0.2 g/L. Cdl values were also reduced in the inhibitor presence. The results obtained from the polarization technique for the C effect are in good agreement with those of EIS, with little variation.
According to the obtained parameters, LEO addition decreased Cdl and increased Rct. The decrease in Cdl value can be attributed to LEO molecules adsorption onto the Al surface, which formed a protective layer.
Study of TEO C IE% effect on Al corrosion in 3% NaCl
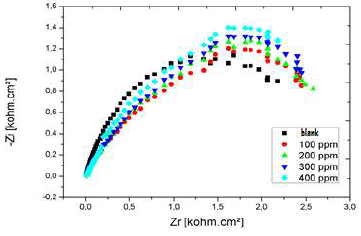
The impedance spectra obtained at Ecorr were recorded after 1 h immersion for different TEO C. Nyquist diagrams are shown in Fig. 24.
Al Ec parameters and TEO IE% values, in different C, obtained by EIS, are presented in Table 9.
Table 9: Al corrosion Ec parameters in a 3% NaCl medium, at 25 ºC, without and with TEO, in different C and its IE%.
| C (g/L) | Rct (Kω/cm2) | Cdl (µf/cm-2) | IE(%) |
|---|---|---|---|
| 0 | 2.5 | 66 | - |
| 0.1 | 5.45 | 64 | 54 |
| 0.2 | 5.93 | 62 | 57 |
| 0.3 | 6.02 | 54 | 58 |
| 0.4 | 0.320 | 51 | 59 |
Interpretation
Al Rct values increased and Cdl values decreased with higher TEO C. However, the Rct values in the inhibitor presence always remained higher than those obtained for the Al blank sample. IE% increased with higher TEO C, reaching 57%, for a C of 0.2 g/L. The general shape of the diagrams was very similar for all the tests. This indicates that almost no change in the corrosion mechanism has occurred, due to the inhibitor addition.
Conclusion
A pivotal discipline between electricity 21 and chemistry, Ec is a process of interfacial nature. It describes the chemical phenomena coupled with reciprocal exchanges of electrical energy. Ec studies different physicochemical phenomena, such as electrolysis, corrosion and electroplating.
Contrary to what one might think, corrosion does not concern only the study of materials involved in the structure of boat hulls, but also finds a very interesting application in biomedical field. Indeed, a prerequisite for a prosthesis to be approved is its ability to minimize biological environment effects where they are located. We can cite as, for example, the case of metal dental implants that are exposed to a very corrosive medium in the oral cavity. This phenomenon has been studied and quantified by the assembly of three electrodes or by a potentiostat.
During this project, we were entrusted with the mission of designing a potentiostat that would allow us to overcome the many constraints of potentiostats available at the LIPE level, such as their connections, physical size, confusing sophistication and cost.
The present work focused on the study of Al corrosion inhibition by AEO, LEO and TEO, in 3% NaCl, using the gravimetric or WL, PPD and EIS techniques. These studies showed that the inhibitors addition to 3% NaCl considerably slowed down Al corrosion process, and that their IE% only increased with their C. Nyquist diagrams for the three EO consisted of a single capacitive loop. This type of diagram generally indicates that the corrosion reaction was controlled by a charge transfer process on a solid electrode with a heterogeneous and irregular surface. AEO is a better inhibitor of Al corrosion in 3% NaCl than LEO, which was also more effective than TEO, even at very low C. The study by IES clearly showed the increase in the capacitive half loop impedance, with higher inhibitors C, which was in agreement with the increase in the alloy resistance, thus confirming the Ec study results.
In perspective, we propose as part of the continuation of this work: to make a study on T to elucidate its effect on the kinetics; and to use SEM analysis to account for the chemistry of the layer formed on the metal surface.
Declaration of interests
The authors declare that they have no known competing financial interests or personal relationships that could have appeared to influence the work reported in this paper.
Authors’ contributions
K. Mounich: conceptualization, methodology, investigation, writing, review, editing and supervision. M. Chafi: conceptualization, writing, review, editing and project administration. O. L. El Hachemi: conceptualization, writing, review, editing and funding acquisition. A. Tizliouine: conceptualization, writing, review and editing. A. Wahabi: conceptualization, writing, review, editing, project administration and funding acquisition.
Abbreviations
Amp: amplifier
C: concentration
Cdl: double layer capacitance
CE: counter electrode
CR: corrosion rate
CV: cyclic voltammetry/voltammeter
E: potential
Ec: electrochemical/electrochemistry
Ecorr: corrosion potential
EIS: electrochemical impedance spectroscopy
FET: field effect transistor
GC: gas chromatography
I: current
IC: integrated circuit
Icorr: corrosion current density
IE: inhibition efficiency
MS: mass spectrometry
Na2SO4: sodium sulphate
nF: nanofarad
OCP: open circuit potential
PCB: printed circuit board
Pd: potentiodynamic
PD: potential difference
PDP: potentiodynamic polarization
RE: reference electrode
Rp: polarization resistance
Rct: charge transfer resistance
SC: saturated calomel
SEM: scanning electron microscopy
SMD: surface mount device
T: temperature
TEO: thyme essential oil
WE: working electrode
WL: weight loss
Vc: voltage converter

