


 Inglês (pdf)
 Artigo em XML
 Referências do artigo
 Enviar este artigo por email
 Citado por SciELO
  Similares em
SciELO
Similares em
SciELO 
 Permalink
Introduction
The increase in corrosion costs has brought about major financial problems to oil, refinery and petroleum industries, which has fostered research for I that are also eco-friendly 1. Corrosion is the spontaneous oxidation of most metals. It causes metals and alloys deterioration or destruction by chemical or electrochemical means 2. Acids and chlorides are among the main sources of MS corrosion, which is a major concern in academia and industry. Furthermore, in industries like gas production and offshore oil, seawater environments are frequently used. While corrosion is most commonly associated with metals, it affects all kinds of materials. MS is a popular structural material in sugar, petrochemical, brewery, agricultural, paper, textile and marine industries, for making reaction vessels, pipes and tanks 3, since it is cheap and has usable properties. It has a carbon content of up to 0.25%, among other elements, which allows its use in several products, such as structural beams, automobile bodies, kitchen appliances and cans treatment 4. The only concern for MS is its low resistance against corrosion, particularly in acidic/saline environments. Over the years, efforts have been made to develop effective organic I in various corrosive conditions, which generally have O, N and S heteroatoms that have higher basicity and electron density. The active centres for the adsorption process onto the metal surface are O, N, P and S. IE (%) is commonly measured in the following order: O < N < S < P 5. Researchers are still searching for the best and most cost-effective I. Most natural-based I are environmentally safe chemicals that can be discarded 6. Various plant extracts/animal wastes are able to reduce corrosion with promising efficacy. Some of them are: Mangifera indica7,25; Eucalyptus LE 8; Mangifera ficus tikoua LE 9; Saraca ashoka aqueous seed 10; Tinospora crispa extract 11; Bitter kola leaf 12; Gentiana olivieri extracts 13; calcinated ES 14; Mango extract 15; Luffa cylindrica LE 16; Dioscorea septemloba17; Pterocarpus santalinoides LE 18; Pomegranate peel plant extracts 19; Paederia Foetida LE 20; Katemfe LE 21; CNE 22; Corchorus Olitorus LE 23; and Ficus extrasperata extract 24.
This research was tailored to use ES for preventing corrosion, because it is a readily available and eco-friendly waste. The goal of the study was to optimize ESE as I on MS in a 30 wt% NaCl solution.
Materials and methods
MS preparation
MS employed in this experiment came from the mechanical workshop at Landmark University in Omu-Aran, Kwara State, Nigeria. MS dimensions were 2.2 by 1.9 cm, thickness of 0.2 cm, with a 0.1 cm hole drilled in the middle. MS was cleaned with emery paper, in order to expose the shiny surface, thereafter rinsed with distilled water and degreased with acetone, for removing any oil contaminants and then placed in a desiccator.
ESE preparation
ES were provided by Landmark University Pastries and dried for three days. Then, they were crushed and stored for extraction. In each procedure, 35 g ES powder were placed in a Soxhlet extractor with 300 mL ethanol, for 3 h. The solution was then concentrated and used to make the C of ESE in 30 wt% NaCl.
Corrosive medium preparation
The corrosive medium was prepared by adding 300 g NaCl to 1000 mL distilled water.
WL method
A beaker containing the prepared solution in a thermostatic water bath was used to evaluate WL for all the experimental runs predicted by BB design. T ranges used in this study were from 24.1 to 30.6 ºC, in a thermostatic water bath. This range was determined based on a 10-year survey conducted by 24, which revealed that T of seawater in Nigeria fluctuates from 24.1 to 30.6 ºC (https://www.seawatertemperature.com). C of ESE was from 0.4 to 0.8 g/L, and IT was 3-15 days. MS coupons were weighed before and after immersion, using software-generated variations in IT, T and C of ESE, for each run.
Eq. (1) was used to compute WL of MS.
 ()
()where MS weight before and after immersion in 30 wt% NaCl is Wb and Wa, respectively.
CR was calculated using eq. (2).
 ()
()where ∆W is MS coupon WL without and with ESE, t is IT and A is the alloy area.
IE(%) was calculated using eq. (3).
 ()
()Pc analysis
ES were subjected to Pc analysis, in order to identify the presence of some active ingredients that would create a good CI.
Experimental design
Three variables (T, IT and C of ESE) generated 17 experimental runs by BB design. Table 1 shows the experimental ranges (low and high). Table 2 depicted the experimental design interactions.
Table 1: Experimental ranges (low and high).
| Name and symbol | Units | Low | High |
|---|---|---|---|
| T = A | ℃ | 24.4 | 30.6 |
| IT = B | Days | 3 | 15 |
| Amount = C of Extract | (g/L) | 0.3 | 0.8 |
Table 2: Variables interactions for 17 experimental runs.
| Run | T (℃) | IT (days) | C of ESE (g/L) |
|---|---|---|---|
| 1 | 27.5 | 9 | 0.6 |
| 2 | 24.4 | 15 | 0.6 |
| 3 | 30.6 | 15 | 0.6 |
| 4 | 24.4 | 6 | 0.4 |
| 5 | 27.5 | 15 | 0.8 |
| 6 | 27.5 | 9 | 0.6 |
| 7 | 24.4 | 9 | 0.8 |
| 8 | 30.6 | 9 | 0.8 |
| 9 | 24.4 | 3 | 0.6 |
| 10 | 27.5 | 15 | 0.4 |
| 11 | 27.5 | 3 | 0.4 |
| 12 | 27.5 | 9 | 0.6 |
| 13 | 27.5 | 9 | 0.6 |
| 14 | 30.6 | 3 | 0.6 |
| 15 | 27.5 | 3 | 0.8 |
| 16 | 27.5 | 9 | 0.6 |
| 17 | 30.6 | 9 | 0.4 |
Surface characterization
FTIR
FTIR analysis was used to assess MS in a 30 wt% NaCl solution: without ESE; with ESE, of highest IE (%) (as determined by the experimental design); and via optimal process levels (validated).
SEM
SEM technique was employed to study MS morphology and best process variables in a 30 wt% NaCl solution: without ESE; with ESE at the highest IE(%) (as determined by the experimental design); and via optimal process levels (validated).
EDS
EDS revealed MS elemental components in a 30 wt% NaCl solution: without ESE; with ESE, at its highest IE(%) (as determined by the experimental design); and via optimal process levels (validated).
Electrochemical techniques
PDP study
A potentiostat was used to measure PDP plots for MS specimens in 30 wt% NaCl with various C of ESE. A magnetic stirrer was used to keep the test solution at a constant T of 24.4 ºC. After being polished, the samples were degreased with acetone, and rinsed. Ecorr extrapolation to the linear component gave Icorr. Steady-state OCP was accomplished by determining the electrochemical system unchanged at the IT end. Furthermore, to obtain PDP data, the V was from -250 to +250 mV, at a SR of 1 mV/s.
Results and discussion
Discussion of Pc analysis results
ESE is a powerful CI, since it contains proteins, which are a type of amino acid, which backed up findings from 22,25. Pc analysis results are shown in Table 3.
Table 3: Results of Pc analysis.
| Components | Percentage |
|---|---|
| N | 0.93% |
| Protein | 5.79% |
| Fat | 1.5% |
| Moisture content | 0.5% |
| Ash | 90% |
Results of WL measurements
Tables 4-6 show the results of experiments generated with BB design. The best process level was observed in experimental run 4 with: IT of 9 days; T of 24.4 ºC, C of ESE at 0.4 g/L; and IE(%) of 95.65%. Furthermore, lowest CR was also found in experiment run 4.
Table 4: Results from the experimental runs with WL response.
| Run | T (ºC) | IT (days) | C of ESE (g/L) | WL (g) |
|---|---|---|---|---|
| 1 | 27.5 | 9 | 0.6 | 0.004 |
| 2 | 24.4 | 15 | 0.6 | 0.013 |
| 3 | 30.6 | 15 | 0.6 | 0.009 |
| 4 | 24.4 | 6 | 0.4 | 0.002 |
| 5 | 27.5 | 15 | 0.8 | 0.005 |
| 6 | 27.5 | 9 | 0.6 | 0.004 |
| 7 | 24.4 | 9 | 0.8 | 0.013 |
| 8 | 30.6 | 9 | 0.8 | 0.007 |
| 9 | 24.4 | 3 | 0.6 | 0.005 |
| 10 | 27.5 | 15 | 0.4 | 0.006 |
| 11 | 27.5 | 3 | 0.4 | 0.01 |
| 12 | 27.5 | 9 | 0.6 | 0.004 |
| 13 | 27.5 | 9 | 0.6 | 0.004 |
| 14 | 30.6 | 3 | 0.6 | 0.004 |
| 15 | 27.5 | 3 | 0.8 | 0.005 |
| 16 | 27.5 | 9 | 0.6 | 0.004 |
| 17 | 30.6 | 9 | 0.4 | 0.008 |
Table 5: Results from the experimental runs with CR response.
| Run | T (ºC) | IT (days) | C of ESE (g/L) | CR g/cm2/days |
|---|---|---|---|---|
| 1 | 27.5 | 9 | 0.6 | 0.0015873 |
| 2 | 24.4 | 15 | 0.6 | 0.0003095 |
| 3 | 30.6 | 15 | 0.6 | 0.0002142 |
| 4 | 24.4 | 6 | 0.4 | 3.3333E05 |
| 5 | 27.5 | 15 | 0.8 | 0.0001190 |
| 6 | 27.5 | 9 | 0.6 | 0.0015873 |
| 7 | 24.4 | 9 | 0.8 | 0.0001444 |
| 8 | 30.6 | 9 | 0.8 | 0.0002777 |
| 9 | 24.4 | 3 | 0.6 | 0.0001666 |
| 10 | 27.5 | 15 | 0.4 | 0.0001428 |
| 11 | 27.5 | 3 | 0.4 | 0.0011904 |
| 12 | 27.5 | 9 | 0.6 | 0.0015873 |
| 13 | 27.5 | 9 | 0.6 | 0.0015873 |
| 14 | 30.6 | 3 | 0.6 | 0.0047619 |
| 15 | 27.5 | 3 | 0.8 | 0.0005952 |
| 16 | 27.5 | 9 | 0.6 | 0.0015873 |
| 17 | 30.6 | 9 | 0.4 | 0.0003174 |
Table 6: Results from the experimental runs with θ and IE response.
| Run | T (ºC) | IT (days) | C of ESE (g/L) (g/L) | θ | IE (%) |
|---|---|---|---|---|---|
| 1 | 27.5 | 9 | 0.6 | 0.333 | 33.3 |
| 2 | 24.4 | 15 | 0.6 | 0.200 | 20 |
| 3 | 30.6 | 15 | 0.6 | 0.573 | 57.333 |
| 4 | 24.4 | 6 | 0.4 | 0.953 | 95.333 |
| 5 | 27.5 | 15 | 0.8 | 0.667 | 66.66677 |
| 6 | 27.5 | 9 | 0.6 | 0.333 | 33.3 |
| 7 | 24.4 | 9 | 0.8 | 0.560 | 56 |
| 8 | 30.6 | 9 | 0.8 | 0.633 | 63.333 |
| 9 | 24.4 | 3 | 0.6 | 0.573 | 57.333 |
| 10 | 27.5 | 15 | 0.4 | 0.666 | 66.667 |
| 11 | 27.5 | 3 | 0.4 | 0.713 | 71.333 |
| 12 | 27.5 | 9 | 0.6 | 0.333 | 33.3 |
| 13 | 27.5 | 9 | 0.6 | 0.333 | 33.3 |
| 14 | 30.6 | 3 | 0.6 | 0.573 | 57.333 |
| 15 | 27.5 | 3 | 0.8 | 0.132 | 13.2 |
| 16 | 27.5 | 9 | 0.6 | 0.333 | 33.3 |
| 17 | 30.6 | 9 | 0.4 | 0.466 | 46.6777 |
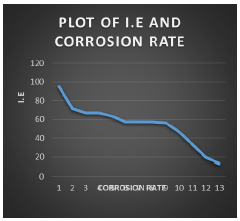
The graph for IE(%) of ESE vs. WL of MS is shown in Fig. 1.

Fig. 2 shows graph of ESE IE(%) vs. CR of MS.
Statistical analysis on CI of MS in 30 wt% NaCl by ESE
As shown in Table 7, the observed model F-value was 118.45.
Table 7: ANOVA.
| Source | Sum of squares | DF | Square | Value | Prob > F |
|---|---|---|---|---|---|
| Model | 6946.19 | 9 | 771.80 | 118.45 < 0.0001 | significant |
| A | 447.46 | 1 | 447.46 | 68.67 < 0.0001 | |
| B | 433.57 | 1433.57 | 66.54 < 0.0001 | ||
| C | 683.87 | 1 | 683.87 | 104.96 < 0.0001 | |
| A2 | 2754.28 | 1 | 2754.28 | 422.71 < 0.0001 | |
| B2 | 1119.02 | 1 | 1119.02 | 171.74 < 0.0001 | |
| C2 | 1110.05 | 1 | 1110.05 | 170.37 < 0.0001 | |
| AB | 1685.98 | 1 | 1685.98 | 258.76 < 0.0001 | |
| AC | 66.10 | 1 | 66.10 | 10.14 < 0.0154 | |
| BC | 2760.49 | 1 | 2760.49 | 423.67 < 0.0001 | |
| Residual | 45.61 | 7 | 6.52 | ||
| Lack of fit | 45.60 | 1 | 45.60 | 34201.50 < 0.0001 | significant |
| Pure error | 8.000 | 6 | 1.333 | ||
| Cor. total | 6991.80 | 16 | |||
| Squared R | 0.9935 | ||||
| Pred. squared R | 0.9851 | ||||
| Adj. squared R | 0.9844 |
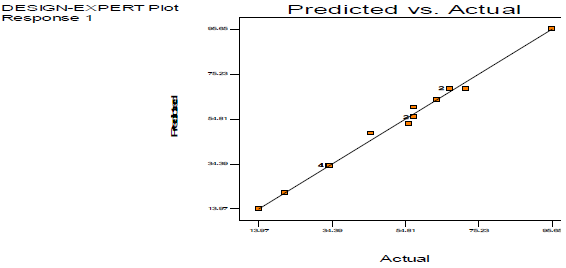
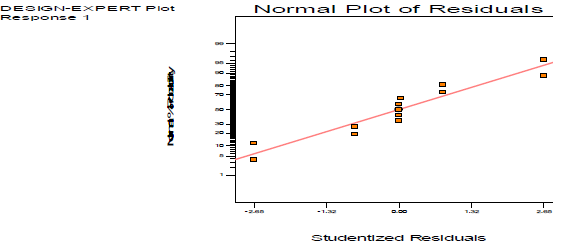
Model terms are significant if the "Prob > F" value is less than 0.0500. The significant model terms are: A, B, C, A2, B2, C2, AB, AC and BC. R2 value of 0.9935 showed that the existing model predicted more than 99% response variability. Predicted (0.9851) and adjusted R2 (0.9844) were found to be in good agreement. The regression eq, observed in terms of coded and actual factors, is below:
 ()
()where A is T, B is IT and C is ESE content.
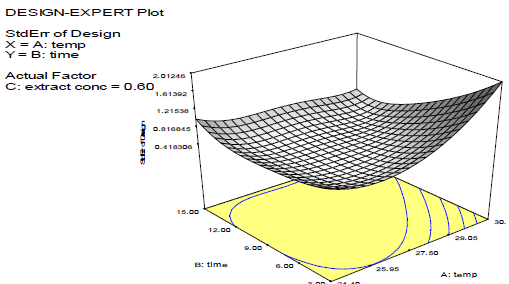
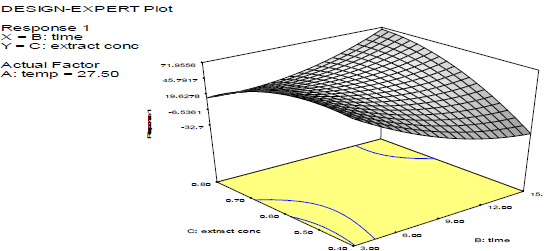
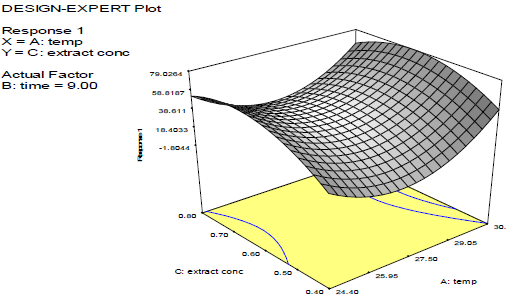
Discussion on the 3D surface plots
Figs. 3-8 shows 3D plots for the variables interactions. They confirm the results from 27
Results of FTIR analysis
Fig. 8 (a-c) shows FTIR spectra of MS immersed in NaCl without inhibitor, with ESE, at its highest IE (%), from result of experimental design, and validated optimal process level, respectively. The bands corresponding to O-H, C-H, O-H, C=N, C-H, O-H and C=C, for MS immersed in NaCl without and with ESE of highest IE (%), are 3598.13, 3210.55, 2527.03, 2350.74, 2000.08, 1426.28 and 1096.32 cm-1, respectively. MS immersed in NaCl without inhibitor (8a) had transmittance percentage from 62.71 to 39.26, while of highest IE, seen in 8b was from 48.71 to 26.00. The bands at 3500.26, 3200.41, 3098.15, 2043.15, 2000.08, 1325.80, 1100.73 and 750.26 cm-1 were of optimal process level (8c).
The peak at 3500.26 cm-1 represents the stretching vibrations of O-H group. 3200.41 cm-1 is C-H stretching vibration. 3098.15 cm-1 is C-H symmetric stretching vibration of the CH2 group connection. 2043.15 cm-1 is C-N stretching vibration of conjugated ketone or alkene. 2000.80 cm-1 is C-N symmetric stretching vibration of the CH2 group connection. 2043.15 cm-1 is C-N stretching vibration amide. ESE functioned as a mixed I of validated optimal process level, which agreed with findings of 22,28.
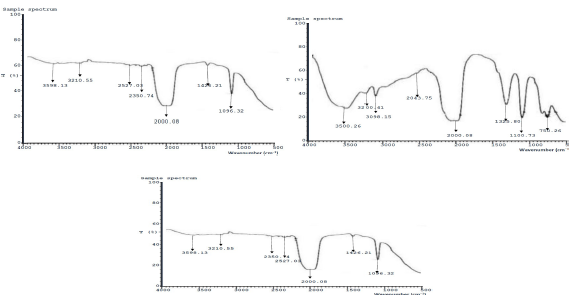
Figure 8: FTIR spectra of MS: a) without ESE; b) with ESE of highest IE(%); and c) at optimal process level.
Results of SEM analysis
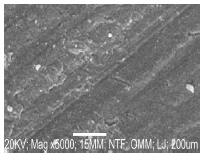
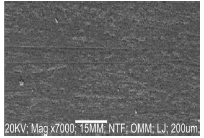
Figs. 9-11 show micrographs of MS immersed in 30 wt% NaCl with and without ESE and the optimal process level (validated experiment), respectively.
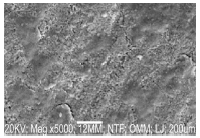
The blank coupon was highly corroded with cracks, as shown in Fig. 9. Fig.10, which was derived from experimental design, shows that ESE formed layers of protective film, whereas Fig. 11 (validated optimal level) depicted more protective film that was due to ESE adsorption 25.
PDP results
Fig. 12 shows the polarization map of MS in 30 wt% NaCl without and with 0.4, 0.6 and 0.8 g/L ESE. ESE worked as a mixed-type I, as evidenced by Ecorr displacement (Table 8), which was less than 85 mV 26-29.
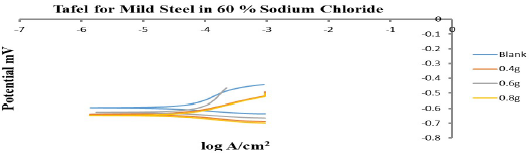
Table 8: PDP parameters for MS corrosion in 30 wt% NaCl with ESE.
| C (g/L) | ECorr (V) | ICorr (A/cm2) | CR (mm/yr) | Rp (Ω) | (a (v/dec) | (c (v/dec) |
|---|---|---|---|---|---|---|
| Blank | -0.59747 | 0.0000011895 | 0.013822 | 442.41 | 0.0020693 | 0.0029237 |
| 0.4 | -0.6394 | 0.000001086 | 0.012619 | 435.49 | 0.0026357 | 0.0018557 |
| 0.6 | -0.62701 | 0.0000010752 | 0.012494 | 426.16 | 0.0020757 | 0.0021455 |
| 0.8 | -0.64813 | 0.000001007 | 0.011701 | 412.08 | 0.0019249 | 0.0021929 |
At 0.4 g/L ESE, CR of MS was the lowest and Rp was the highest, indicating that this C was the most effective. Furthermore, it was also seen that ESE addition blocked MS active sites, which slowed down CR. WL and PDP results were in good agreement.
Results of EDXS analysis
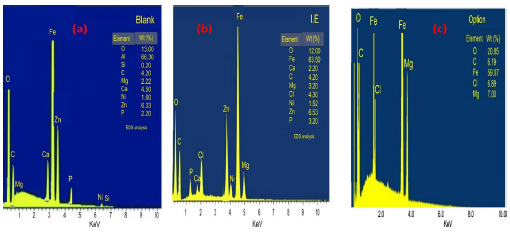
The elemental compositions of MS without and with ESE, at its highest IE(%) and via best process variables, were investigated using EDXS, as shown in Fig. 13 (a-c). Fig. 13c shows O heteroatom larger amount, which could be due to Fe oxidation (Fig 13b). It is manifest that corrosion damage was minimised, as depicted in Fig. 13c, which confirmed the result of 30.
Conclusion
The presence of proteins (a type of amino acid), N, fat and moisture content in the Pc analysis confirmed that ESE is an effective I. The results of the experimental design showed ESE highest IE(%) of 95.33%, with IT of 6 days, C of 0.4 g/L and T of 24.4 ºC. PDP results showed that the lowest CR was obtained at experiment 4. Results from PDP and WL techniques were in good agreement. SEM outcomes showed that a more passive film was formed on the MS surface, via the optimal process level, than on that with ESE best IE (%). This confirmed that ESE is an effective and environmentally friendly I.
Acknowledgments
The authors appreciate Landmark University, Omu-Aran, Nigeria, for their support to this research, and provision of facilities.
Authors’ contributions
Olamide Oyewole: wrote the manuscript; interpreted the data; conceived the idea; analyzed the results. John Busayo Adeoye: wrote the manuscript; interpreted the data; analyzed the results. Mark Lucas: performed the experiment and interpreted data; analyzed the results; did the experimental design. Wuraola Olugbemi: analyzed the results.
Abbreviations
BB: Box-Behnken
C: concentration
CNE: chicken nail extract
CR: corrosion rate
DF: degree of freedom
Ecorr: corrosion potential
EDXS: energy disperse x-ray spectroscopy
ES: eggshell
ESE: eggshell extract
FTIR: Fourier transform infrared spectroscopy
I: inhibitor
Icorr: corrosion current
IE(%): inhibition efficiency
IT: immersion time
LE: leaves extract
MS: mild steel
NaCl: sodium chloride
OCP: open circuit potential
OPL: optimal process level
Pc: physochemical
PDP: potentiodynamic polarization
Q: studentized range of means divided by the mean estimated standard error for a set of compared samples
R2: determination coefficient
Rp: polarization resistance
SEM: scanning electron microscopy
SR: scan rate
T: temperature
WL: weight loss

