


 Inglês (pdf)
 Artigo em XML
 Referências do artigo
 Enviar este artigo por email
 Citado por SciELO
  Similares em
SciELO
Similares em
SciELO 
 Permalink
Introduction
With the increasing demand for a cleaner and safer environment, Bg technology has been the target of numerous scholars 1-2. There are vast deposits of municipal waste in numerous parts of the world. Nigeria, in particular, is yet to offer a suitable alternative to the predominant practice of burning these wastes in the open air 3-7.
Additionally, the energy demand is ever increasing with the scaling high population, since African countries that still are behind in power generation need to explore the conversion of vast deposits of organic wastes into Bg 8-9.
AD is a Bg technology that converts organic matter into useable energy (gas), via the action of bacteria that serve as the main degrading agent. In AD, organic matter is broken down (degraded) by enzymes and bacteria, in an O-free environment 10-12.
AD end product is only called Bg when the obtain gaseous fuel constituents include 50-75% CH4, 25-45% CO2, an insignificant trace of water content, within the range from 2 to 7%, and other gases, such as O, H, NH3 and N 13.
Previous studies have shown that grasses are rich in energy substrates, and highly effective in greenhouse gas control 14-15.
Many other organic matters suitable for Bg production have also been exploited, with some recorded success. PD was found to have low C/N ratio and high NH317-18, which is a setback.
Thus, Cd of PD with other high energy substrates, suitable to AD for CH4 yield, was recommended by 19-20.
Substrates Cd was investigated in various works, and reported to produce high biodegradation and bio CH4 yield. In anaerobic Bg production, fermentation is the splitting of a substrate into more fragments, oxides and compounds, according to 10.
Co-generation of PD and OP, along with other additives, was considered by 21.
Co-generation of CSH and CD for Bg generation lasted 45 days. Obtained results were 193 and 33 mL/g VS, for CSH and CD mono-digestion, respectively. Maximum Bg obtained at a 75:25 ratio for CSH to CD was 186 mL/g 22. Optimum Bg production, using PD and CP, was studied. Five different substrate Ct were considered, and the results showed that 75% PD: 25% CP gave the highest Bg of 24.6 L/g VS, at a C/N ratio of 23.4, which was attributed to micro-organisms synergy in the mixture 23.
WWS and olive pomace Cd were used for Bg yield. Cd yield was 0.21 L CH4/g. CH4 yield increased by 17-31% 24.
Co-generation of WWS and fish waste or garden grass caused a 75% increase in fish Ct, and enhanced CH4 yield by 1.9. There was an increase of 25% in CH4, and the addition of 50% grass gave the production rate and final product of 1.5 and 1.7, respectively 25.
Cd of PD with WS and MG, at a blending ratio of 70:30 and 50:50, produced 330.1 and 340.1 N/kg VS, respectively, and gave an average increase in yield of 1.14 and 1.13 times higher than that of the individual plants 26. Another good method for improving AD is process optimization 26-28.
The use of optimization tools, such as RSM, helps to determine the process parameters, and reduces the tedious numbers of experiments 29.
RSM and artificial neural network were used to optimize the process parameters of 30.
RSM was used to optimize the process parameters in bio-H generation from the Cd of CS WWS with BD. Under optimal conditions, obtained results showed that H generation peaked at 1787 mL/L 31.
The present study aimed at modelling and optimizing AD operating parameters, in order to enhance Bg yields from optimized parameters in PD, GS and OP anaerobic Cd. Also, the model equation will aid researchers to produce Bg without wasting time and cost, and reduce the bottleneck in performing rigorous experimental runs.
Materials and methods
Materials collection
The substrates selected for the anaerobic Bg production in this study were PD, WH and GS. PD and GS substrates were obtained in a dry state, free of impurities, within Oghara area of Delta State, Nigeria, while WH was obtained from Ethiope River, in Delta state. None of the substrates was subjected to any form of chemical treatment.
Process optimization
In the experimental design of this work, RSM aided in the quantification of the controllable input parameters relationship with the obtained results. (32) and (33) stated that RSM is used in data for creating approximation models based on physical experimented observation, thus reducing the number of experimental runs needed to provide enough information for statistically acceptable results. In these six experimental setups, categorical and numerical factors were considered using one experimental design factor in RSM. The feedstock combinations for the six setups were: 25% PD:75% WH; 50% PD:50% WH; 75% PD:25% WH; 25% PD:75% GS; 50% PD:50% GS; and 75% PD:25% GS, from 7 to 22 days.
Statistical data analysis
The statistical tool employed in analyzing the performance of the model developed was ANOVA. The interaction between the process parameters and the response of different regression models developed for the five substrates combinations was investigated. R2 represents the quality of the fitted polynomial quality, while F-test was employed to check the statistical significance, using Design Expert version 6. Finally, the model terms were considered using P-value, at a 95% confidence level.
Experimental setup and AD
In this study, 6 AD setups were simultaneously carried out in six identical 500 cm3 cylindrical digesters, for an easy stirring, and were incorporated with slurry inlet, gas collection and thermometer ports. The substrate combination for the six setups was: 25% PD:75% WH; 50% PD:50% WH; 75% PD:25% WH; 25% PD:75% GS; 50% PD:50% GS; and 75% PD:25% GS. Each digester contained 40 g of the respective substrate combinations along with 400 cm2 water, while the slurry was beset to occupy 75% of each digester, which tended to provide enough space for Bg production.
Furthermore, two additional setups were carried out to determine the generated burning gas characteristics, and also to observe the time taken by the digester that received an activated slurry obtained from another functioning digester. Setup 7 determined the yielded burning gas characteristics. It contained 10 g PD, 200 g WH and 1500 cm3 water, which were agitated inside a reagent bottle. In setup 8, time taken to start Bg production by an activated slurry digester was evaluated. 30 g PD, 70 g WH, 400 cm3 slurry and 500 cm3 tap water were weighed inside a 1250 cm3 capacity plastic container. The setup was exposed to ambient T (29 to 32 °C).
Results and discussion
Bg production by anaerobic fermentation of WH and domestic waste
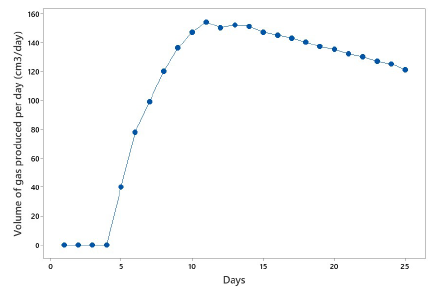
Set-up 1 represented Bg production with PD and WH (Fig. 1). Bg yield began after day 5, due to the microorganism inaction. Likewise, in the inactive period, aerobic bacteria consumed O available within the digester. Thus, acid formation began after all O was used up and Bg production could start. The initial gas produced was C (IV) oxide but, as the fermentation proceeded, more subtracts were produced and digested by present active anaerobes that were enough for CH4 production. Produced CH4 increased steadily before Bg production peaking, on day 11. Subsequently, a gradual decrease in production was recorded. The decrease in Bg yield was due to the total conversion of substrates into CH4. At this point, the substrate available for the bacteria to digest decreased, as well as C or N content availability (10, 34). Therefore, the decline in gas production finished once C and N were consumed.
Required ratios for optimum production
In this work, experimental substrate combinations of PD with organic wastes, such as WH and GS, were considered for optimum Bg yield. The results for Bg generated on a daily basis are presented in Fig. 2. In Bg production, the substrate combination of 50% PD:50% WH was delayed by a day, as compared to the GS samples. This was due to the high cellulose content in GS, and also to the weak presence of bacterial digesters, which made the sample settle before producing Bg. The earliest Bg production was achieved by setups 1 (25% PD:75% WH), 2 (50% PD:50%WH) and 4 (25% PD:75% GS), which began on day 5. This revealed that WH and GS chemical compositions were similar. The highest C/N ratio was obtained by setup 2 (50% PD: 50 % WH), with a Bg volume of 76 cm3 /day, while the lowest one was recorded for setup 6 (75% PD: 25% GS) (49 cm3/day). The bacteria responsible for the anaerobic process consumed C content about 30 times more than N. At favorable Bg production conditions, a C/N ratio of 30:1 is acceptable for any Bg plant raw material 35. A higher ratio than that will result in more leftover C content, after N has been consumed, which will cause the starving of the bacteria contained in the element 36-37. This, in turn, will lead to N restoration into the mixture, slowing the process. The excess of N can cause it to remain at the digestion end, which happens when C has been consumed. Thus, selecting the right C/N ratio will prevent CH4 content loss 38.
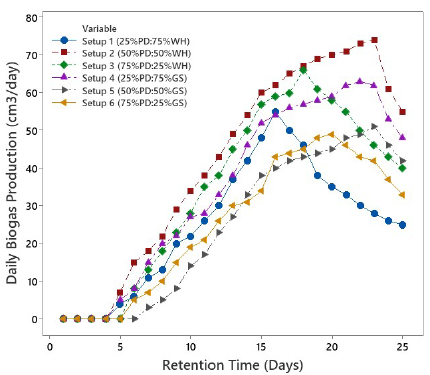
Figure 2: Graph of Bg volume produced on a daily basis by the substrate combinations of PD either with WH or GS.
Results for the determination of burning characteristics
Observations from the experiment to obtain the produced Bg burning characteristics are shown in Table 3. With a Bunsen burner and a match, the produced Bg was ignited (Table 1). The early yielded Bg did not combust, since it was predominantly C (IV) oxide, because bacteria that were able to form CH4 were not fully active yet. Hence, the acid phase was predominant in the digester. Later in fermentation, more CH4 was formed, which aided Bg tendency to burn. At maximum capacity, as methanogens digested the substrate produced by bacteria that generated acid, CH4 aided Bg combustion. There was blue and smokeless flame, and no soot deposition, which depicts CH4 characteristics.
Table 1: Experimental results for yielded Bg burning characteristic.
| Days | Ignition test |
|---|---|
| 1 - 5 | No combustion |
| 6 - 8 | Partial combustion |
| 9 - 22 | Complete combustion |
Results for gas volume in a restarted digester
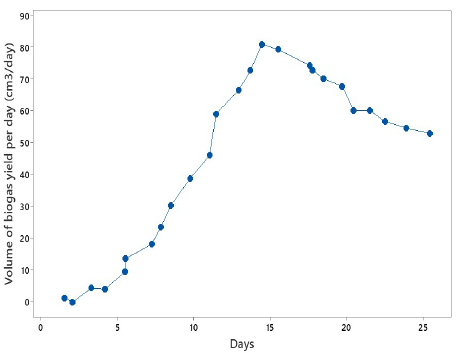
Results from the experimental setup 7 containing a pre-activated slurry, which came from another Bg-yielding digester, are presented in Fig. 3. Bg production started on day 3, while that of setup 1 began on day 5, since it lacked a pre-activated digester (Fig. 2). Furthermore, Bg production in setup 7 peaked earlier. This indicates that using slurry from a preceding digester to set up a new one will aid earlier Bg production, because microbes required for the digestion process are active. However, the time lag was due to O use by aerobic bacteria within the digester. By day 3, O was already consumed, and Bg production started fully, due to bacteria abundance in the setup. Furthermore, already established bacteria fed on the substrate, which accelerated O consume. This explains the increase in produced Bg volume, since the substrate bacteria population grew. Therefore, there were bacteria to digest the substrate and release more Bg in the process.
RSM modelling
ANOVA was employed to investigate Bg yield using the quadratic model, which was deemed fit for the optimization. Table 2 summarizes Bg yield for 32 runs from the various substrates’ combinations. The criteria for accepting the regression model (quadratic model) relied mainly on F- and P-values (42), where that former would compare the developed regression mean square value to the residual mean square. According to Hossain et al. (2017), a developed model can be considered to be reliable and reproducible when F- and P-values are high and low, respectively.
Experimental data consisting of one numerical factor (days) and one categorical factor (substrate Ct), with yielded Bg volume, are shown in Table 5 (32 runs). Data were analyzed using multiple regression techniques, for developing a RSM model. A cubic model was developed and tested for accuracy, using R2 value. ANOVA was performed on the data, in order to determine the significance level of the substrates mixed in different ratios, at p<0.05 (95%).
Table 2: Experimental data showing substrates variables and Bg yield.
| STD | Run | Setup | Factor 1 | Factor 2 | Response 1 |
|---|---|---|---|---|---|
| A: day | B: substrate Ct(%) | Bg yield (cm3) | |||
| 27 | 1 | 4 | 10 | 25 PD:75 GS | 27 |
| 23 | 2 | 3 | 22 | 75 PD:25 WH | 57 |
| 19 | 3 | 6 | 10 | 75 PD:25 GS | 36 |
| 5 | 4 | 1 | 14 | 25 PD:75 WH | 39 |
| 10 | 5 | 2 | 7 | 50 PD:50 WH | 6 |
| 3 | 6 | 1 | 10 | 25 PD:75 WH | 19 |
| 2 | 7 | 1 | 7 | 25 PD:75 WH | 0 |
| 31 | 8 | 4 | 22 | 25 PD:75 GS | 51 |
| 24 | 9 | 1 | 22 | 25 PD:75 WH | 57 |
| 20 | 10 | 5 | 14 | 50 PD:50 GS | 52 |
| 1 | 11 | 1 | 7 | 25 PD:75 WH | 0 |
| 13 | 12 | 2 | 14 | 50 PD:50 WH | 56 |
| 30 | 13 | 4 | 18 | 25 PD:75 GS | 48 |
| 4 | 14 | 1 | 14 | 25 PD:75 WH | 39 |
| 26 | 15 | 4 | 7 | 25 PD:75 GS | 0 |
| 29 | 16 | 4 | 14 | 25 PD:75 GS | 41 |
| 6 | 17 | 1 | 18 | 25 PD:75 WH | 47 |
| 15 | 18 | 2 | 22 | 50 PD:50 WH | 76 |
| 9 | 19 | 2 | 7 | 50 PD:50 WH | 6 |
| 22 | 20 | 1 | 18 | 25 PD:75 WH | 61 |
| 16 | 21 | 2 | 22 | 50 PD:50 WH | 75 |
| 18 | 22 | 3 | 7 | 75 PD:25 WH | 9 |
| 14 | 23 | 2 | 18 | 50 PD:50 WH | 63 |
| 12 | 24 | 2 | 14 | 50 PD:50 WH | 56 |
| 17 | 25 | 1 | 7 | 25 PD:75 WH | 9 |
| 8 | 26 | 1 | 22 | 25 PD:75 WH | 41 |
| 28 | 27 | 4 | 14 | 25 PD:75 GS | 41 |
| 32 | 28 | 6 | 22 | 75 PD:25 GS | 51 |
| 11 | 29 | 2 | 10 | 50 PD:50 WH | 39 |
| 21 | 30 | 3 | 14 | 75 PD:25 WH | 62 |
| 7 | 31 | 1 | 22 | 25 PD:75 WH | 41 |
| 25 | 32 | 4 | 7 | 25 PD:75 GS | 0 |
In ANOVA analysis on Bg yield (Table 3), the model F-value of 556.24 was considerable high, thus indicating the model significance. There was only a 0.01% chance that a F-value model this large could occur due to noise. Prob > F-values lower than 0.0500 indicate that model terms were significant.
Table 3: ANOVA for response surface quadratic model.
| Source | Sum of | DF | Mean | F-value | Prob > F | Significance |
|---|---|---|---|---|---|---|
| squares | square | |||||
| Model | 14681.62 | 8 | 1835.202 | 556.2392 | <0.0001 | significant |
| A (days) | 11001.39 | 1 | 11001.39 | 3334.458 | <0.0001 | Significant |
| B (Ct) | 1370.75 | 3 | 456.9167 | 138.4888 | <0.0001 | Significant |
| A2 | 2193.422 | 1 | 2193.422 | 664.8135 | <0.0001 | Significant |
| AB | 116.0556 | 3 | 38.68519 | 11.72526 | <0.0001 | significant |
| Residual | 75.88399 | 23 | 3.299304 | |||
| Lack of fit | 75.88399 | 11 | 6.898544 | |||
| Pure error | 0 | 12 | 0 | |||
| Cor total | 14757.5 | 31 |
In this case, A, B, A2 and AB were significant model terms. Values greater than 0.1000 indicate the model terms were not significant. Factor A, which is time (days), had the highest F-value of 3334.45 and, thereby, was the most significant on Bg yield. The substrate Ct was significant, with an F-value of 138.48.
The model evaluation results shown in Table 4 had a R2 value of 0.9948.
| STD | 1.816399 | R2 | 0.994858 |
| Mean | 36.625 | Adj. R2 | 0.993069 |
| CV | 4.95945 | Pred. R2 | 0.990848 |
| Press | 135.0647 | Adeq. precision | 68.28444 |
The predicted R2 of 0.9908 is in reasonable agreement with the adjusted R2 of 0.9931. Adequated precision measures the signal-to-noise ratio. A ratio greater than 4 is desirable. The model ratio of 68.284 indicates an adequate signal. This model can be used to navigate the design space. This statistical result shows that the selected model performance was accurate.
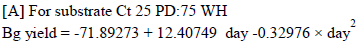
The quadratic model equations developed for the substrates Ct were expressed as follows:
 (1)
(1)
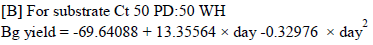 (2)
(2)
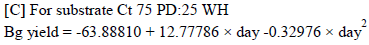 (3)
(3)
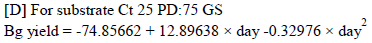 (4)
(4)
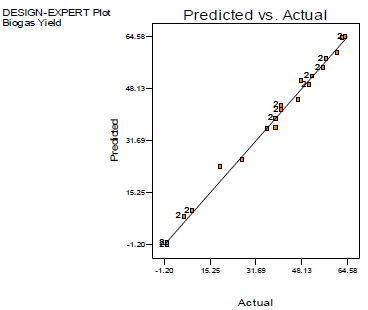
The plots in Figs. 4a-b show the experimental variables with no outliers. The experimental runs align with the straight line, which indicates model accuracy.
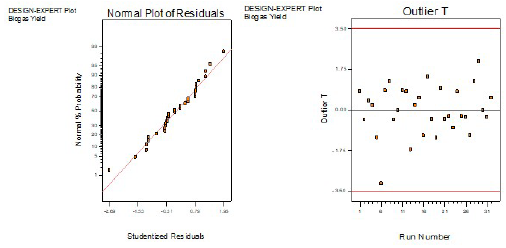
Fig. 5 shows that the data points aligned with the straight line, which indicates how precisely Bg yield was modelled. Predicted R2 value for the developed model was 0.9908, i.e., 99.1% reliability of the empirical model developed for predicting Bg yield.
Effect of variables on Bg yield
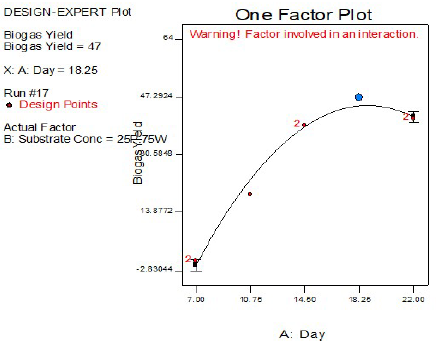
The effect of time on Bg yield volume is shown in Fig. 6. Produced Bg volume was low from day 7 to 14. Bg yield of 47 cm3 was achieved on day 18, and it decreased on day 22, for 25% PD:75% WH (setup 1).
The substrates Ct was plotted against Bg yield, for determining their effectiveness, as shown in Fig. 7. Substrate formulation of 50% PD:50% WH gave the highest yield of 75.56 cm3, followed by 75% PD:75% WH. The lowest Bg yield (setup 6) was produced by 75% PD:25% GS. All Bg yields started being recorded in day 18.
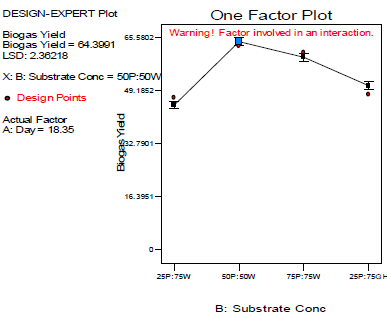
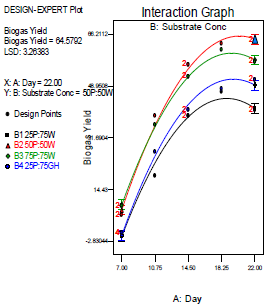
Fig. 8 shows the synergetic effect of time (days) and substrate Ct on produced Bg volume. 50% PD with 50% WH achieved Bg highest yield, on day 22, while 25% PD with 75% WH attained the lowest. On day 22, yielded Bg volume decreased for all the other substrates formulation, while, for 50 PD:50 WH (setup 2), it increased.
Optimization of process variables
Numerical optimization was performed on the experimental data, in order to determine optimum Bg yield with corresponding variables values. The time (days) and the substrate Ct were set in range, while Bg yield was maximized. Optimization solutions are expressed in Table 5.
Table 5: Numerical solutions for Bg yield optimization.
| Number | Day | Substrate Ct(%) | Bg yield(%) | Desirability | ||
|---|---|---|---|---|---|---|
| 1 | 20.97 | 50 PD:50 WH | 75.4195 | 1 | ||
| 2 | 20.51 | 50 PD:50 WH | 75.5665 | 1 | ||
| 3 | 20.66 | 50 PD:50 WH | 75.5331 | 1 | ||
| 4 | 21.03 | 50 PD:50 WH | 75.39 | 1 | ||
| 5 | 19.41 | 50 PD:50 WH | 75.3561 | 1 | ||
| 6 | 19.97 | 50 PD:50 WH | 75.5627 | 1 | Selected | |
| 7 | 21.85 | 50 PD:50 WH | 74.7433 | 1 | ||
| 8 | 21.79 | 50 PD:50 WH | 74.804 | 1 | ||
| 9 | 19.38 | 75 PD:25 WH | 63.8941 | 0.935845 | ||
| 10 | 19.56 | 25 PD:75 GS | 51.2324 | 0.800507 | ||
| 11 | 18.81 | 25 PD:75 WH | 44.8177 | 0.700277 | ||
Eight out of eleven solutions (50% PD:50% WH) reported a desirability of 1, which indicates the best performance of the numerical optimization process. The optimum Bg yield of 75.56 cm3 was produced after 19-20 days. It was selected, since it had a desirability of 1, as shown in Fig. 9. This, therefore, implies that optimum Bg yield can be achieved using PD with WH, at a ratio of 50:50, during 19-20 days.
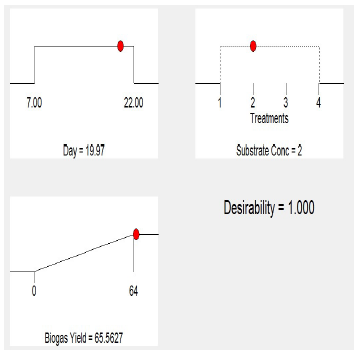
Table 6 compares anaerobic Cd previous investigations with Cd carried out in the present study.
Table 6: Anaerobic Cd from different feed stocks in previous investigations vs. the present study.
| S/N | Ref. | Results |
|---|---|---|
| 1 | 12 | The study evaluated Bg production from Cd of powered SD, CC and GS, using mesophilic bacteria, in the T range from 19 to 48 °C. Digester A (5 (w/w) SD:GS with 12 kg H2O) had peak cumulative Bg yields of 1386 cm3. Digester B (SD, CC and GS, in a ratio of 1:1:1, with 15 kg H2O) cumulative Bg production was 2811 cm3. |
| 2 | 39 | The study optimized bio-H yield from Cd of BD, CS and WWS, using RSM. Peak bio-H production under optimal conditions was 1787 mL H2/L. |
| 3 | 40 | The study utilized a modified Gompertz model to predict kinetic typical parameters of the anaerobic Cd process, in order to obtain CD and HD best combination, for optimum Bg production. Digester D (25% CD:75% HD) had the peak daily Bg yield of 13.8 L/g VS, at production rate l, and shortest lag phase (λ) of 0.69 L/g VS, after 5.20 days, respectively, closely followed by C (50% CD:50% HD), B (75% CD: 25% HD) and A (100% CD), while E (100% HD) had the lowest Bg production. |
| 4 | 41 | The authors investigated Bg yields from anaerobic Cd of CC, peanut husks, coffee shell, sawdust and sugar cane bagasse. The results showed that maximum Bg yield was 126.0 Nm3 CH4 ton /residue. |
| 5 | 42 | The paper generated a mathematical model and optimized Bg yields from Cd of PD, CD and sugar beet root waste. Results showed that variations in C/N ratio, pH and digestion time influenced Bg production. Also, the maximum cumulative Bg yield was in the range from 105.3 to 357.1 mL/g VS. |
| 6 | 43 | The study investigated Cd optimum combination of PD with LCS biomass samples, such as WH and MS. The study depicted that Cd of PD and LCS gave a better yield of Bg and bio-CH4 than their mono-digestion. |
| 7 | 44 | The paper utilized RSM to optimize the feeding combination C:N ratio for enhanced Bg production from the Cd of WS, chicken manure and dairy manure. An optimum Bg product was attained at C:N ratio of 27.2:1, when the DM/CM combination was 40.3:59.7. |
| 8 | This study | This study employed RSM to optimize anaerobic Cd typical parameters, using PD, WH and GS. The results showed that 50% PD with 50% GS had the highest Bg production. Furthermore, the quadratic model developed by RSM was found highly reliable and reproducible, while the model-predicted values were in close range to the experimental values. |
Conclusion
Anaerobic Bg production via Cd of PD combined with GS and WH, was established in this work. RSM application was considered for developing a quadratic model, in order to optimize the process parameters. The optimized experimental parameters were validated using Design-Expert 6.0. Furthermore, ANOVA was used to validate the developed model, considering F- and p-values. Six substrate combinations, labeled setups 1-6, were prepared. It was observed that maximum Bg was obtained in setup 2, which contained 50% each of PD and WH. Setup 6 recorded the lowest Bg yield. Setup 6 presented yielded gas characteristics that recorded no combustion from days 1 to 5, while partial combustion was recorded from days 5 to 7, and perfect combustion from days 8 to the end of the experiment. The effect of an already activated slurry was shown in setup 7, of which Bg yield started on day 3, while that of the other substrates combinations begun on day 5. Bg yield peaked on day 13, while its gradual decrease occurred on day 17. Hence, Cd different results were due to the use of the substrates varied Ct and combinations in the digesters. Finally, it was found that is advisable to initiate a digester with a pre-activated slurry.
Authors’ contributions
U. J. Efetobor: conceived the theory, formulation, and methodology; sourced and analyzed the data; prepared and edited the manuscript. A. O. Onokwai: conceived the theory, formulation, and methodology; sourced and analyzed the data; prepared and edited the manuscript; handled the submission and review processes. E. Onokpite: conceived the theory, formulation, and methodology; sourced and analyzed the data; prepared and edited the manuscript. U. C. Okonkwo: conceived the theory, formulation, and methodology; sourced and analyzed the data. The results were discussed and commented on by all the authors.
Conflicts of interest
The authors declare no conflict of interest.
Abbreviations
AD: anaerobic digestion
ANOVA: analysis of variance
BD: buffalo dung
Bg: biogas
CC: corn cob
Cd: co-digestion
CD: cow dung
CH4: methane
CP: cassava peels
CS: cassava starch
CSH: cotton seed hull
Ct: concentration
CV: coefficient of variation
DF: degree of freedom
GS: groundnut shell
HD: horse droppings
LCS: lignocellulose
MG: meadow grass
N: Newton
OP: orange peeling
P: probability
PD: poultry droppings
R2: correlation coefficient
RSM: response surface methodology
SD: sheep dung
STD: standard deviation
WH: water hyacinth
WS: wheat straw
WWS: wastewater sludge
VS: volatile solid

