


 Inglês (pdf)
 Artigo em XML
 Referências do artigo
 Enviar este artigo por email
 Citado por SciELO
  Similares em
SciELO
Similares em
SciELO 
 Permalink
Introduction
Fish quality is due mostly to its freshness stage. There have been used several different techniques to evaluate the deterioration or the freshness of a lot of commercial species. These techniques can be sensory, chemical, physical and microbiological, and some of those were used in this study. Fish products are easily perishable along the distribution chain, since the capture until the consumption, thus it should be kept always in a safety state, and therefore assuring its freshness index.
The most significate methods to evaluate the fish freshness were TBV-N, refraction index of vitreous humor and texture analysis, which data well represented the samples grade of freshness, and it were coincident with the freshness parameters of the visual exam define in the Regulation (EC) No. 2406/96 of November 26th.
This study aims were to evaluate the freshness stage and hygienic quality of sardines from four different lots of distinct commercial shops in Beja. It was also studied its bromatological composition in order to know the four lots relative differences on its chemical composition and then compare the lots.
Sardine (Sardina pilchardus)
Sardina pilchardus is a bone fish of small size, edible and much appreciated, which is found in East Atlantic Ocean, from North Sea to Senegal and in Mediterranean Sea. It is largely capture and it is always present in most of the markets. It has a huge commercial importance and therefore it is a fish well known.
Sardine (Sardinha pilchardus) is pelagic specie, from Clupeidae family and Cupleiforme Order, being one of the most abundant fishes all over the world.
Its fishing is very important from the economy perspective as well as for feeding. The biological average of biometry of the most important species for capture varies from 17 to 18 cm reached in the 2 to 3 years. It has a slim and long body, subcylindrical, with a rounded womb and with delicate scales; the back as a greenish-blueish colour and the lateral regions and womb have a bright silver colour. The head is pointed without scales with equal jaws with small or no teethes. It has a dorsal fin in the middle of the body, and in the womb region it has two abdominal fins. It is a fish that is usually in a huge shoal, always seeking for warm waters with a larger grade of salinity (Ababouch et al., 1996).
As it was mentioned by I.N.S.A (2007), that the sardine is a source of proteins of high biological level, with a total content of 18,4% and the lipids content of 16,4%, being an omega-3 fatty acids source, and thus presenting 221 kcal/100g of energy. The total amount of water is 63,4% and it is a huge phosphorous source, which is the majority trace element present, as well as a selenium source, which contributes to the hair and nails maintenance, and also has high levels of potassium. Among the vitamins, some of the B group vitamins, as B12, B6, niacin and riboflavin and folates. The sardines also contain large amounts of D vitamin, which contributes to the absorption and regular use of calcium and phosphorous (Ababouch et al., 1996).
Frehsness changes
Some factors as the type of species or the storage conditions may contribute to the grade of species deterioration. The primary changes occur in the skin, eyes, gills and muscles characteristics. The first sensory changes of fish during the storage are related with its appearance and texture. The most evident change is the rigor mortis, since immediately after the muscle demise the fish is completely chilled out, the texture is flexible and elastic, persisting for a few hours but afterwards the muscle contracts. When the muscle contracts and became hard and tough, the all body is inflexible and so it is mention that the fish is in rigor mortis (FAO, 1998).
The fresh sardines are characterized by a bright iridescent colour, aqueous mucus and transparent, domed convex eyes with a black pupil and a convex cornea. The gills are red and with a characteristic odour to “seaweeds”. Along the deterioration, the pigmentation brightness is lost progressively until it becomes opaque.
The mucus loses transparency and becomes turve, milky and finally yellow. The pupils became misty and the eye convexity is lost and turns to flat. The gills lose its bright colour and the odour to “seaweeds” changes slowly to ammonia odour. These observations indicate the rigor mortis, both the colour and odour of the gills, the general aspect, the colour of the pupil and the eyes shape, as the showing up of blood spots surrounding the eyes and the adherence of the scales are valuable attributes to evaluate the sardine’s freshness (Ababouch et al., 1996).
Texture Changes
The firmness is a very important factor to evaluate the fish quality and it is fundamental in the trading moment. The fish softness post-mortem is a quality factor directly influenced by the collagen characteristics present in each species. The collagen degradation is related with the phenomena that occur during storage both in chilling as in freezing storages. In the post-mortem stage, the fish muscle is soft and flexible. Afterwards the muscle contracts. When it becomes hard and the all body is inflexible, it is considered that the fish has reached the rigor mortis state. This state begins approximately 5 hours after demise and finishes 30 hours after when it is storage at 0ºC (Suárez-Mahecha et al., 2007). The sardine in fresh state, after rigor mortis, has a firm texture and elastic to the touch, but along time it became softer and less elastic.
Chemical Changes
After the fish demise several physical, chemical and biological changes began, which will led to its final deterioration. The pH of the muscular tissue in the live fish is around neutral and in the first days after post-mortem the pH decrease due to the formation of lactic acid. In the moment of its demise, the oxygen circulation is interrupt to the muscular tissue because the heart stops pumping blood and no blood reaches to the gills where should be enriched with oxygen. Therefore, and since it stops the aerobic respiration, the production of energy from the intake nutriments is limited. Thus for the energy production the tissue enzymes begin with the oxidation of the storage glycogen or from the fat, which leads to lactic acid production, and consequently to decrease of pH (FAO, 1998). The initial pH post-mortem may differ in function of the specie, of the fishing region, of the year season or even from the conditions of the fish when captured. In a study with Japanese loach (Chiba et al., 1991), it was showed that the exhaustion that the fishes were submitted minutes after the capture may difference in about 0.10 to 0.50 units less in the pH. According to Chiba et al (1998), the most relevant factor el factor for fish texture post-mortem is the pH, since the pH affects drastically the connective tissue properties even with minimal changes.
1. Methods
1.1 Sampling
The sardines used were captured in Alentejana coast. Four different lots of Sardinha pilchardus were evaluated from the four commercial shops (20 sardines/lots) in the city of Beja, in the interior of Alentejo, Portugal.
1.2 Analytical Methods
From each lot were used 20 sardines, from each 5 were directly for microbiology, while the other 15 were evaluated for freshness grade, texture and moisture. Afterwards these samples were minced and frozen for posteriors’ bromatological analysis.
1.2.1 Evaluation of freshness category
Classification of the category of the different sardine’s lots was carried out by the Reg. (EC) No. 2406/96 tables. The sensory analysis of the 15 sardines of each lot had attended the tables of freshness category and the classification was from Extra, A, B and no admitted ones.
1.2.2 Evaluation of biometric parameters
The size classification was carried out by taking the weight of 15 sardines for each lot, and then the measurement of the sardine biometric parameters: thickness in the dorsal and womb, and the width from the operculum to the tail. The purpose of these measures was to determine the edible amount for each lot. By means of the standard NP 1083/1988 it was possible to classify the sardines by its size.
1.2.3 Physical-chemical Analysis
pH Determination
By means of a potentiometer 691 pH Meter and by the standard NP 3441/1990, the pH is determined in meat and meat products. The pH value was measured at 25ºC by a direct reading in the sardines with a punction electrode, and after an incision in the sardines’ womb.
Refraction Index determination
The Refraction Index of the vitreous humor was measured by means of a Refractometer RFM 330. The vitreous humor was extracted with a needle in a syringe from the sclerocorneal region in direction to the bulb centre. It was made a mix sample from the two eyes with a volume of 0,5 ml. After the refractometer calibration with distillate water and a control temperature at 20,7ºC, the analysis were made with three replicates.
Colour determination
Colour is a sensory property which can be measured by instrumental methods. The human eye distinguish the colour, however it doesn’t quantify it, thus there are equipment’s - colorimeters, with a large sensitivity than the human eye, which measurements can be much reproducible and correctly adequate to be correlated with the human perception (Ferro Palma, 2006). For sardines colour determination it was used the Minolta CR 300 by the colour system CIE (L*-Brightness, a*- Red intensity y b*-Yellow intensity). Colour was measured in the dorsal and womb of the sardine in 15 samples per lot. Posteriors it was made a dorsal and womb measurement after removing the skin.
Total basic volatile nitrogen (TBV-N) determination
TBV-N content was determined by the Conway Method by the NP 2930/1988.
Moisture determination
Moisture in fish and fish products concerns the weight lost in those products when submitted to drying by the standard NP 2282/1984. For each lot the assessment was made from an homogenised mix sample of 15 sardines, and it was made three replicates.
Instrumental Texture Evaluation
For texture analysis was used a texturometer TA.XT plus 100 (Stable Micro Systems) with a load cell of 25 kg, and it was made a one cycle test with a 20mm diameter probe. With the sample in the platform, the probe run 5mm each sardines in both the dorsal and womb part. The measured parameter was the muscle firmness (N), in order to compare with the sensory assessment made to each lot.
Protein determination
For protein content was made with the Kjeldahl method, by the ISO-937 (1978) for determination of total nitrogen in meat and meat products.
Fibre determination
Fibre determination was made by NP 2029/1994, and for each lot it was made three replicates.
Total Fat Content determination
Total Fat content was adapt from NP 1974/1986 for each of the different four lots, and previously was done an hydrolysis as mention the Soxhlet method.
Ash determination
Ash content expresses the samples’ mineral content, and it was made by means of the NP 2032/1988. For each it was made three replicates for each lot from a mix of 15 sardines per lot.
1.2.5 Microbiological determination
Microbiological quality was evaluated with the determination of the total microorganism’s count at 30ºC by the NP- 3278/1986 and with the Enterobacteriaceae count by NP 4137/1991 and ISO 6579 /2002. The microbiological analysis was made on the sardines ‘muscle surface and deep in the muscle.
2. Results
2.1 Evaluation of freshness category
The results concerning the sensory assessments to each lot (SA, SB, SC and SD) were classified by freshness category (NP 2406:1996) in: extra, A, B or no admitted. Thus sample SB was Extra, samples SA and SC were category A and sample SD was category B.
2.2 Evaluation of biometric parameters
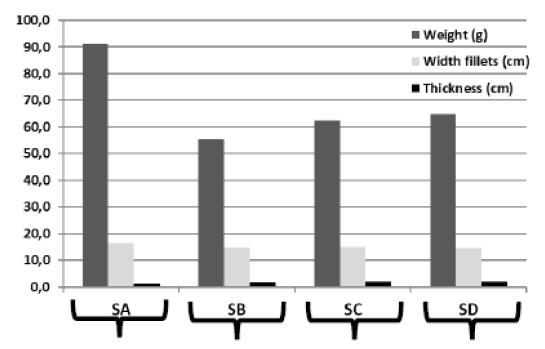
Graph1 it can be observed samples different weight and measurements to 15 sardines of each of the 4 analysed lots. It was possible to observe a distinct difference in sample SA weight and the other samples, which can be due to the difference in width.
2.3 Physical-chemical analysis
Determination of Refraction Index
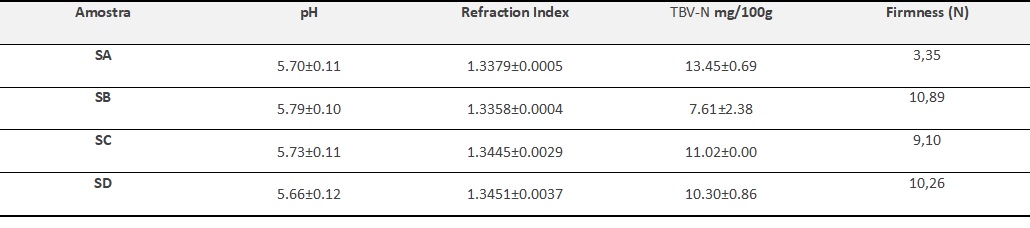
Refraction Index (RI) of the vitreous humor increases with the fish deterioration, as it can be observed on the values of table 1.
Determination of Colour
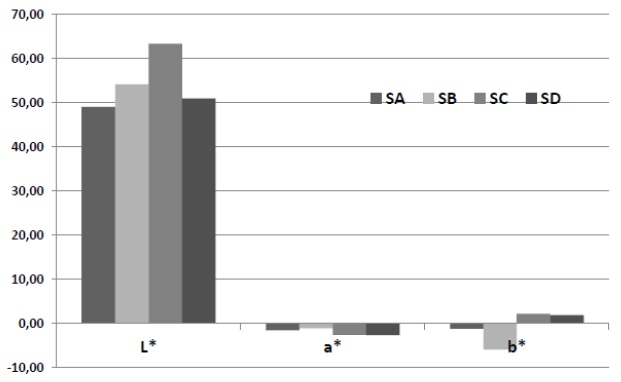
The results concerning the sardines colour, in both the dorsal and womb regions with skin and without skin, can be observed in graph 2.
Total Basic Volatile Nitrogen (TBV-N) determination
Fish deterioration can be evaluated by different chemical index; the total volatiles basis, trimethylamine (TMA) or biogenic amines, lipid oxidation by means of peroxide quantification or by the TBARS index. Total volatiles basis determination (TBV-N) is one of the most used methods, and the results were presented on table 1.
Instrumental texture determination
Table 1 showed firmness (N) values obtained from the texturometer analysis to each lot.
Bromatological Analysis
The results concerning nutritional composition for each lot were presented on graph 3.
Microbiological Analysis
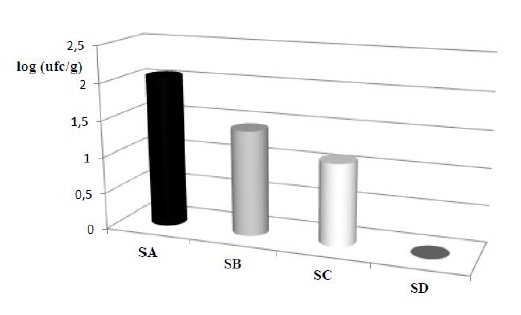
Microbiological analysis results were presented on graph 4 by means of the methods referred on 2.2.5.
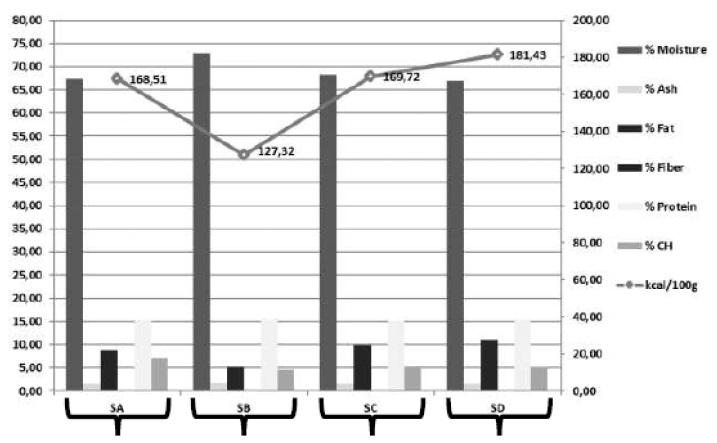
Graph 3 Nutritional composition of each sardines lot (Moisture, Ash, Fat, Fiber, Protein, Carbohydrates)
3. Discussion
From the sensory analysis, it was on sample SA that some of the 15 sardines presented Extra quality, therefore and since in all 15 sardines per lot not all had reached extra quality, this sample had category A freshness quality. Sample SB had presented a remarkable lot since all 15 sardines had Extra category freshness, as its firmness, skin brightness and its colour difference between the dorsal and womb was its clear difference. Sample SC presented A category characteristics, and sample SD had the gills in an advance stage of deterioration with the mucus turve, without the characteristic marine odour, and therefore this lot was B category.
In terms of the biometric parameters, and by means of the Regulation (CE) 2406/96, all lots were in size 1, for exception of simple SA which was in size 2 for presenting a higher weight. In relations to the biometric measurements, it was possible to sign that all lots were very homogenous. Moreover, it was possible to highlight that it was sample SB the one that presented the smallest columns in the graph, since it was the lot with the smallest samples.
As it was mention by Oehlenschläger et al. (1997), the pH value in fresh fish should be less than 7,0. Therefore all samples were in the considerable acceptable limits of fresh fish. This low values could be an explanation for the rigor-mortis status that was showed by the sardines. In this state the decrease in pH value is due to a lactic acid production from storage glycogen in the muscle. However the pH decrease depends, among other factors, also from fishing conditions, and thus the fishing method will influence on the fish glycogen reserves. Therefore if the fish suffers from stress in the capture moment that for sure will affect the glycogen reserve (Soares et al., 1998).
In agreement with the table related with freshness classification (Farber, 1965), the fish in optimal freshness conditions will have a refraction index between 1,3347 y 1,3366, and in good state will present values between 1,3367 and 1,3380, in satisfactory state will present values between 1,3381 and 1,3393, and in no admissible state will present values higher than 1,3394. Therefore, sample SB was the only one with an optimal freshness state, with an average value of 1.3358, which was in the optimal freshness values. Followed by sample SA, which was classified in the freshness values, with a value of 1.3379, and thus in the satisfactory state. However, samples SC and SD had both values with a range above the fresh fish range for consumption, with values between 1.3445 y 1.3451 respectively.
Concerning colour parameters, the L* (brightness) of the sardines womb region presented notable values close to 90, which highlight the brightness of this samples. Related with the dorsal region, it was the SC samples the ones with more remarkable values when compared with the other samples, which fact might be related with fish’s feeding or with fish’s origin. The parameter a* (red-green pigment) presented negative values for all samples, nevertheless not significate in all lots. Notice that this colour parameter in the sardine’s skin had not presented a large relevance. The b* parameter (yellow-blue pigments) in the sardine’s skin womb had presented positive values in all lots for exception of the lot SB where some sardines had presented blue pigments either in the womb regions or in the dorsal region. SB samples had been distinguished in b* parameter (yellow-blue pigments) which had presented negative values in graph 2, and that tendry was reflected only in this lot. Since this lot was remarkable on the other analysis, it might be related the blue pigment with the freshness index. The L* parameter in the muscle decreases when compared with the respective value in the skin, however all sardines had presented positive values and without significate values between lots. The a* parameter (red-green pigments) in muscle had presented positive values and with relevance, hence that the red colour had presented a more significant value in sardine’s muscle, with higher values in the dorsal region and larger resemblance between lots. In the sardine’s womb region, it was the SA lot that had presented a higher red tone.
In TBV-N determination the volatile compounds showed up in distinguish deterioration stages, and therefore this analysis was not the reliable one to evaluate the fish in the first stages, however this method was quite useful to detect more advanced deterioration levels. Its determination was expressed in low weight volatile basis content, and in sardines it was characterized by the formation of ammonium produced from amino acids and nucleotides catabolites deamination. TVB-N values for the different samples was lower than 14 mg/100g, as mentioned in Reg. (EC) No 1022/2008 it should be lower than 20 to 30mg/100g, and therefore the 4 samples respected that criteria. As all samples had presented an acceptable freshness quality, nevertheless it was the SB sample that had shown the lower TBV-N values, which might be related with the RI results, since the SB samples had also presented the lowest ones. In table 1, it was possible to observe that sample SA were the ones with TBV-N higher values, followed by SC sample, and thus these samples are the ones with values more close to deterioration level. However, and since all samples had been below the acceptable freshness values, that fact might had reflected that the samples were in the first stage of storage.
Therefore, this method could not be effective to compare all samples, and thus, in the first storage stage, and by FAO (1998), the TBV-N values could not be estimated.
The instrumental texture values were perfectly comparable with the sensory analysis previously done, in which it was possible to notice that SB sample had presented a very perceptible firmness to touch, followed by SA samples, and then by SD and SC lots, respectively , in the toughness decreasing order. Moreover between the SA and SD the differences were not considerable. However between samples SC and samples SA there was considerable differences. Samples SA had shown the lowest firmness values, which was verified previously in the sensory analysis, and thus it was possible to conclude that SA sample was the most soft and deformable sample to the touch. Accordingly it was possible to conclude in favour of the sensory analysis, that it was SB sample, the one with the highest firmness values.
In the bromatological analysis, all samples had shown high moisture content, mostly due to the fact that fish has a large amount of water in the muscle. As it was already mentioned, and by INSA (2007), sardine is a fish with a high protein content, which fact was possible to notice in all lots, since protein content had shown values of approximately 15%. However, where it was possible to appreciate significant differences was in fat content, which values were found between 5 to 10%. These values were lower than the ones mentioned in INSA (2007), which fact might be related with the season for fishing the sardines. Nonetheless this fact was also related with the moisture content, since when the fat content had presented a lower value than the moisture content was higher.
As a result, sample SB had presented low calories content due to its low fat content, and sample SD had shown a higher calorie content due to its higher fat content. Although the calories values had shown lower than the ones mentioned by INSA (2007) (221 Kcal/100g), it might be due to the also lower fat content values.
Microbiological values for SC and SD samples were coincident to the ones presented by Ababouch et al. (1996), who had registered 3,4x10³ and 1,2x10³ ufc/g for fresh sardines. Notice that the maximum admissible count of total microorganisms for fresh fish products is 106 ufc/g in accordance with the Boletín Oficial del Estado (B.O.E), which defines microbiological standards for fishing products by Royal Decree 1521/1984. Therefore it was possible to consider all lots with good microbiological quality and so with acceptable parameters. Concerning the Enterobacteriaceae, all lots were in the acceptable values in accordance to the B.O.E which stablish the maximum of 103 ufc/g.
Conclusion
The sardines had shown freshness categories of Extra and A, and hence emphasized a satisfactory state for consumption, independently of the commercial origin. Colour had presented significant differences between samples, possibly due to different capture origins. The pH values were acceptable. Microbiological analysis had shown that the samples were within the acceptable values, and therefore with microbiological quality. The sardines presented average nutritional values of 161 Kcal/100g, which are lower than reference values from INSA (2007) nutritional table, eventually due to the low fat content by this time of the year (Spring). The most expounding analyses for the determination of freshness were the TVB-N, the instrumental texture and the Refraction Index.

