


Serviços Personalizados
Journal

Artigo
 Inglês (pdf)
 Artigo em XML
 Referências do artigo
 Enviar este artigo por email
Indicadores
 Citado por SciELO
 Links relacionados
 Similares em
SciELO
Similares em
SciELO Compartilhar

 Permalink
Economia Global e Gestão
versão impressa ISSN 0873-7444
Economia Global e Gestão v.16 n.3 Lisboa dez. 2011
Economic incentives for vertical product differentiation in the Brazilian wine sector
Luca Panzone*, Orlando Simões**, Glaucia Campregher*** , Gabriel Nunes de Oliveira**** & Clailton Ataídes de Freitas*****
*PhD in Agricultural and Food Economics, and is currently Research Fellow at the Sustainable Consumption Institute, University of Manchester (UK). His interest is mainly focused on the analysis of food consumption and demand from a quantitative, applied micro-econometric perspective on households and consumers. E-mail: luca.panzone@manchester.ac.uk
**PhD in Agronomic Sciences, and is currently Associate Professor at the Polytechnic Institute of Coimbra (Portugal). The main areas of interest are Agricultural Economics, Rural Development, and Tourism in rural and natural areas. E-mail: orlando@esac.pt
***PhD in Economic Theory, and has worked in public policy in the State government focusing on local clusters. She is currently Professor at the Federal University of Rio Grande do Sul in Brasil, researching on socio-economic development. E-mail: glaucia.campregher@gmail.com
****PhD student in Agricultural Extension at the Federal University of Santa Maria (Brazil). His main areas of interest are the Rural Economy and Rural Development. E-mail: ambientalgnu@terra.com.br
*****PhD in Economics from the Center of Advanced Studies in Applied Economics, University of São Paulo, and currently is Assistant Professor at the Department of Economics, Federal University of Santa Maria, and at the Graduate Program in Economics and Development. The main areas of interest are Agribusiness Chains, Agricultural Economics, and Quantitative Methods in Economics. E-mail: lcv589@gmail.com
ABSTRACT
While wine is traditionally viewed as a product typical of European and Mediterranean wine producing countries, in recent decades vineyards have developed in all continents. Consequently, wines have been classified as coming from the Old World (traditional European and Middle Eastern producers), and New World (countries who developed their tradition in wine making more recently). Apart from individual taste, the marketing strategy adopted in these two origins clearly differentiates: based largely on the place of origin in the Old World by means of Appellation of Origin labelling; and based predominantly on the vine grown in the New World. Nonetheless, quality segmentation seems to have become more frequent in the New World, as it allows producers to compete in different segments of the market. In this work, we use data from Brazilian wine producing firms located in the Vale dos Vinhedos, State of Rio Grande do Sul, a region producing about 90% of all Brazilian wine. Brazilian firms have recently started to differentiate products by origin-based quality signals; they supply the markets with multiple products and are increasing market segmentation. Within this particular wine district, we estimate a production function for different wine categories, identifying the different factors contributing to the changing marketing strategy in the study area. Results indicate that vertical differentiation is a strategy pursued to optimise the economic efficiency of inputs. In particular, expenditure on product-related inputs (e.g. grape, bottle) are particularly important for lower segments, whilst expenditures in quality-related inputs (e.g. labour) are crucial for high quality wines. Consequently, it appears that vertical differentiation in the wine market is the consequence of economic incentives focusing on efficiency, rather than political or economic rent.
Keywords: Horizontal and Vertical Differentiation, Production Function, Wine, Brazil
Incentivos económicos para diferenciação vertical de produtos no setor dos vinhos brasileiros
RESUMO
Apesar do vinho ser visto tradicionalmente como um produto típico dos países produtores europeus e mediterrânicos, nas últimas décadas as vinhas têm-se implantado em todos os continentes. Consequentemente, os vinhos são classificados como provenientes do Velho Mundo (países produtores tradicionais europeus e do médio oriente) e do Novo Mundo (países com tradição mais recente na produção de vinho). Para além do gosto individual, estes dois tipos de origem apresentam estratégias de marketing claramente diferentes: baseada sobretudo no local de origem no Velho Mundo, através do uso da Denominação de Origem; baseada nas castas das videiras, no Novo Mundo. Todavia, a segmentação pela qualidade tem-se tornado mais frequente no Novo Mundo, já que permite que os produtores possam competir em diferentes segmentos de mercado. Neste trabalho usamos informação relativa ao vinho brasileiro, produzido em empresas localizadas no Vale dos Vinhedos, Estado do Rio Grande do Sul, uma região que produz cerca de 90% de todo o vinho brasileiro. As empresas brasileiras começaram recentemente a diferenciar também os seus produtos com base na origem dos sinais de qualidade, oferecendo no mercado múltiplos produtos específicos, aumentando, assim, a segmentação do mercado. Para esta região vinícola em particular, estimamos uma função de produção para diferentes categorias de vinho, identificando os diferentes fatores que contribuem para a estratégia de marketing na área em estudo. Os resultados indicam que a diferenciação vertical é uma estratégia utilizada para optimizar a eficiência económica dos fatores. Em particular, os gastos em fatores relacionados com o tipo de produto (por exemplo, a uva, o tipo de garrafa, etc.) são particularmente importantes para os segmentos mais baixos, enquanto os gastos em fatores relacionados com a qualidade (por exemplo, o trabalho especializado) são cruciais para os vinhos de alta qualidade. Por conseguinte, sugere-se que, no mercado do vinho, a diferenciação vertical é mais consequência de incentivos económicos baseados na eficiência, do que baseados numa renda de origem política ou económica.
Palavras-chave: Segmentação Horizontal e Vertical, Função de Produção, Vinho, Brasil
INTRODUCTION
Wine production started spreading fairly fast in recent decades to all continents, from historical European countries to the US, Australia, South Africa, Chile and Argentina, whose wines steadily entered European markets. Wine from the New World clearly differentiates from European traditions in the marketing strategy adopted. Old World producers have favoured segmentation by the place of origin of their products, hence by the collective reputation of the area, whose reliability was regulated by the use of Appellation d´origine contrôlée (AOC) labelling (Scanziani, 2004; Marette et al., 1999). On the other hand, producers in the New World have tended to favour marketing strategies based on the vine grape contained in their produce. While the first option corresponds to a mostly vertical product differentiation, the latter actually refers to mostly horizontal product differentiation.
Recently, New World producers have also shown a tendency to differentiate vertically (Schamel, 2006), using a combined strategy that allows producers to compete in different segments of the market. The literature presents mixed evidence regarding the use of a vertical differentiation strategy in the wine sector. In the context of a wine market, AOC labelling corresponds to a specific form of vertical differentiation, which creates an association between land and wine production that is verified by a governmental institution to prevent information-related externalities (Hobbs, 2004).
The wine literature tends to indicate that this strategy is due to the political power gained by lobbying producers, who aim to monopolise power (Stanziani, 2004), which generates only temporary benefits and disperses resources (Kerr, 2006). T he consequences of this strategy are controversial. On one hand, Marette et al. (1999) showed that wine cartels have a potentially important role in preventing information externalities, namely in a segment where high quality is extremely valuable. On the other hand, AOC impose a production constraint on the production function that creates distortions in the trade market, limiting quality improvements and reducing economic welfare (Kerr, 2006). Nevertheless, several developing countries have started differentiating wines based on AOC models following the current debate within the WTO, particularly with regards to wine.
However, we argue that a differentiation strategy presents strong economic incentives, which have received little attention in the wine literature. In particular, a policy that stimulates vertical differentiation based on a geographical link encourages local producers to invest in quality, increasing their presence in different segments of the market. Undoubtedly, this strategy creates a monopolistic component to the competitive aspect of the market, but producers engage in vertical and horizontal differentiation for a series of economic reasons: higher profitability of the AOC market; lower risks of a diversified portfolio of wines; a more rational and efficient use of resources.
The objective of this work is to test whether different market segments allow producers to make a rational use of their economic resources, i.e. whether the production functions of different segments differ. This would mean that vertical differentiation would be a consequence of a rational behaviour aiming at optimising the revenue elasticity of all inputs used by producers, who engage in quality differentiation with a certain return of the extra costs this may entail. We test this by observing a sample of wines produced by a sample of firms in Brazil, a country that only recently adopted a policy protecting geographical indications in the wine market.
The remainder of the paper is structured as follows. The next section explains the industrial economic rationale behind product differentiation, followed by a description of the Brazilian wine sector. The mid sections describe the econometric model used in the paper and the data collection process respectively, with results presented in the before last section. The final section presents the conclusions.
SEGMENTATION
Segmentation in the wine sector is a complex construct. Markets are generally characterised by a large amount of products supplied, and it is often the case that the same producers actually propose several different wines to the market. Consequently, producers have shown a very strong tendency to differentiate their offer horizontally, i.e. supplying a series of substitute products within the same segment, which have a very similar level of quality. This is the case of a differentiation by grape: different wines using different grapes are dissimilar, and it is not possible to establish a quality ranking, as the distinct sensory characteristics of the final products make them equally valuable to consumers. This argument also holds for wines made from the same grape, but from different countries, i.e. a Cabernet Sauvignon from Chile or the United States.
Apart from the creation of horizontal alternatives, wine producers have also tended to pursue a vertical differentiation of their offer, i.e. differentiating by quality level. This type of segmentation implies that producers differentiate their supply offering several alternative wines, which clearly differ in their quality level. This is the case of products using an AOC label, as well as producers marketing products in different price bands (see e.g. Costanigro et al., 2007).
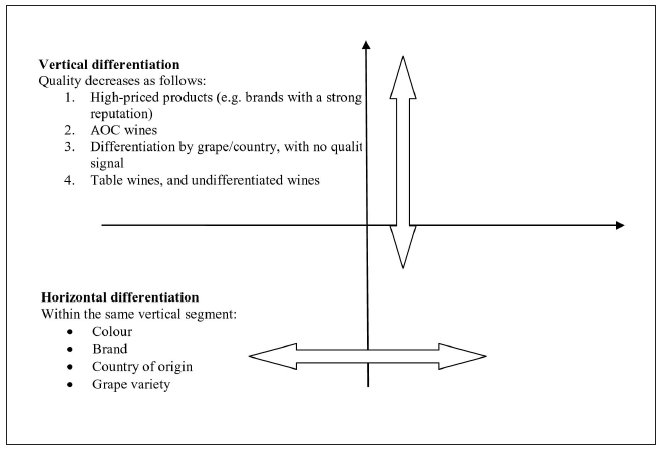
Figure 1 shows a pictorial representation of product differentiation in the wine market. The Y axis represents the different quality levels, while the X axis indicates differentiation within similar quality categories, e.g. by grapes or country of origin, or by different areas for wines with an AOC. The area in the graph represents a continuum of consumers preferences. In this context, producers can choose whether only to focus on a horizontal dimension, or to expand vertically. Most often, the strategy is mixed, supplying one or more good to different quality segments.
FIGURE 1
Product differentiation in the wine sector
Undoubtedly, producers can engage in a differentiation process to accommodate different consumer types, or to specialise in a specific segment (Dickson and Ginter, 1987). Considering only the supply side, there are essentially three reasons for a producer stimulating the creation of a differentiated demand (Dickson and Ginter, 1987):
· To modify consumers' perception of quality, increasing awareness on a specific important characteristic of the products of which consumers may not be aware;
· To change the relative importance of selected factors, which are then associated with a specific product: clearly indicating what differentiates his products from the rest, and explaining how it matters;
· To group a particular segment of consumers with similar preferences, associating the use of a product with a very detailed and specific market segment (e.g. only to families, to parents, or to elderly people).
In the particular case of wine, vertical differentiation can also be a consequence of governmental regulation (see e.g. Kerr, 2006), that endorses the need to protect national or regional products from imitation strategies, and guarantees the establishment of a collective reputation in the area of production.
The Brazilian wine sector is a case in which market differentiation arises from both an institutional and a supply side policy. After the failure of the first introduction of the European vines by Italian emigrants in the nineteenth century, Brazilian wine production started as an undifferentiated product based on Hybrid and American grape varieties coming from North America. Over time, internal wine production started differentiating both horizontally, and vertically.
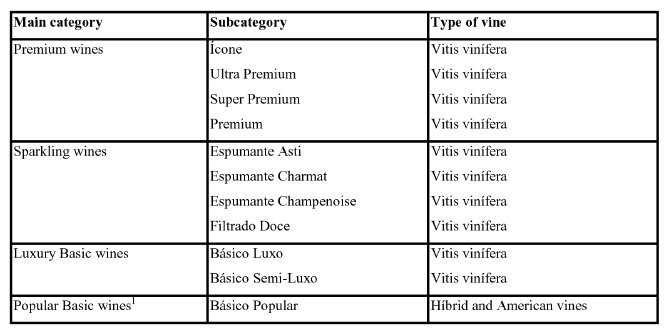
Vertical differentiation started with a change in the use of grape varieties, starting from local varieties and progressively switching toward the use of Vitis vinifera grapes, because of their superior quality (Table 1). Subsequently, differentiation created distinct quality categories, also on the basis of the location where it was produced. In fact, the Brazilian Government gave the Brazilian Patent and Trademark Office (BPTO) the duty to analyse and grant Geographical Indications in the wine sector. As an example, the Vale dos Vinhedos, the area considered in this work, received a quality signal that can be compared to an AOC label. As elsewhere among producing countries in the New World, the horizontal differentiation of Brazilian wines is mainly based on grape varieties and private trademarks.
Vertical differentiation in the Brazilian wine sector
From an economic perspective, differentiation generates an increase in the costs of production which need to be compensated in the market. Namely, Marette and Zago (2003) show that the choice of investing in the production of AOC wines depends crucially on the advantages of lower aggregate fixed costs (e.g. lower marketing costs). At the same time, the existence of a market premium paid by consumers guarantees a return on investment that compensates for the higher costs imposed by productive constraints.
There seems to be little evidence of the economic rationale behind the choice of segmenting wines. What differentiates the supply side of the wine sector from other sectors is the fact that the very same inputs can be used in different ways to obtain distinct final products. Consequently, what differentiates one final product from the other is its ability to increase the value of the original inputs in a different way depending on the process that characterises each wine.
This consideration is crucial for this work, as the rationale for differentiation may arise from the need to maximise the economic potential of the different segments supplied. This would imply that different segments have a specific production function that characterises the wines, and producers optimise the return of their investment in each. Consequently, every input might have different revenue elasticity in each segment, and producers invest in quality considering the different returns they can count on.
THE BRAZILIAN WINE SECTOR
Before presenting the model and the results, it is necessary to include a brief presentation of the Brazilian wine sector. Wine production in Brazil has closely followed the evolution of European emigration. The first European vines were introduced by Portuguese settlers in the sixteenth century, in São Paulo de Piratininga (Cabral, 2007). New vines started being planted in other regions, often with varieties brought from either Portugal or Spain.
However, it was with the Italian immigration in the second half of the nineteenth century that the vineyard became an important economic activity, particularly in Serra Gaúcha, in the State of Rio Grande do Sul (RGS). This period (1870-1920) actually marks the development of the Brazilian wine industry, which was based on the cultivation of American autochthonous vines ( Vitis labrusca) , which performed better in the local climate. The Isabel variety (a natural hybrid) was introduced in this period, and until today it is the most widely grown variety in Brazil. In the mid-twentieth century (1930-1960) viticulture started a diversification process, where European varieties were reintroduced ( Vitis vinifera ), and new hybrid varieties were developed ( Vitis vinifera x Vitis labrusca) . After the 1970s, the market saw an increase in the production of varietal wines, based on vitis vinifera grapes, such as Cabernet Sauvignon, Merlot, and Chardonnay. This change was driven by the entry of multinational companies in the production sector (Tonietto and Mello, 2001). In recent years, in addition to the increased production of wine grapes, increases have been observed in the production of table grapes and grape juice.
Parallel to the private investment in productive structures and associations, there has also been State support through institutions like IBRAVIN (the Brazilian Wine Institute), EMBRAPA Grape and Wine (for research and extension) and SEBRAE (support for micro and small firms), as well as the creation of funds for financial aid, such as FUNDOVITIS, and projects for promotion, such as Wines from Brazil. As a result of these joint actions, the quality of Brazilian wines has increased significantly over the last decade, which has resulted in many international awards, particularly in the sparkling wines and Muscat (a list of prizes can be found for instance at www.enologia.org.br).
In 2007, 90,000 ha of vines were planted in Brazil2, 54% of which is concentrated in Rio Grande do Sul (RGS), 21% in São Paulo and the rest distributed in several other States. As a whole, this area produces about 1.4 million tons of grapes per year. Depending on the years, 50-60% of Brazilian production is intended for table grape consumption, with the rest being used to produce wine, juice and other products (Jeziorny, 2009). Contrary to other States, viticulture in RGS specializes in the production and processing of grapes. Thus, around 90% of grapes produced in this state are used for the production of wine, juice and other products. This state produces about 90% of all Brazilian wine.
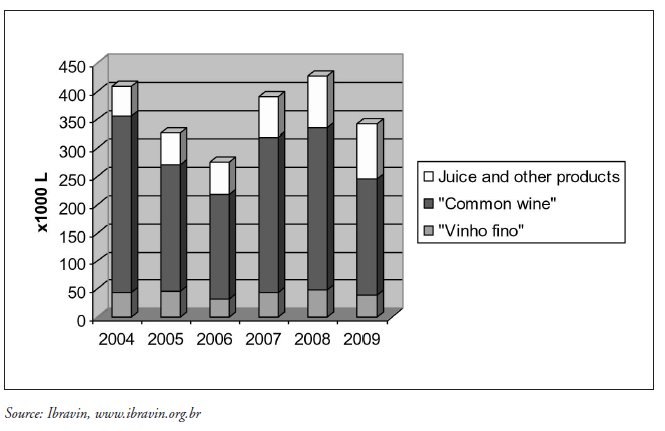
Although the production of vinho fino (fine wine) using Vitis vinifera varieties has increased in recent years, its relative weight is still low in Brazil (the mean of the last three years was 11.3%, Figure 2). The bulk of production still continues to be designated in the Brazilian market by common wine or table wine, which represents 66% of the market, produced with hybrids and American varieties. A significant part of this type of grapes has been diverted to the production of juice, a fast growing segment in the market in last few years (Figure 2).
FIGURE 2
Production of wine, juice and other products derived from grapes in Rio Grande do Sul
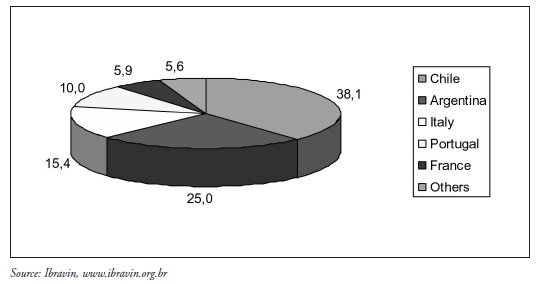
Wine consumption in Brazil is still very low (1.9 litres/person/year), and yet domestic production is not sufficient to meet internal demand. Consequently, wine imports have grown steadily in the last years, especially as a consequence of the reduction in custom duties in 2001. Current imports amount to about 60 million litres annually, mostly from neighbouring countries, such as Chile and Argentina (Figure 3).
FIGURE 3
Brazil: Imports of vinho fino
THE MODEL
In order to test whether different production functions have different revenue elasticity, we use a simple stochastic frontier model. Imagine a market, where producer j supplies the market with product i . Every product consists of a combination of inputs, which characterises it. The final value of the output crucially depends on the value of the inputs used by the producers, and by the level of inefficiency that characterises its production.
Assuming that each product is characterised by an individual production process, every wine is treated independently from all the other wines manufactured by producer j . As in Wadud and White (2000), the starting point is a general production function of the form

where y is the total value of output, and x is a matrix of values of inputs.  is the residual, while
  is the unobservable inefficiency term that characterises each process. Assuming a Cobb-Douglas production function, and applying a logarithmic transformation to both sides of the equation, the model can be linearised and written in the form

where  is the error term of equation (2). The use of a Cobb-Douglas production function is preferred because the coefficients obtained from the estimation of equation (2) (the betas) correspond to the value of the revenue elasticity of each input. Using a half-normal model, the two unobserved terms in the residuals are assumed to be
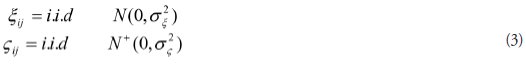
where the inefficiency term is assumed to be strictly positive and normally distributed (See e.g. Coelli et al., 2005, p. 246). From equation (2), it is possible to predict the efficiency term of the economic process that characterises every wine as (Wadud and White, 2000; Coelli et al., 2005)

The restriction on the efficiency term is imposed because this is a multiplicative term, which is forced to be between 0 (perfect inefficiency) and 1 (perfect efficiency). Equation (2) is estimated via Maximum Likelihood using Stata, obtaining both parameters and the efficiency term using stochastic frontier estimation. Results are presented after a short explanation of the data.
DATA
The data used in this study result from a random sample of 55 wine producing firms in a total population of 660 firms recorded in the State of RGS, all specialised in the production of common wine and vinho fino. More precisely, companies were surveyed in the Region of Serra Gaucha (11 municipalities), in the municipality of Santa Maria in the Central Region, and the municipality of Santana do Livramento in the West Border Region. The survey process had the institutional support of IBRAVIN, who provided a list of contacts, and gave logistic support for the interview phase.
The main objective of the surveys was to collect information on the production costs of wine. All fixed and variable costs of the selected companies were collected 3. Information was gathered from all written records of the firms, or inquired from the owner or his representative. All data were collected and allocated to the type of wine produced.
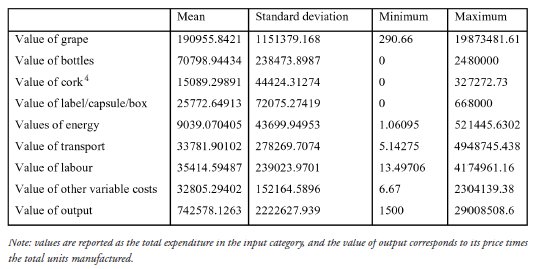
The cost variables were recorded for 31 items, which were later grouped into eight categories (Table 2). The descriptive statistics of the wines included in the sample presented in the analysis is reported in Table 2. The total value of grape was based on its market price or by the opportunity cost of production when it is grown by the firm. The packaging (of wine) included costs of standard glass bottles, PET bottles (various volumes), carboy, and bag-in-box. The stopper and its cost also depends on the quality of wine produced, and may be made in natural cork, pressed cork, rubber or plastic. The group labels, capsules and boxes is the remaining material needed for wine packaging. The remaining items have a straightforward meaning (Table 2), and relate to electricity, transport, and the labour related to the production process (with the exclusion of administrative labour). The remaining costs include all categories not previously considered, e.g. water, cleaning supplies, sewage treatment, paper, etc.
TABLE 2
Descriptive statistics of the wines in the sample (values in Brazilian real)
RESULTS
In order to investigate the revenue elasticity of different inputs in each wine segment, the model estimates a production function for four different wine categories: Popular Basic, Luxury Basic, Premium, and Sparkling wines. While Premium and Sparkling are estimated individually, the Basic segment is divided into two different segments that identify the different grapes used (see Table 1).
In the analysis presented here, results refer to red wines only. The reason to restrict the focus to this part of the market only is the low number of observations in the dataset (14 out of 323 wines, corresponding to 4.3% of the sample) referring to white wines. Furthermore, since there were not enough white wines in certain segments to allow the inclusion of a dummy variable, they were excluded on the grounds of consistency across segments. For simplicity, observations reporting zero expenditure for bottling or cork or other packaging (as is typical of wine sold in bulk) were replaced with the mean expenditure value in the segment, in order to allow for a logarithmic transformation of the variables, and a dummy was included in the estimation5. Data in the regression appeared in million Reais. Finally, in the segments with less than 100 observations, the variance-covariance matrix was estimated with 100 bootstrapping replications. The inefficiency was then estimated as a function of the quality subcategories within each segment. Results of the stochastic frontier are presented in Table 36.
Table 3-Estimated coefficients of the production function per segments
The estimated parameters show that segmentation optimises the use of resources for wine producers. In particular, the elasticity of grape shows a tendency to decrease as quality increases. It goes from a value of 0.67 for Basic Popular, to a value of around 0.19 in the segment of Sparkling wines. The high elasticity for the lowest segment indicates that investments in high quality grape are more valuable here, probably because of the more heterogeneous quality of the final products. On the other hand, grapes used in the top segments already possess a high quality and homogeneous quality level, a feature observed in the intercepts, which are clearly higher for all wines Vitis vinífera varieties.
The contribution of packaging to the final value of the product tends to be highest for the Popular Basic segment, where bottling provides the highest levels of economic efficiency. In the first initial step, moving from the Popular Basic to the Luxury Basic or Premium wines, bottling does not contribute to the final value of the product, as all wines appear in rather homogeneous packaging. On the other hand, other peculiar features of the final product such as labels and capsule gain relevance, so that higher expenditures in these attributes have a significant contribution to the final value of the wine. Finally, expenditures in qualified labour are essential for the marketing of Premium wines, which require high skills to assure a valuable output.
Other technical attributes also suggest the specific importance of certain input for certain segments. Energy is an essential input to increase the value of Popular Basic wines, indicating the importance of energy-using technology to positively contribute to the final value of the wine. Transport is a significant contributor for the final value of Luxury Basic wines, as an increase in expenditure in transport implies the possibility of reaching different markets and improving the final value of the output. Finally, an increase in the value of other inputs (water, cleaning supplies, sewage treatment, paper, etc) increase the value of the output of Sparkling, Popular Basic and Luxury Basic.
The final picture of this analysis shows that expenditure elasticities for each input differ in different segments. As a result, producers can optimise their profits by producing in different segments, obtaining the best return from each input used. A winemaker supplying all segments can count on the highest return for each input, hence optimising the use of his resources. Entering a single segment could be valuable for producers who have a competitive advantage in a specific input (e.g. access to particularly cheap energy, or growing own grapes), but could be limiting otherwise.
Finally, Table 4 presents the average value of the efficiency term for each segment considered. Apart from the Luxury Basic category, all other segments have very similar efficiency scores, which indicate that segmentation does not give substantial advantages in terms of economic efficiency. However, table 3 shows certain sub-segments actually decrease in efficiency with a further vertical differentiation: Icon and Ultra-premium are less efficient than Premium and Super-Premium.
TABLE 4
Estimates of efficiency levels per segment
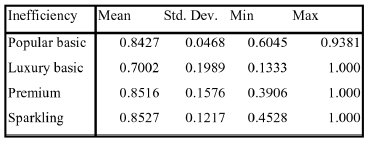
It appears that certain segments, in particular Premium and Sparkling, can count on perfect economic efficiency ( can reach one). Although difficult to believe from a statistical standpoint, this can be explained by the quality of the data. The sample of producers and wines from medium enterprises is relatively under-represented in the present data, which implies that our figures apply to a very homogeneous sample of products. This homogeneity did not allow the perfect estimation of the inefficiency parameters; however, we believe the results are methodologically sound and realistic. Further work should improve the data base to fill this gap and generalise our results.
CONCLUSIONS
Product differentiation is a complex feature in the wine market. The wide variety of products that can be found in most markets originate from a combination of vertical and horizontal differentiation. Furthermore, the decision to supply products in different segments of the market can be both a response to an existing demand and a supply situation. The aim of this study is to observe the reasons why producers engage in a product differentiation process from a supply perspective, purely on the economic rationale that stimulates them to enter different segments.
From the analysis presented in this paper, it appears that product differentiation is actually more than a confusion-making strategy (see Drummond and Rule, 2005), or a strategy allowing landowners to gain economic rent on land (as suggested in Scanziani, 2004 ). Using a different production function for different segments, it is possible to observe that through differentiation producers can optimise their use of inputs. In fact, inputs have different value elasticity when used in the production of wines of distinct quality levels, and producers can maximise the overall benefit from the use of that input by supplying products in more than one segment.
The results presented in this paper show that as the quality segment increases, the elasticity of grape, the essential and basic input for wine, tends to decrease. This benefit of using quality grapes declines in top segments: the average level of this input is generally high and homogeneous, and further increases generate a diminishing value of output. Similarly, expenditures in packaging are extremely valuable in very low segments, while expenditures in embellishment (i.e. Label/capsule/box), technical labour, and transport are beneficial for higher segments only.
Finally, products making use of Vitis vinífera varieties have a higher average market value than those using local varieties and hybrids, ceteris paribus . In fact, the intercept of the production function is clearly higher for those varieties, while rather similar across the Luxury Basic, Premium and Sparkling categories.
The results presented here have the problematic drawback of a low number of observations, which makes estimation unclear in some of the segments included. The low number of producers in the sample (55) does not allow a sufficiently good inference in the two top segments, Premium and Sparkling wines, thus making it difficult to draw any conclusive arguments. Consequently, better estimation would require a larger number of observations for each segment.
Finally, this work only identifies the economic return of inputs in the wine sector per segment, and it does not explore other economic incentives that producers may have for segmenting the market. Consequently, this work only explains part of the rationale used by wine producers in structuring their marketing strategy. Further research in the area would be useful to explain better producers' behaviour in vertical and horizontal differentiation, both inside and outside the wine sector.
REFERENCES
CABRAL, C. (2007), Presença do Vinho no Brasil . 2.ª ed., Editora Cultura, São Paulo. [ Links ]
COELLI, T. J.; RAO, P. D. S.; O'DONNELL, C. J. & BATTESE, G. E. (2005), An Introduction to Efficiency and Productivity Analysis . 2nd ed., Springer, New York. [ Links ]
COSTANIGRO, M.; MCCLUSKEY, J. J. & MITTELHAMMER, R. C. (2007), «Segmenting the wine market based on price: hedonic regression when different prices mean different products». Journal of Agricultural Economics , 58 (3), pp. 454-466. [ Links ]
DICKSON, P. R. & GINTER, J. L. (1987), «Market segmentation, product differentiation, and marketing strategy». The Journal of Marketing , 51 (2), pp. 1-10. [ Links ]
DRUMMOND, G. & RULE, G. (2005), «Consumer confusion in the UK wine industry». Journal of Wine Research , 16 (1), pp. 55-64. [ Links ]
HOBBS , J. E. (2004), «Information asymmetry and the role of traceability systems». Agribusiness , 20 (4), pp. 397-415. [ Links ]
JEZIORNY, D. L. (2009), «Território Vale dos Vinhedos: Instituições, Indicação Geográfica e Singularidades da Vitivinicultura da Serra Gaúcha». MSc Thesis, Instituto de Economia, Universidade Federal de Uberlândia. [ Links ]
KERR, W. A. (2006), «Enjoying a good port with a clear conscience: geographic indicators, rent seeking and development». Estey Centre Journal of International Law and Trade Policy , 7 (1), pp. 1-14. [ Links ]
MARETTE, S. & ZAGO, A. (2003), «Advertising, collective action, and labeling in the european wine markets». J ournal of Food Distribution Research , 34(3), pp. 117-126. [ Links ]
MARETTE, S. N.; CRESPI, J. M. & SCHIAVINA, A. (1999), «The role of common labelling in a context of asymmetric information». European Review of Agricultural Economics , 26 (2), pp. 167-178. [ Links ]
SCHAMEL, G. (2006), «Geography versus brands in a global wine market». Agribusiness , 22 (3), pp. 363-374. [ Links ]
STANZIANI, A. (2004), «Wine reputation and quality controls: the origin of the AOCs in 19th century France. European Journal of Law and Economics , 18, pp. 149-167. [ Links ]
TONIETTO, J. & MELLO, L. M. R. (2001), La quatrième période évolutive de la vitiviniculture brésilienne: changements dans le marché consommateur du pays. In 26th World Congress of OIV, Congress Proceedings. Adelaide, OIV, vol. 3, pp. 272-280. [ Links ]
WADUD, A. & WHITE, B. (2000), «Farm household efficiency in Bangladesh: a comparison of stochastic frontier and DEA methods». Applied Economics , 32 (13), pp. 1665-1673. [ Links ]
NOTES
1This category includes undifferentiated wines, in bottle or bulk.
2All data in this section are from Ibravin, www.ibravin.org.br.
3In this work, only variable costs were used.
4Despite using the term cork in the paper, this category actually includes all the type of stoppers used to seal a bottle of wine.
5The values of these three dummy variables are omitted in the presentation of the results, to avoid unnecessary crowding of the table.
6The pooled equation (columns 2 and 3) is included only for a matter of comparison, and it is not commented in the text.
