Serviços Personalizados
Journal

Artigo
 Inglês (pdf)
 Artigo em XML
 Referências do artigo
 Enviar este artigo por email
Indicadores
 Citado por SciELO
 Links relacionados
 Similares em
SciELO
Similares em
SciELO Compartilhar

 Permalink
Economia Global e Gestão
versão impressa ISSN 0873-7444
Economia Global e Gestão v.16 n.3 Lisboa dez. 2011
Cooperation and best practices within the COTEC Innovative SME Network
Paulo Bento*, Helena Pinto de Sousa** & Miguel Almeida***1
*PhD in Management Science (The University of Manchester). Assistant Professor (ISCTE Business School). Editor (Global Economics and Management Review). Coordinator (Audax-IUL). Researcher (Business Research Unit). E-mail: paulo.bento@alumni.mbs.ac.uk
**Master in Finance (London Business School). Invited Assistant Professor (ISCTE Business School). Director of Quality and Innovation (Agência Nacional de Compras Públicas). E-mail: hdesousa.mifft2000@london.edu
***PhD student (joint program of the Aalto University and the Universidade Técnica de Lisboa). Researcher (Telecommunications Institute). E-mail: malmeida@lx.it.pt
ABSTRACT
This article investigates what members consider to be the advantages of cooperating with and belonging to the COTEC Innovative SME Network, and identifies which have been and should be the best cooperation practices. These advantages were measured through enquiries conducted at the beginning of 2008 and 2010, while the best practices were assessed by means of both the 2010 enquiry and the Innovation Scoring (IS). The results were not always conclusive or robust; nevertheless, we found that the three main advantages cited in 2008 were repeated in 2010 and that there are a number of statistically significant relationships between some selected advantages and categories such as ICT sector, manufacturing industry or collaborative profile technological partner. Although the crossing of best practices (past and future) with the IS was inconclusive, the results could serve as a reference for COTEC and its members.
Key words : Cooperation, Network, SME, COTEC
Cooperação e boas práticas na Rede PME Inovação COTEC
RESUMO
Este artigo investiga aquelas que, no entender dos seus membros, são as vantagens de cooperar e pertencer à Rede PME Inovação COTEC e, ainda, aquelas que têm sido e que devem ser as melhores práticas de cooperação. A exploração das referidas vantagens fez-se a partir de inquéritos, levados a cabo no início de 2008 e de 2010, enquanto as melhores práticas foram avaliadas com base nas respostas ao inquérito de 2010 e no «Innovation Scoring» (IS). Os resultados nem sempre foram conclusivos ou robustos; contudo, constatámos que as três principais vantagens de 2008 repetiram-se em 2010 e que existiam algumas relações estatisticamente significantes entre certas vantagens selecionadas e categorias como sector TIC, indústria transformadora ou perfil colaborativo «parceiro tecnológico». Em relação às melhores práticas, passadas e futuras, o cruzamento com o IS revelou-se inconclusivo; ainda assim, os resultados poderão servir de referência à COTEC e aos seus membros.
Palavras-chave : Cooperação, Rede, PME, COTEC
INTRODUCTION
COTEC Portugal – Associação Empresarial para a Inovação (henceforth COTEC) is a corporate association for innovation and its membership includes some of the most proactively innovative Portuguese companies. Set up in 2003 as part of a Presidency of the Republic initiative, COTEC has currently more than one hundred associate companies (henceforth associates2.
COTEC has four main activity areas: i) knowledge enhancement; ii) sustained development of corporate innovation; iii) innovative SME; and iv) cross-sectional projects3. The COTEC Innovative SME Network (henceforth Network) was set up in 2005 under the third of these areas.
The Network is the object of analysis of this article. It was created for the development of SME skills and has the following goals: i) to establish cooperation among Network members, as well as between members and associates; ii) to provide specific support in growth stages, notably by attracting investment and supporting internationalisation; iii) to promote public awareness of a group of SME whose innovative attitude and activity make them examples of value creation for Portugal4.
Companies with an annual turnover of over 200,000 can apply to become members of the Network. An evaluation committee created specifically for this purpose deliberates on the application and their decision is reached using an online system of Innovation Scoring (IS)5; this system is also used for the annual reassessment of membership status. The membership fee is the same for all members.
The Network was initially formed with 24 companies and its members have increased five-fold in five years. Thus, it is pertinent to identify and understand what members perceive to be the advantages of cooperating with and belonging to the Network, and also their perception of current best practices of cooperation with both other members and associates, as well as of what these practices should be in the future. These are the issues tackled in this exploratory article in line with the aforementioned goal of fostering cooperation among Network members, and between members and associates.
ADVANTAGES OF COOPERATION AND NETWORK MEMBERSHIP
This analysis of the perceived advantages of cooperating with and belonging to the Network begins with a comparison of the appraisal made by its members at two distinct times: the beginning of 2008 and of 2010. However, we start by presenting the definition of cooperation used in this article: a process through which two or more organisations coordinate their actions in a given domain of action, with the goal of obtaining certain results together COTEC (2009, p. 83)6. Moreover, like COTEC, we use the terms cooperation and collaboration interchangeably.
In 2008, a 61-question enquiry was submitted to the 54 Network members to which 30 out of a total of 54 (56%) valid responses were received – Cardoso et al. (2008). Two years later a new 24-question enquiry was submitted, and 88 valid responses were gathered from a total of 124 members, corresponding to a 15% increase in the reply rate. More importantly, this represents a nearly three-fold increase in the absolute number of replies.
Due to the low absolute number of replies in 2008, which hinders the validity of the results obtained and ensuing generalisations, and also to the fact that the 2010 enquiry had deeper and more focused objectives, the comparative analysis of the results is somewhat limited. Nevertheless, a fruitful comparison is made based on a question that is common to both enquiries, followed by a more detailed investigation of the 2010 results.
2008 versus 2010
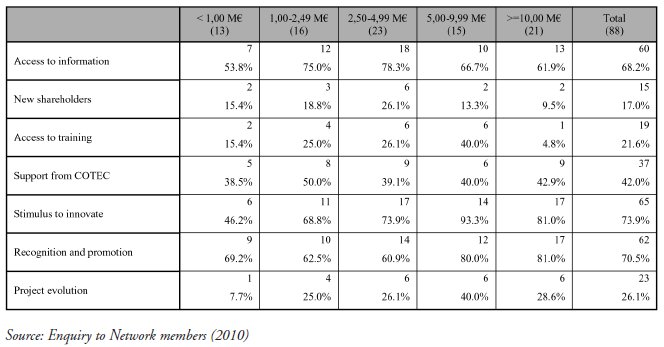
Table A7(see appendices) depicts the evolution of what members perceive as the advantage(s) of participating and cooperating in the Network – the enquiries allowed the choice of several or none of the sixteen options. In addition to relative frequencies (columns 3 and 6), also reflected in Figure 1, this table includes absolute frequencies (columns 2 and 5), their ranked positions (columns 4 and 7) and, finally, the changes in relative frequencies (column 8) plus the ranked position (column 9).
FIGURE 1
Advantages of participating and cooperating on the Network
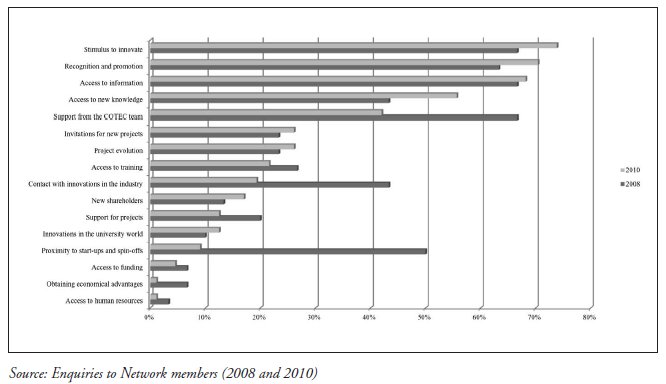
Generally, the relative frequency of these advantages decreased from 2008 to 2010 in 50% of the cases, in particular for proximity to start-ups and spin-offs (-40.9%, down 8 positions), support from the COTEC team (-24.6%, down 4 positions) and contact with innovations in the industry (-24.0%, down 3 positions). This is probably explained by the increase in the number of members, which inevitably reduces the Networks homogeneity (e.g. the percentage of members from the ICT sector went down from 63.3% to 41.5%), and also the speed of this increase, which may have temporarily limited the response capacity of the COTEC team. However, new enquiries are necessary to understand if these changes are spurious or real.
On the other hand, and in stark contrast with the aforementioned decreases, the three main perceived advantages of participating and cooperating in the Network (stimulus to innovate; recognition and reputation; and access to information) remained in place from 2008 to 2010, and all their relative frequencies increased. In this case, and without disregard for the importance of future enquiries, the results are important indicators of the main motivation of the members and should be taken into account by both COTEC (in its activities) and its members (in their cooperative relations within the Network).
As an in-depth and parallel treatment of the 2008 and 2010 results is not possible, a thorough analysis is now made of the 2010 results.
2010 – Foreword
It would be cumbersome and perhaps meaningless to present comments on all the values in Table A: the frequencies of some of the advantages are clearly low, making them marginal in the cross-tables which support the following analysis. Thus, after a first analysis of the data, the sixteen advantages were grouped into the following seven categories, which are also depicted in the table:
· Stimulus to innovate;
· Recognition and reputation;
· Access to information and knowledge;
· Support from COTEC;
· Project evolution;
· Access to training;
· Access to new shareholders.
Bearing in mind the relative importance of the advantages within each of the seven categories, in the following analysis, mention is only made of the most representative advantage of each category. Thus, the main advantages of participating and cooperating in the Network are now presented in decreasing order of importance (figures in brackets are from the 2010 enquiry):
· Stimulus to innovate (73.9%);
· Greater social recognition and promotion of the company (70.5%);
· Access to relevant information (68.2%)8;
· Access to support from the COTEC Innovative SME Network team (42.0%);
· Possibility of evolution of the corporate project (26.1%);
· Easier access to training networks, new qualifications and skills that are adequate to company needs (21.6%);
· Access to new shareholders and new partners (17.0%).
Tables B to H (see appendices) are the result of a deeper analysis of these perceived advantages, specifically through cross-tables between these advantages and some categories (e.g. whether a company belongs to the ICT sector) so as to explore possible relationships and response patterns9. These categories are derived from questions which were included in the general enquiry made in 2010, but are not subject of further analysis in this study.
The results of some of these cross-tables are not explored in the following analysis due to the small number of observations (e.g. 88 observations distributed in a 2-by-6 table). In other words, despite the initial interest, the results of these cross-tables are sometimes of no statistical significance; the continuous variables of dimension (using the number of workers as proxy), intensity of collaborative internationalisation (weight of the international cooperation relationships relative to the total number of cooperation relationships) and collaborative density index – CDI (average value of the cooperation intensity in the relationships that Network members establish with other members)10are examples of this lack of significance, as are the categorical variables suggested by the taxonomies of Pavitt (1984), Evangelista (2000) or Jong and Marsilli (2006).
With these exclusions, Tables B to H show the absolute and relative frequencies indicated by members as advantages of cooperating with and belonging to the Network, crossed by each of the following categories:
· Proactivity index (PI);
· Number of innovation types (NIT);
· Collaborative profile (technological partner or other type of partner);
· Business model;
· Belonging or not to the ICT sector;
· Belonging or not to the manufacturing industry;
· Dimension (annual turnover)11.
The first four categories are now detailed as they stem from questions in the general 2010 enquiry, the results of which are not analysed herein:
· Subsequently to the CDI, the PI was created as a result of the number of relationships where the member is the driving force of the cooperation with other Network members, divided by the total number of relationships that member has with other members (varies between 0 and 1).
· Network members indicated whether they introduced innovations at the product/service level, process level, marketing/commercial level or organisational level during the 2007-2009 period, resulting in a NIT score of 0, 1, 2, 3 or 4.
· The definition of collaborative profile, derived from another question in the general enquiry, originated several types of collaboration, resulting from the specific types of partner with whom the Network members cooperate. Four collaboration profiles were thus defined: value chain (interactions with clients, complementary companies, competitors, distributors and suppliers); entities from the scientific and technological system (technological infrastructures – including technological centres –, universities and university R&D institutes, State-owned laboratories and associate laboratories); technological partners (suppliers of technological solutions which allow members to build its value propositions)12; others (consultants, regulators and others).
· The categorisation of business models is far from established; however, such a debate is beyond the scope of this article13. Therefore, we use the categorisation defined in the context of the general enquiry, which may be summarised as follows. The cluster analysis was performed using the following core variables: goods/services (capturing the characteristics of the companys activity as a whole); standardisation/customisation (aimed at characterising the companys value proposition and its relationship with the clients); in-house/outsourcing (with a view to characterising how the company sets its value proposition); online/offline (attempting to characterise the level to which the company adopts the digital economy and the way it establishes relationships with its clients); producing/licensing (aimed at assessing to what extent the company is focused on exploring internal knowledge or, on the contrary, is adding value directly from the trading of that knowledge). In the end, the online/offline and the producing/licensing variables showed no discriminating power and five clusters were defined: customised services (from an internal action perspective); services with outsourcing; standardised services (from an internal action perspective); standardised products; and customised products.
The following analysis is supported by the cross-tabs that were generated, and the results suggest the existence of relationships to some extent between the advantages of participating and cooperating in the Network and the aforementioned categories. The term suggest is deliberately used, and some results should be interpreted cautiously: the significance level was sometimes relaxed (from 5% to 10%), and there was a small number of observations for some situations (after the crossing). Furthermore, to graphically clarify the reading without compromising the relevance of this analysis, an ad hoc normalisation was used by computing the differences of the values within the category relative to the sample frequencies14.
2010 – Analysis
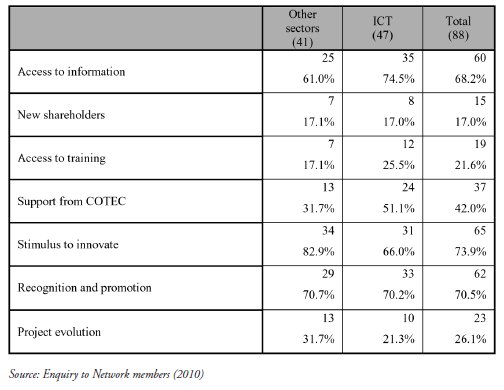
An analysis of Figure 2 indicates that belonging (47 out of 88) or not belonging (41 out of 88) to the ICT sector does not influence the selection of the advantages recognition and reputation and new shareholders15. On the other hand, stimulus to innovate and support from COTEC should be highlighted. In the former case, Network members that are not in the ICT sector are more likely to consider this advantage important. In the latter case, the reverse effect is observed: members in the ICT sector are more likely to signal this advantage as valuable. Importantly, it should be noted that both these relationships are statistically significant (marked in the figure with an asterisk). This is not the case for access to information, project evolution and access to training, where the observed differences are not statistically significant.
Advantages of participating and cooperating on the Network vs. (not) belonging to the ICT sector
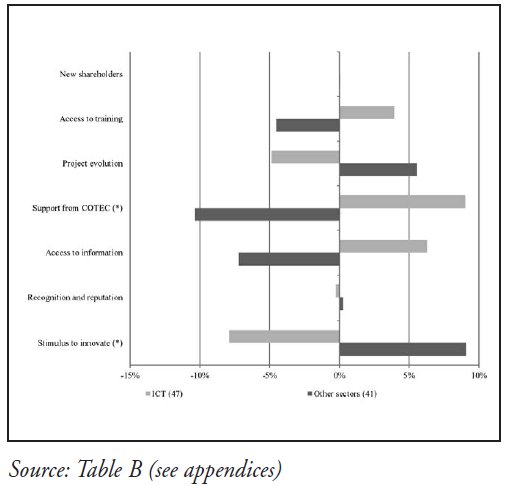
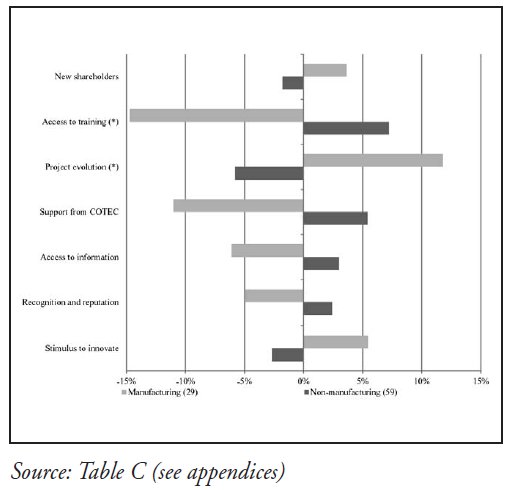
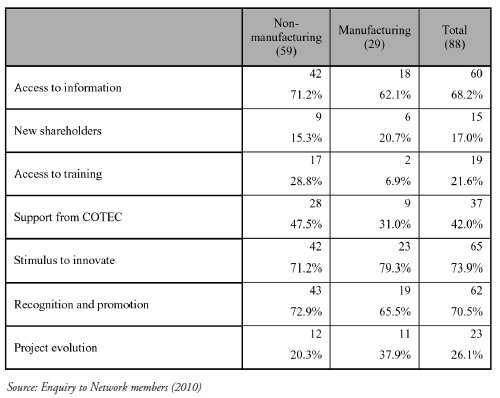
Figure 3 crosses the same seven advantages with the condition of whether the Network member belongs to the manufacturing industry. Once again, two advantages are natural highlights: project evolution and access to training. These are not only the advantages with the greatest differences, but they are also the ones with statistical significance (marked in the figure with an asterisk). In spite of the visual cues, this cannot be stated for the remaining advantages, i.e., there is no statistical confirmation that the observed differences between members in the manufacturing industry and remaining members are not random.
FIGURE 3
Advantages of participating and cooperating on the Network vs. (not) belonging to the manufacturing industry
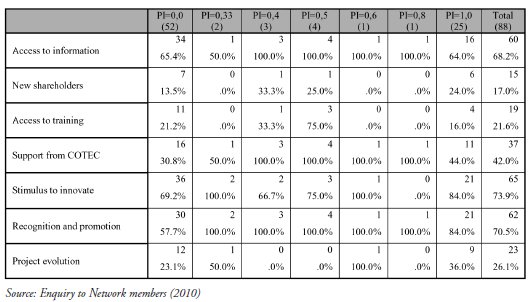
Unlike the two previous cases, Figure 4 does not result from 2-by-2 cross-tables. Therefore, and considering the number of samples, it is naturally more difficult to interpret. Through visual inspection one can conclude that, overall, there is no apparent consistency between the type of response and the PI. The low absolute frequency of partial PI values hinders conclusive comments; however, the association, if any, is only regarding recognition and reputation and support from COTEC: more proactive members identify these two as advantages more frequently than less proactive ones.
FIGURE 4 - Advantages of participating and cooperating on the Network vs. proactivity index (PI)
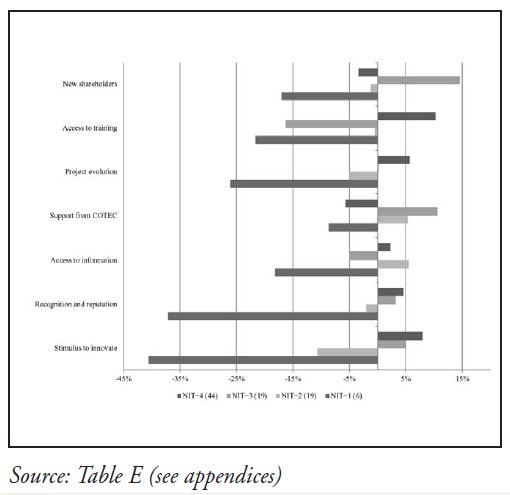
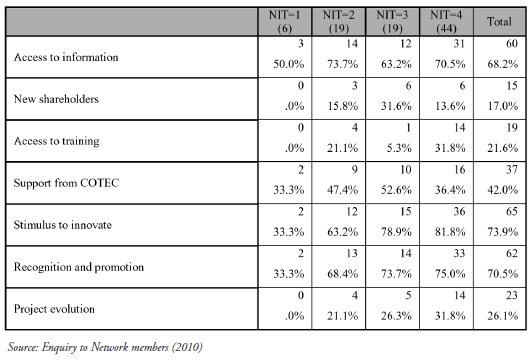
By crossing the advantages and the NIT in the 2007-2009 period, Figure 5 indicates that the members NIT influences the selection of stimulus to innovate and access to information. As a (perhaps foreseeable) example, members with NIT = 1 or even NIT = 2 report that the Network is a stimulus to innovate less frequently.
FIGURE 5
Advantages of participating and cooperating on the Network vs. number of innovation types (NIT)
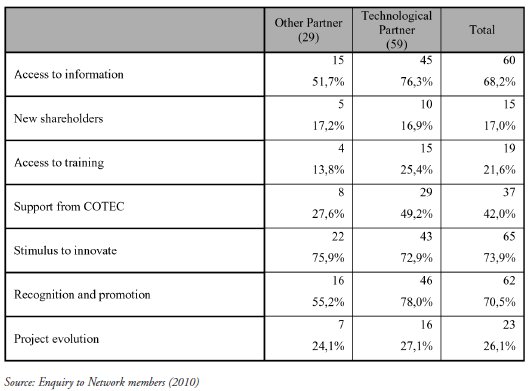
Another interesting perspective is provided by crossing the advantages with the type of collaborative profile mentioned above. However, again because of the limited number of samples and because one is dealing with 2-by-6 cross-tables, only non-significant results can be obtained, with one exception: the collaborative profile technological partner. In Figure 6 a relationship can be detected between the selection of three advantages and the collaborative profile when the cooperation is with technological partners. The 29 members without that profile are less likely to indicate the advantages support from COTEC, access to information and recognition and reputation as important. Statistical tests confirm that these three relationships are unlikely to be spurious (marked in the figure with an asterisk).
FIGURE 6
Advantages of participating and cooperating on the Network vs. collaborative profile (technological partners)
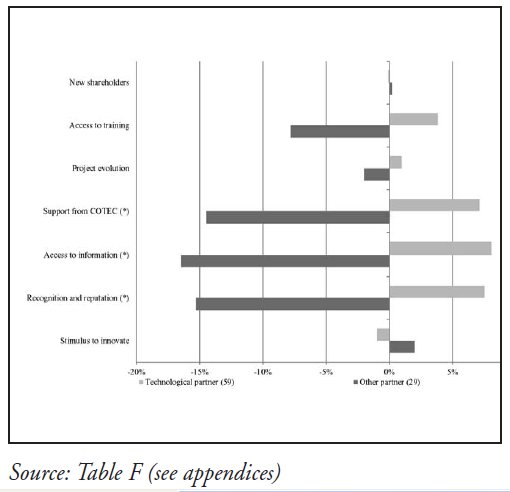
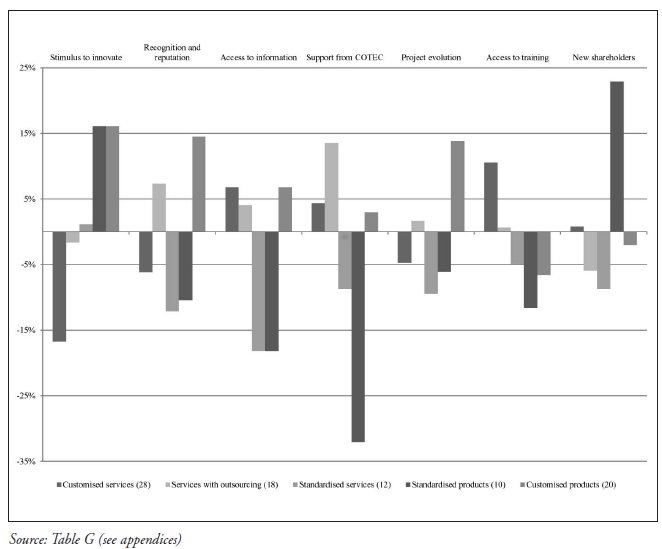
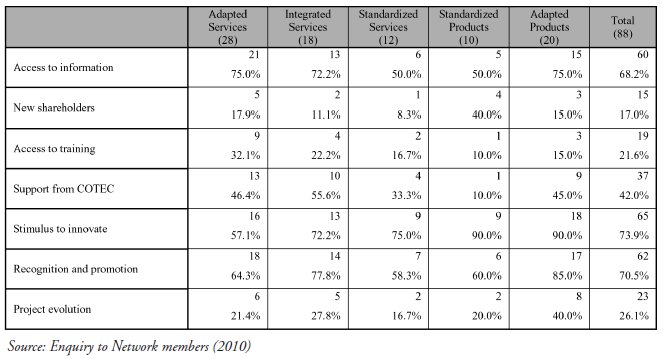
Figure 7, the second-to-last from the crosstab-based figures, is inconclusive relative to the crossing between the aforementioned advantages and the five types of business model. In fact, even statistically, there are only hints of a relationship between the business model and the selection of stimulus to innovate. If true, this relationship would mean that members with the customised services model feel their presence in the Network is a much smaller stimulus to innovate, contrasting mostly with members whose models correspond to standardised products or customised products.
FIGURE 7
Advantages of participating and cooperating on the Network vs. business model type
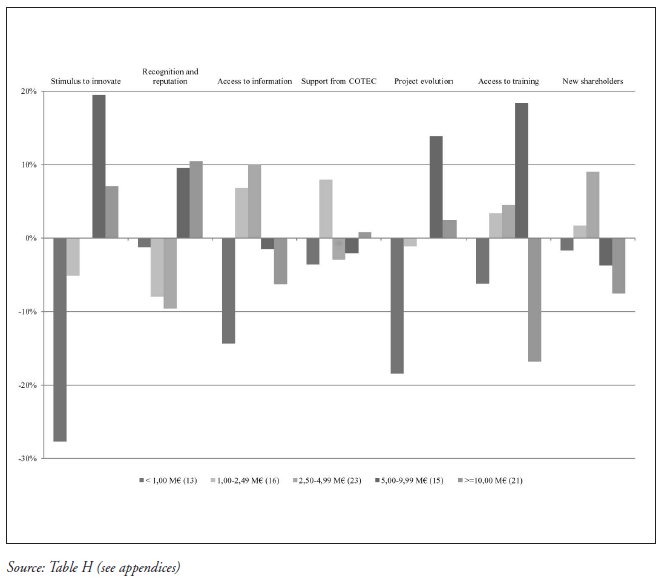
Finally, the variation of the perceived advantages with the members dimension was tested, using turnover as proxy. Figure 8 depicts something that the statistical treatment also suggests: if there is any relationship, it is only between dimension and stimulus to innovate (members with turnover < 1 M less frequently feel that belonging to the Network is a stimulus to innovate, with the opposite happening for members with turnover in the 5.00-9.99 M).
FIGURE 8
Advantages of participating and cooperating on the Network vs. dimension (turnover)
In spite of the above mentioned limitations of this detailed study of the advantages of participating and cooperating in the Network, the results can be summarised into two final considerations: i) the main advantages of belonging to the Network in 2008 were confirmed in 2010, with a substantially larger sample, providing important insights into the Network members expectations not only for COTEC (to try and meet those expectations), but also for members (allowing their mutual relationships to become more fruitful); ii) a stratified analysis of these advantages yields interesting interpretations, allowing the identification of certain patterns and relationships which are in some instances statistically significant (when the remaining members are split between those who belong to the ICT sector, those who are in the manufacturing industry, those whose collaborative profile is based on technological partners or those that have more types of innovation).
BEST COOPERATION PRACTICES
This point is mostly based on an open question from the 2010 enquiry in which members were asked to indicate examples of good practices within the Network. With the aim of enriching this analysis, an association was sought between the answers to this question and the answers to the following questions of the IS: 2 (whether the organisations values promote international openness), 21 (whether the company develops systematic cooperation actions for innovation with external entities), 22 (whether the company encourages multiple forms of networking) and 34 (whether the company has systematic mechanisms for the adoption of good practices).
Since this was an open question, it was necessary to group the answers into a set of categories as depicted in Table 1, in decreasing order of importance. Whenever an answer could not be grouped with other answers, it was excluded for the following reasons: its marginal importance; the need to create a new category; the need to protect the respondents identity.
Best cooperation practices (past)
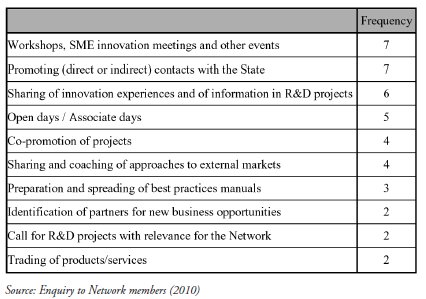
Table 1 presents the absolute frequencies of these cooperation practices, instead of the more common relative frequencies which would mask the limited number of answers to this question. In spite of the reduced response rate, this was a deliberate option since the analysis of these values was considered important for the assessment and validation of the best practices sponsored by COTEC. The table is self-explanatory and, along with the previous point regarding advantages of belonging to and cooperating in the Network, provides interesting clues for COTEC to (continue to) create action proposals which meet both its members wishes and the Networks goals, in particular establishing cooperation among Network members and between them and the associates.
Besides listing the good practices identified by the members again in decreasing order of importance, Table 2 summarises the attempt to cross such practices with the responses of the members to the four previously mentioned questions in the IS16. As an example, the number 3.50 in the first row and third column should be read in the following manner: the response to question 22 of the IS of the 7 members that mentioned workshops, SME innovation meetings and other events17is on average 3.50.
Best cooperation practices vs. Innovation Scoring (past)
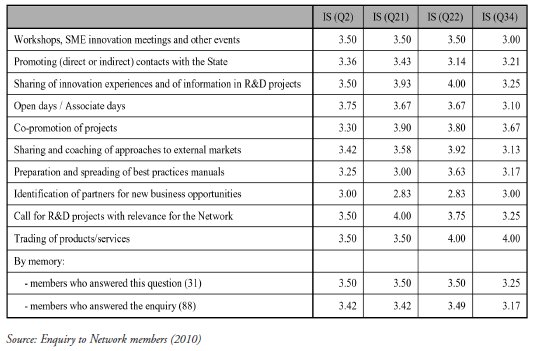
The results presented are mixed and inconclusive with regards to a possible link between the best practices indicated by two or more members and the average values given by them for the IS questions. For example, the value resulting from the crossing of IS question 22 with workshops, SME innovation meetings and other events (3.50) is contrary to the expected or more likely situation that it would be greater than the average for all members (3.49), whereas the result for open days / associate days (3.67) is more in line with such expectations. If this happens with this exploratory ad hoc approach, and also given the small number of answers, these results are unlikely to become more conclusive when using statistical tools.(see Table 2)
As a final remark, despite the results obtained from crossing the answer to this question and some questions of the IS, it is particularly important to recall what members believe to have been the best cooperation practices, notably: workshops, SME innovation meetings and other events, promoting (direct or indirect) contacts with the State and sharing of innovation experiences and of information in R&D projects. With that said, the limited number of answers suggests caution when interpreting the list and the relative importance of these practices.
INTENSIFYING COOPERATION
Understanding which practices members believe should be created or developed in the future so as to further cooperation between members and the Networks cohesion is perhaps even more important than identifying past best practices. Thus, the 2010 enquiry contained an open question where members were asked to suggest actions that would increase collaboration between Network members18. Not surprisingly, a considerably larger number of members replied this time: although newly-admitted members had no opinion on past practices which were at the time unknown to them, they could easily form an opinion about future ones.(see Table 3)
TABLE 3
Best cooperation practices (future)
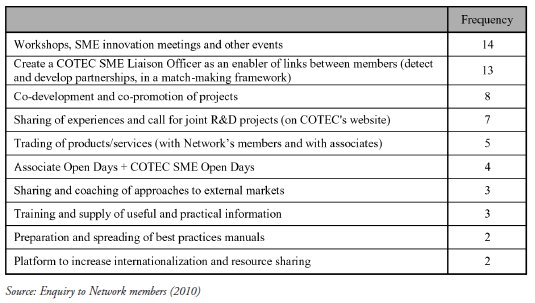
Following the same procedure as for past practices and when compared with Table 1, Table 3 shows that some desirable practices for the future come from the past, either alone or grouped, some were eliminated, and new ones appeared. It is particularly interesting to note the elimination of promoting (direct or indirect) contacts with the State, one of the two most mentioned past practices, with the same score as workshops, SME innovation meetings and other events, which is still at the top of the list for future practices. The latter suggests that COTEC has done a good job in this area, which respondents understand to be crucial for enhanced networking and cohesion. According to the specific responses of some members, these workshops, SME innovation meetings and other events are occurrences that should be repeated or even intensified.
Also at the top of the list of future practices was the idea of creating what could be called an SME Liaison Officer, supported by software, so as to increase and simplify the links between members, showing real-time information and allowing the detection, search and development of partnerships in a match-making framework19.
The third and fourth categories reveal a strong desire (and need) for cooperation amongst members which, from their specific responses, suggests some autonomy from COTEC; however, there is still room for COTECs presence and mediation, as one of those categories explicitly mentions. Trade of products/services (with Network members and associates) also goes up a few positions in the table, which suggests it warrants future attention, including in a possible update of the 2008 and 2010 enquiries. It would even be legitimate to ask: what would the frequency of trade of products/services (with Networks members and associates) be, if it had been an option in the question on the advantages of participating and cooperating in the Network?
Similarly to the previous point (Table 2), in Table 4 no meaningful relationships can be drawn between the suggestions for (future) practices and the average values for the responses to the four IS questions. Nevertheless, it was considered appropriate to maintain consistency in the methodology and, thus, the table with the corresponding columns is shown.
TABLE 4
Good cooperation practices vs. innovation scoring (future)
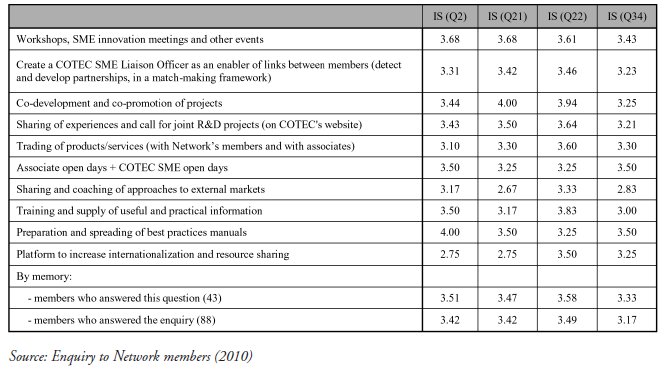
To conclude, since no sufficiently robust results can be drawn from Table 4, like Table 2, emphasis goes to what the responding members consider the three most important actions for enhancing collaboration between Network members: workshops, SME innovation meetings and other events promoted by COTEC; create a COTEC SME Liaison Officer as an enabler of links between members (detect and develop partnerships, in a match-making framework); co-development and co-promotion of projects.
CONCLUDING REMARKS
The Network, which increased its member count five-fold within its first five years of activity, includes some of the most innovative SME in Portugal that are a role-model for the remaining SME. For this reason, it is interesting to consider what members believe to be the advantages of cooperating with and participating in the Network. This article is a step in that direction and also explores past and future best cooperation practices.
At the beginning of 2008 and 2010, Network members were questioned on the main reasons for cooperating with and participating in the Network. On both occasions, the three most voted answers out of sixteen were the following: stimulus to innovate; greater personal recognition and company promotion; access to relevant information. The consistency of these results implies that they should be taken into account by COTEC (in its activities) and by the Network members (in their cooperation relationships with other members and with associates).
The categorisation of the responses obtained did not always lead to statistically significant results; however, regarding the reasons for cooperating and participating in the Network, it can be stated that: i) the stimulus to innovate is particularly important for members outside of the ICT sector; ii) the support from COTEC is important predominantly for members in the ICT sector; iii) members in the manufacturing industry give more value to project evolution; iv) access to training is much more important for members that are not in the manufacturing industry; v) members that indicate only 1 or 2 types of innovation in 2007-2009 report that the Network is a stimulus to innovate less frequently than members indicating they had 3 or 4 types of innovation; vi) members whose collaborative profile is mostly with technological partners give more value to the support from COTEC, access to information and recognition and reputation advantages.
Regarding best past practices of cooperation amongst members and between them and associates, the crossing with four IS questions was statistically inconclusive; however, the results suggest that the best cooperation practices result mostly from workshops, SME innovation meetings and other events, promotion of contacts (direct or indirect) with the State and sharing of innovation experiences and of information in R&D projects.
As for the practices that should be introduced to intensify and enhance cooperation among members and between them and associates, the crossing with the four IS questions was again inconclusive; therefore, emphasis is given to those practices that members consider to be the main pillars of cooperation: workshops, SME innovation meetings and other events promoted by COTEC; create a COTEC SME Liaison Officer as an enabler of links between members (detect and develop partnerships, in a match-making framework); co-development and co-promotion of projects.
To conclude, the relevance of the Network and the results suggest the need for further research, starting with a new enquiry at the beginning of 2012, and exploring new approaches and domains of analysis.
REFERENCES
CARDOSO, G.; ROLDÃO, V.; ESPANHA, R. & CASTRO, D. (2008), «Entrepreneurism and Innovation in SMEs in Portugal: the COTEC SME Network». LINI Working Papers, no. 4. [ Links ]
CHESBROUGH, H. & ROSENBLOOM, R. S. (2002), «The role of the business model in capturing value from innovation: evidence from Xerox Corporation's technology spin-off companies». Industrial & Corporate Change, vol. 11, I. 3, pp. 529-555. [ Links ]
COTEC (2009), «INNOVATION SCORING – Manual de Apoio ao Preenchimento do Sistema de Innovation Scoring da COTEC». March, p. 111. [ Links ]
DE JONG, J. P. J. & MARSILI, O. (2006), «The fruit flies of innovations: a taxonomy of innovative small firms». Research Policy, vol. 35, I. 2, pp. 213-229. [ Links ]
EVANGELISTA, R. (2000), «Sectoral patterns of technological change in services», Economics of Innovation and New Technology, vol. 9, I. 3, pp. 183-221. [ Links ]
HAGEL III, J.; BROWN, J. S. & DAVISON, L. (2008), «Shaping strategy in a world of constant disruption. Harvard Business Review, vol. 86, I. 10, pp. 80-89. [ Links ]
MAGRETTA, J. (2002), «Why business models matter». Harvard Business Review, vol. 80, I. 5, pp. 86-92. [ Links ]
PAVITT, K. (1984), «Sectoral patterns of technical change: towards a taxonomy and a theory». Research Policy, vol. 13, I. 6, pp. 343-73. [ Links ]
TIDD, J.; BESSANT, J. & PAVITT, K. (2001), «Managing innovation: Integrating technological, market and organizational change». J. Wiley and Sons, Chichester, 2nd ed., p. 464. [ Links ]
ZOTT, C. & AMIT, R. (2007), «Business model design and the performance of entrepreneurial firms», Organization Science, vol. 18, I. 2, pp. 181-199. [ Links ]
ZOTT, C. & AMIT, R. (2008), «The fit between product market strategy and business model: implications for firm performance», Strategic Management Journal, vol. 29, I. 1, pp. 1-26. [ Links ]
NOTES
1This article has in its origin a subset of a much wider unpublished study, which was developed for COTEC by a consortium formed by specialists from ISCTE-IUL and ISEG, with the goal of characterising the innovation activity developed by the COTEC Innovative SME Network. Two of the authors of this article were the consortium members responsible for the component of that study which originated this article; however, it is more than justifiable to show gratitude to the remaining consortium members, in particular Vítor Corado Simões, Nuno Crespo and Sandro Mendonça. Finally, acknowledgements are also due to the COTEC team, who actively interacted with the consortium.
2http://www.cotecportugal.pt/index.php?option=com_advassociates&Itemid=106, 16.06.2011.
3http://www.cotecportugal.pt/index.php?option=com_content&task=blogcategory&id=72&Itemid=112, 16.06.2011.
4http://www.cotecportugal.pt/index.php?option=com_content&task=blogcategory&id=58&Itemid=179, 16.06.2011.
5http://www.innovationscoring.pt/, 16.06.2011.
6Borrowing this definition makes sense, since this is the interpretation given to the term, both by COTEC and by the Networks members.
7For clarity, tables are identified with a number when they are included in the main text and with a letter when they are in an appendix.
8The access to new knowledge variable has a relative frequency (55.7%) which is not far from the frequency of the main variable, unlike all the other secondary variables within their respective categories. This is not independent of the fact that 86% of the members who indicated the variable access to relevant information have also indicated the variable access to new knowledge.
9Chi-square tests vary according to the type of matrix (e.g. 2-by-2 or 2-by-5). Their validity is hindered by the reduced number of observations in some crossings. They indicate an existence, or lack thereof, of some relationship between the crossed variables, and also whether that relationship is not random; however, they cannot indicate the type, intensity, or direction of such a relationship, and thus, cannot measure the existence of causality.
10Networks members were questioned on the number of cooperation relationships they had with other members; they were then asked for the identification of their partners, a classification of the intensity of cooperation and the identification of the driving force of the relationship (themselves, their partner, or non-Network third parties).
11Five categories were defined: <1,00 M; 1,00-2,49 M; 2,50-4,99 M; 5,00-9,99 M; =10,00 M.
12These entities could well be considered complementary; however, since the connection with technological partners is much more common in ICT sector companies, they were kept as an autonomous class.
13See for example Chesbrough and Rosenbloom (2002), Magretta (2002), Zott and Amit (2007), Zott and Amit (2008), and Hagel III et al. (2008).
14In Table B (see appendices), and taking as example the companies that signaled access to relevant information as an advantage of belonging to the Network, the difference between 61.0% (members which are not in the ICT sector) and 68.2% (all members) was computed. The result (-7.2%) was then used for Figure 2.
15In the following figures the numbers between brackets have the same meaning.
16The IS data was used by looking at the average between the scoring of approach and application.
17Open days/associate days were not included, since their high frequency justifies an autonomous category.
18For coherence and comparability, a procedure identical to the previous point was used; therefore it is not repeated here.
19This idea had been discussed already, and the tool was made available to members by the end of the first half of 2011.
TABLE A - Advantages of participating and cooperating on the Network
Advantages of participating and cooperating on the Network vs. (not) belonging to the ICT sector
Advantages of participating and cooperating on the Network vs. (not) belonging to the manufacturing industry
Advantages of participating and cooperating on the Network vs. proactivity index (PI)
Advantages of participating and cooperating on the Network vs. number of innovation types (NIT)
Advantages of participating and cooperating on the Network vs. collaborative
profile (technological partners)
Advantages of participating and cooperating on the Network vs. business model type
Advantages of participating and cooperating on the Network vs. dimension (turnover)