


Serviços Personalizados
Journal
Artigo
 Inglês (pdf)
 Artigo em XML
 Referências do artigo
 Enviar este artigo por email
Indicadores
-
 Citado por SciELO
 -
 Acessos
Links relacionados
-
 Similares em
SciELO
Similares em
SciELO
Compartilhar

 Permalink
Psicologia
versão impressa ISSN 0874-2049
Psicologia vol.17 no.2 Lisboa jul. 2003
https://doi.org/10.17575/rpsicol.v17i2.461
Direct and indirect assessment of group homogeneity perceptions in a natural group setting
Avaliação directa e indirecta das percepções de homogeneidade num contexto de grupos naturais
Rosa Cabecinhas*; Fabio Lorenzi-Cioldi**; Anne Dafflon Novelle***
*University of Minho, Portugal;
**-***University of Geneva, Switzerland;
ABSTRACT
The present study addressed the hypothesis that a group with low-status and small size (Angolan immigrants living in Portugal) is homogenized more than the corresponding high-status majority group (Portuguese natives). Angolan immigrants and native Portuguese performed an impression formation task of ingroup and outgroup members, and then answered direct and indirect measures of group homogeneity. In support of our hypothesis, results showed that participants homogenized Angolan group members more than Portuguese group members. Results further showed that this effect was corroborated with most of the six direct measures and the two indirect measures. The discussion focuses on the role of the groups' positioning within a social structure on homogeneity perceptions assessed by means of direct and indirect measures.1
Key-words Group homogeneity, impression formation, natural groups.
RESUMO
No presente estudo investigámos a hipótese de que o posicionamento dos grupos na estrutura social, tanto em termos do estatuto social como em termos do estatuto numérico, assume um papel moderador nas percepções de homogeneidade do endogrupo e do exogrupo. Neste caso, os portugueses autóctones representam o grupo maioritário e de estatuto social mais elevado e os imigrantes angolanos residentes em Portugal representam o grupo minoritário e de menor estatuto social. Jovens de ambos os grupos, imigrantes angolanos e portugueses autóctones, participaram numa tarefa de formação de impressões sobre membros do endogrupo e do exogrupo e depois responderam a medidas directas e indirectas de homogeneidade grupai. Em concordância com a nossa hipótese, os resultados demonstraram que o grupo dos angolanos é percebido de forma mais homogénea do que o grupo dos portugueses. Os resultados demonstraram ainda que este efeito foi corroborado na maior parte das seis medidas directas e nas duas medidas indirectas. A discussão focaliza-se no papel do posicionamento dos grupos na estrutura social nas percepções de homogeneidade do endogrupo e do exogrupo, averiguadas através de medidas directas ou indirectas.
Introduction
The outgroup homogeneity effect is a well-documented phenomenon which consists of the tendency to see members of one's own group as more diverse and heterogeneous than members of the relevant outgroup (for reviews, see Devos, Comby, & Deschamps, 1996; Marques, Robalo, & Rocha, 1992; Mullen & Hu, 1989; Ostrom & Sedikides, 1992; Ouattrone, 1986; Voci, 2000). However, there is increasing evidence that several factors moderate this tendency to attribute more homogeneity to outgroups than to ingroups. The groups' relative size and social status or prestige have been found to influence perceptions of group homogeneity. Specifically, people's judgments about numerical minorities often encompass more homogeneity than their judgments about majorities (e.g., Brewer & Weber, 1994; Brown & Smith, 1989; Guinote, 2001; Mullen, 1991; Simon, 1998; Simon & Brown, 1987). Analogously, members of groups with lesser power, status, or prestige are often homogenized to a larger extent than the corresponding outgroups (e.g., Boldry & Kashy, 1999; Cabecinhas & Amancio, 1999; Lorenzi-Cioldi, 1998; Lorenzi-Cioldi, Eagly, & Stewart, 1995; Sedikides, 1997; Stewart, Vassar, Sanchez, & David, 2000).
Explanations of these deviations from the outgroup homogeneity effect have involved motivational as well as cognitive factors. To explain the perceived homogeneity of minorities, it has been argued, for instance, that the minority group members "close the ranks" in order to protect or to restore a threatened social identity (Brewer, 1993; Simon, 1992). Alternatively, it has been maintained that minorities' homogeneity stems from the cognitive salience of infrequent social stimuli that promote group cohesiveness (Mullen, 1991). Analogously, the subordinates' homogeneity has been explained by pointing the people's lower motivation to form detailed impressions of lower status groups than higher status groups (Lorenzi-Cioldi, 1998; Sedikides, 1997). On the other hand, this effect has also been explained by positing a set of "cultural defaults" people use to process information about high and low-status people (Smith & Zarate, 1992). Whatever the kind of explanation that has been proposed, however, there is clear evidence in favor of a moderation of perceptions of intragroup homogeneity according to the target group's status and size.
The magnitude of the outgroup homogeneity effect is also contingent upon methodologies and specific measures used (e.g., Linville, Fischer, & Salovey, 1989; Park & Judd, 1990; Quattrone & Jones, 1980). As a matter of fact, the assessment of the group homogeneity effect is a highly controversial issue. Techniques used for assessment of group homogeneity perceptions have been classified in several ways (Devos et ah, 1996; Linville et al, 1989; Ostrom & Sedikides, 1992; Park & Judd, 1990; Quattrone, 1986; Voci, 2000). Park and Judd (1990; Judd, Ryan & Park, 1991) distinguished between three classes of measures: stereotypicality, dispersion, and global similarity. Stereotypicality measures assess the extent to which the group is seen to fit the group stereotypes (e.g,., Bartsch & Judd, 1993; Park & Judd, 1990; Judd et al., 1991; Park & Rothbart, 1982; Quattrone & Jones, 1980). Dispersion measures assess the perceived dispersion of group members (e.g., Jones, Wood & Quattrone, 1981; Judd et ah, 1991 ; Judd & Park, 1988; Linville et al., 1989; Park & Judd, 1990; Simon & Brown, 1987; Simon & Pettigrew, 1990; Wilder, 1984). Global similarity measures directly ask participants to estimate the similarity of the group on a rating scale (e.g., Park & Judd, 1990; Park & Rothbart, 1982; Quattrone & Jones, 1980). Measures of stereotypicality, dispersion and global similarity can be considered "direct" or "explicit" measures, because participants can easily become aware of the research objectives, henceforth controlling their answers according to social desirability concerns.
Homogeneity perceptions have also been assessed using indirect measures, such as cued- and free-recall of information concerning members of different groups (for a review, see Lorenzi-Cioldi, 1998). These measures can be considered "indirect", "implicit", or "unobtrusive", because they do not make participants aware that the task concerns the extent to which they categorize and homogenize persons into groups. This maybe an important advantage over more direct measures insofar as the procedures invoke groups with unequal status and make the participants' task particularly reactive. To assess homogeneity effects with unequal status groups, authors have therefore given precedence to indirect measures, specifically to the recall of information about ingroup and outgroup members (Lorenzi-Cioldi, 1998; Sedikides, 1997) or to the building of complex indices derived from interpersonal perception within and across groups (Boldry & Kashy, 1999).
A review of the literature on group homogeneity perceptions based on this variety of measures drives to some observations. First, the majority of the studies makes use of either direct or indirect measures of group homogeneity (e.g., Judd et al,. 1991; Park, & Judd, 1990; Park, Ryan, & Judd, 1992, for measures of stereotypicality and dispersion; Linville et al, 1989, for measures of dispersion; Carpenter, 1993, studies 1 and 2; Lorenzi-Cioldi, 1998, study 9; Ostrom, Carpenter, Sedikides, & Li, 1993, studies 1,2 and 3; Sedikides, 1997, studies 1 and 2, for measures of free recall; and Lorenzi-Cioldi, 1993, 1998, studies 5, 6 and 7; Lorenzi-Cioldi, Deaux, & Dafflon, 1998; Lorenzi-Cioldi et al, 1995, for measures of cued recall). Second, correlations between homogeneity perceptions based on different measures provided only weak evidence for consistency (see Park, & Judd, 1990, who used five different direct measures). Third, among studies that concurrently used direct and indirect measures (Carpenter, 1993, studies 1 and 2; Judd, & Park, 1988; Ostrom et al, 1993, studies 1,2 and 3), only two showed concordant patterns of results of direct and indirect measures (Carpenter, 1993, study 1; Ostrom et al, 1993, study 1). In three other studies (Carpenter, 1993, study 2; Ostrom et al, 1993, studies 2 and 3), the outgroup homogeneity effect was evidenced using indirect measures but not using direct measures. Authors provided no explanation of this inconsistency Judd and Park (1988) also got opposite results with different direct measures (various measures of dispersion), and indirect measures based on a recall task of group members' characteristics. In a condition of intergroup cooperation, the authors obtained an outgroup homogeneity effect with indirect, but not with direct, measures. Conversely, in a condition of intergroup competition, they obtained an outgroup homogeneity effect with direct, but not indirect, measures. Thus, research using direct and indirect measures together present the most inconsistent pattern of homogeneity perception.
Although the empirical evidence points to strong inconsistencies among measures of perceived homogeneity of the groups, one can wonder under what circumstances this inconsistency can be reduced. The clear positioning of two groups in the social structure, both in terms of the groups' status (i.e., a high-status group vs. a lower status group) and the groups' size (a majority vs. a minority) may contribute to consistency among different assessments of the perceived homogeneity of these groups. A clear-cut social positioning of the groups in terms of status and size is, however, hardly observed in real life. For one thing, status and size are contextual and transient parameters. For instance, women often possess lower status, and are in smaller numbers than men in the workforce, but they are endowed with equal or superior status, and may be in larger numbers, in other domains. For the other thing, groups with lesser power, status, or prestige are most often numerical minorities (Brown, & Smith, 1989; Simon, Glassner-Bayerl, & Stratenwerth, 1991), yet they are sometimes numerical majorities as well (Lorenzi-Cioldi, 2003). To illustrate, perceptions of homogeneity of gender groups have shown a highly inconsistent pattern of results, independently of the kind of measures used. The outgroup homogeneity effect was evidenced using measures of stereotypicality and dispersion (Park, & Judd, 1990; Park, & Rothbart, 1982), global similarity (Mackie,
Sherman, & Worth, 1993), cued recall (Frable, & Bern, 1985) and free recall (Carpenter, 1993; Ostrom et al., 1993). The ingroup was as homogeneous as the outgroup when using measures of dispersion (Linville et al., 1989) and cued recall (Taylor, Fiske, Etcoff, & Ruderman, 1978). The outgroup homogeneity effect for the male participants and the ingroup homogeneity effect for the female participants were obtained with measures of dispersion (Brown, & Smith, 1989), global similarity (Hurtig, Pichevin, & Piolat, 1991) and cued recall (Cabecinhas, & Amâncio, 1999; Lorenzi-Cioldi, 1993; Lorenzi-Cioldi et al., 1995; Stewart et al., 2000).
Some experiments have attempted to disentangle the effects of status and size on homogeneity perceptions. The results of these experiments tend to favour the assumption that both variables, independently, contribute to account for the observed asymmetries in ingroup and outgroup homogeneities (e.g., Lorenzi-Cioldi, 1998; Simon, & Hamilton, 1994; Zarate, & Smith, 1990). Status and size are continuous rather than discrete parameters, and they combine one another in countless ways in social reality, making the task of keeping them constant across various intergroup comparisons particularly challenging. Given the potential cumulative impact of status and size on perceptions of intragroup homogeneity, the complex way in which these parameters are confounded in the social reality may be a source of the observed inconsistencies among measures of the ingroup and outgroup perceived homogeneities.
One way to circumvent the problem raised by this confound of status and size in real life settings is to examine homogeneity perceptions among groups whose status and size are clearly established. Specifically, the group setting should oppose a group that is numerically large and of high social status to a group that is numerically small and of low social status. Hence, the former group combines factors that emphasize the group's perceived heterogeneity, whereas the latter group combines factors that emphasize the group's perceived homogeneity. The present research focused on two such natural groups. Specifically, it involved native Portuguese and Angolan participants living in Portugal. Portuguese people are consensually ascribed more status and prestige, as well as a larger size, than Angolan people.2
In the present study, Angolan and Portuguese participants performed an impression formation task of ingroup and outgroup members, and then answered several direct and indirect measures of group homogeneity. The first goal of this study was to show that the lower status and size Angolan target group is more homogenized than the higher status and majority Portuguese target group. The second goal was to compare direct and indirect assessments of this pattern of group homogeneity perceptions.
Method
Participants and design
Fifty-five Angolan students (20 men and 35 women) and 108 Portuguese students (48 men and 60 women) took part in the main experiment (mean age = 22.20).3 Seventy-five Angolan students (33 men and 42 women) and 86 Portuguese students (33 men and 53 women) took part in three pilot studies devised to set up the stimulus materials. The design of this study was a 2 (participant group: native Portuguese vs, Angolan immigrants) x 2 (target group: ingroup vs. outgroup). Participant group was a between-subjects variable, and target group was a within-subjects variable.
Procedure
Participants in the main experiment were asked to participate in a study on person perception. They were tested in small groups, always by the same white Portuguese female experimenter. Each participant received information about eight target persons, four Portuguese and four Angolans. Male students received information about male targets and female students received information about female targets. On the cover page of the questionnaire the instructions explained to participants that their task was to form an impression of, and remember, the information about each target person. Each target person was described on a separate page. The person's name appeared at the top of the page, followed by his/her group membership (Portuguese vs. Angolan) and four attributes, each on a separate line. The group membership of the target persons was alternated. Half of the participants began by an Angolan target and half by a Portuguese target.
Participants performed either a cued or a free-recall task, which can be considered as indirect tasks to assess group homogeneity perceptions. For the cued-recall task, participants were given 20s to examine each stimulus page. After this impression formation, the experimenter collected the materials, and asked participants to match all of the information with the target people. For the free-recall task, participants were asked to recall each group's attributes "in any order they came to mind". After the memory (cued or free) task, participants answered other questions on more direct perceptions of group homogeneity. These questions were a percentage estimates task, a range task, a distribution task, and a similarity task.
Pilot studies First pilot study
Twenty-four Angolan students (11 men and 13 women) and 29 Portuguese students (12 men and 17 women) provided judgments about both target groups on several dimensions: educational level, cultural level, economic status, social status, prestige, power, by cross-marking 100-mm straight lines labeled only at the endpoints (low vs. high). Participants ascribed more status to the Portuguese than to the Angolans (Ms = 58.83 and 24.73, respectively), F(1,1) = 186.91, p < 0,001. Portuguese students perceived their ingroup to be of higher status than the outgroup (Ms = 53.38 and 22.83, respectively), and Angolan students perceived the outgroup to be of higher status than the ingroup (Ms = 65.41 and 27.03). Hence, Portuguese and Angolans participants consensually ascribed higher social status to the Portuguese than to the Angolans living in Portugal.
Second pilot study
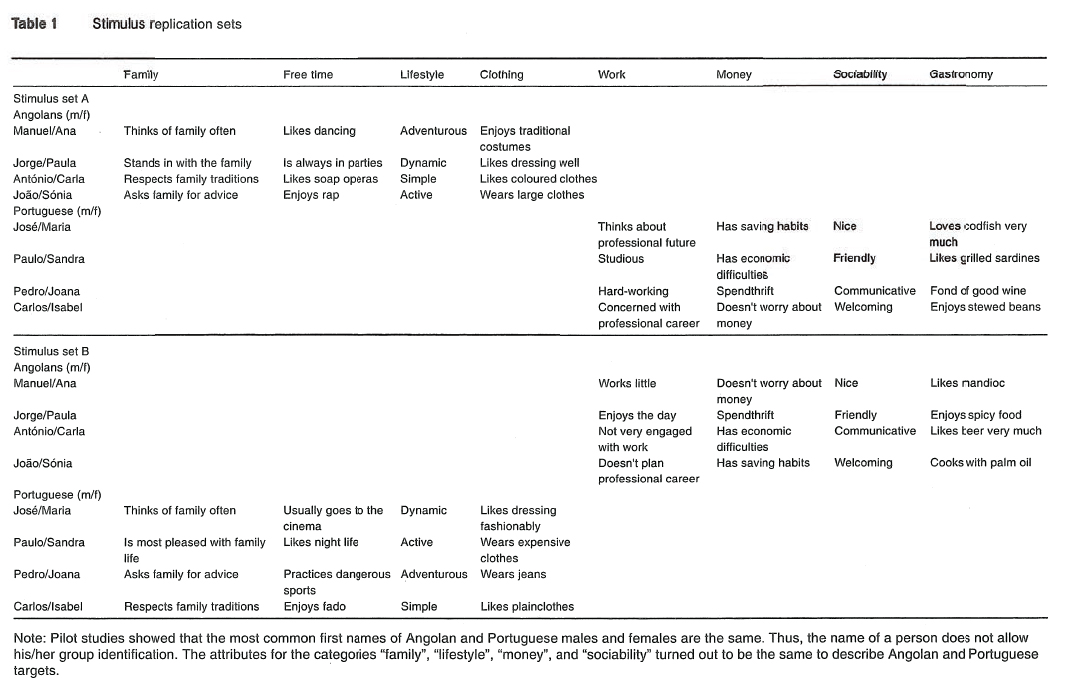
Stimulus materials were selected according to the following procedure. Thirty-one Angolan (10 men and 21 women) and 31 Portuguese (12 men and 19 women) students were asked to report the five most typical attributes of their own group and the five most typical attributes of the other group. Participants listed a total of 320 attributes. From these attributes, we selected those that were listed by at least five participants, leaving a total of 80 attributes. One male and one female Angolan students, and one male and one female Portuguese students, content-analyzed the 80 attributes. These attributes were grouped into 10 categories. The 8 content categories which encompassed the largest number of attributes were retained. These were the following content categories: "relationship with family", "free time", "lifestyle", "clothing", "attitude toward work", "attitude toward money", "sociability", "gastronomy".
Third pilot study
Amodier group of students, 24 Portuguese (8 men and 16 women) and 18 Angolan (11 men and 7 women) judged the attributes and the content categories, and answered various other questions. Firstly, they judged the 80 attributes, ordered randomly, on several dimensions. They rated the stereotypicality of each attribute applied to the Portuguese group and the Angolan group, separately, using 7-point scales (1 = not typical of the group, 7 = very typical of the group). They then rated the valence of these attributes on 7-point scales (1 = negative, 7 = positive), and decided whether the attributes could be applied to both men and women or only to one sex. Secondly, participants were asked to sort out the eight categories derived from the content analyses of the 80 attributes into the private and the public spheres. Finally, they were asked to list the eight most common male and female first names of both Angolan and Portuguese people. The Portuguese attributes (M = 4.96) were perceived stereotypical of the Portuguese, as revealed by a comparison of the mean against the scale midpoint, t(41) = 10.35, p <0,001. Likewise, the Angolan attributes (M = 5.01) were perceived stereotypical of the Angolans, t(41) = 10.49, p <0,001. Angolan attributes (M = 4.36, t(41) = 3.78, p <. 001) and Portuguese attributes (M = 4 81, t(41) = 9.20, p <0,001) were perceived positively. Attributes were considered to apply to both men and women. The attribute categories "family", "free time", "lifestyle" and "clothing" were judged to belong to the private sphere, as revealed by a comparison of the mean against the scale midpoint (M = 1.30, t(39) = -5.71, p <. 001), and the attribute categories "work", "money", "sociability" and "gastronomy" to the public sphere (M = 1.68, f(39) = 5.85, p <0,001).
Stimulus materials
According to the results of these pilot studies, we assembled the descriptions of 16 hypothetical people, eight Angolans and eight Portuguese. Each portrait consisted of four attributes from either the private sphere or the public sphere. Two replication sets were devised. Replication set A described four Angolan persons using the private attribute categories, and four Portuguese persons using the public attribute categories. Replication set B reversed the attribute categories for Angolan and Portuguese target persons (see table 1).
For the direct tasks we selected two sets of attributes from the 80 stereotypical attributes, except those already used in sets A and B. Four attributes, half of them stereotypical of one group and counterstereotypical of the other group, and half of them positive and half negative, were selected for the percentage estimates task and the range task. The attributes consensually rated stereotypical of the Angolans were fun-loving (positive) and lazy (negative). Those of the Portuguese were hard-working (positive) and individualistic (negative). Four other attributes, equally stereotypical and of equal valence for both groups, were selected for the distribution task (gluttonous, impulsive, traditionalist, and conceited).
Homogeneity assessment Indirect measures
Indirect measures consisted of a cued recall and a free recall of the information describing the target group members. Half participants completed the cued recall, and the other half completed the free recall.
Cued recall This measure was based on the seminal procedure originally outlined by Festinger, Pepitone, and Newcomb (1952), and later elaborated by Taylor et al. (1978). In the present experiment, recall of the information was based on the attributes that described each target person. After the impression formation task, half of the participants received a page with a matrix containing 8 columns (each one headed by the name and the group membership of the eight target persons) and 32 rows (a randomly ordered list of the attributes that had described the eight target persons). Participants were instructed to indicate which target person had been described by each attribute by checking the appropriate column for each row of the matrix. The cued-recall task yielded measures of the number of correct answers as well as different types of errors (or confusions among target persons).
Between-group errors are assignments of an attribute belonging to one target to a target of a different group. Within-group errors are assignments of an attribute belonging to one target to another target of the same group. The comparison of the amount of between-groups and within-groups errors can be used to assess the categorization effect. This categorization effect is revealed by a stronger tendency to confuse information about members of the same group than information about members of different groups. In order to assess homogeneity effects, the within-group errors were further classified by their relevance to outgroup targets versus ingroup targets. Ingroup errors are assignments of an attribute belonging to a target of the participant's own group to another target of the same group and outgroup errors are assignments of an attribute belonging to a target whose group is different from the participant's to a target of this other group. The outgroup homogeneity effect should be revealed by more outgroup errors than ingroup errors.
Free recall The free recall task allows an alternative examination of the structure of the recalled information (Ostrom et al., 1993; Sedikides, 1997). Half of the participants received a booklet with 16 blank pages and were instructed to write down the attributes defining one of the groups, one attribute per page. They then received another booklet with 16 blank pages and were asked to recall the attributes of the other group. Target group order was counterbalanced across participants. Recall performances (i.e., the total number of attributes recalled) should not show any differences according to the target group. However, the organization of the recalled information for the two groups should reveal profound discrepancies. The targets' descriptions offers a basis for two orthogonal ways of organizing information, either in terms of person categories (Manuel, José, etc.) or in terms of attribute categories (family, work, etc.). The recalled information was examined by computing two types of clustering scores: clustering around persons and clustering around attribute categories (.ARC-score; Roenker, Thompson & Brown, 1971). The ARC-score is based on the frequency with which two items from the same category (person or attribute) are listed in direct sequence during recall (i.e., repetitions). If that frequency is greater than chance then it is presumed that this category was used as a basis for retrieving the information. An ARC-score of 0 indicates chance category clustering and an ARC-score of +1 indicates perfect category (person or attribute) clustering. Negative ARC-scores indicate that participants used clustering categories different from the person or attribute's coding scheme. We computed four scores for each participant: one person ARC-score for the ingroup and one person ARC-score for the outgroup; one attribute ARC-score for the ingroup and one attribute ARC-score for the outgroup.
Direct Measures
After having recalled the information about the target persons, each participant received a questionnaire with a series of questions about both target groups: Portuguese and Angolans. The order of the two target groups was counterbalanced across participants.
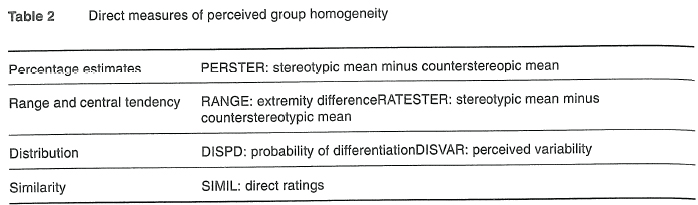
Percentage estimates (Park, & Rothbart, 1982). Participants estimated the percentage (from 0% to 100%) of members of each target group that possess each of the four stereotypical attributes selected for direct measures (see "Stimulus materials"). A measure of perceived homogeneity was computed from the participants' answers. This measure was calculated by subtracting the percentage estimate ratings of counterstereotypic attributes from those for stereotypic attributes (PERSTER). This difference score reflects the extent to which group members are seen as conforming to the group stereotype. Large differences indicate higher perceived group homogeneity (many members of the group have stereotypic attributes and few members of the group have counterstereotypic attributes). Small differences indicate lower perceived homogeneity among group members or less conformity with the group stereotype.
Range (Park, & Judd, 1990). Using the same four attributes, participants' task was to position each target group and the two most extreme members of these groups on 100-mm lines whose endpoints corresponded to the presence or absence of each attribute (e.g., "the least" and "the most fun-loving persons"). From this task we computed two perceived homogeneity measures. For each attributes, the difference between the extreme members of a group was taken as the perceived range (RANGE). As for the percentage estimates measure, the means for counterstereotypic attributes were subtracted from those for stereotypic attributes (RATESTER).
Distribution (Linville et al., 1989). Using the four equally stereotypical and valence attributes (see "Stimulus materials"), participants considered 100 group members and distributed these group members by indicating a number in each of seven boxes, with those numbers summing up to 100. Participants distributed the 100 group members on each attribute using a continuum labeled at one endpoint with the absence of the attribute (e.g., "not impulsive") and at the other with the presence of the attribute (e.g., "very impulsive").
The seven boxes were assigned the scale values of 1 through 7. From the distributions, and according to Linville et al. (1989) procedure, we calculated the probability of differentiation (DISPD), and the perceived variability (DISVAR). The probability of differentiation refers to the probability of distinguishing among group members. It is maximal when the produced distribution is uniform, that is, when each box contains the same number of group members. The perceived variability refers to the degree to which members of a group are perceived to be dispersed. It is maximal when the produced distribution is bimodal, that is, when the group members have been equally divided into two subgroups which have been assigned to the extreme boxes of the distribution.
Similarity (Quattrone & Jones, 1980). Participants were asked to evaluate each group members' similarity (SIMIL) using a 7-point scale spanning from "completely different" to "completely alike".
Table 2 summarizes all of the direct measures of perceived group homogeneity used in the present study.
Perceived groups' status, size, and familiarity with the groups
In the last part of the questionnaire, participants answered a series of questions aiming at controlling stimulus materials and assessing various aspects of the intergroup setting.
Attribute stereotypicality and attribute valence. Participants judged the group-stereotypicality of each of the eight attributes used in the direct tasks of group variability on two 7-point scales, one to assess Angolan stereotypicality and another to assess Portuguese stereotypicality. They also rated the valence of these attributes on a 7-point scale.
Group status. Participants answered a series of questions aimed at assessing relative group status. They judged Angolans and Portuguese in general on six dimensions (education, cultural level, economical level, social stand, prestige, and power) using 100-mm continua. The mean of the various scales was taken as an indicator of the perceived social status of these groups.
Group Size. Participants estimated the percentage of several groups in Portugal, including the Portuguese and the Angolans.
Familiarity Measures. Group familiarity was assessed with three 7-points rating scales. These scales beard on the frequency and the intimacy of the interpersonal encounters with ingroup and outgroup members. An additional open question asked for the number of friends the participants had among Angolans and Portuguese.
Results
Checks on experimental design
To establish that Portuguese were ascribed more status than Angolans, the average of the six dimensions encompassing group status were analyzed in a 2 (participant group) x 2 (target group) analysis of variance (ANOVA), with repeated measures on the second factor. The ingroup was not ascribed different status than the outgroup, as shown by the nonsignificance of the main effect of target group. However, as expected, the analysis yielded a Participant Group X Target Group interaction, F(1,58) = 290,50, p <0,001, revealing that participants ascribed more status to the Portuguese than to the Angolans (Ms = 57.80 and 27.96, respectively). In addition, participants perceived the Portuguese to be the majority (M = 62%) and the Angolans to be a minority (M = 7%), F(1,45) = 688.30, p <0,001. Interestingly, in the society at large, Angolans living in Portugal amount to only about 0.3%.
The analysis of the group familiarity score (the average of the three rating scales) produced two effects. Firstly, a significant main effect of target group, F(1,61) = 324.45, p <0,001, demonstrated that participants were more familiar with the ingroup than the outgroup (Ms = 6.05 and 2.99, respectively). Secondly, the analysis produced a Participant Group X Target Group interaction, F(1,61) = 123.54, p <0,001. Simple effects analysis showed that Portuguese expressed much more familiarity with the ingroup (M = 6.33) than the outgroup (M = 2.21), F(1,61) = 628.59, p <0,001, and Angolans expressed lower discrepancy between ingroup and outgroup familiarity (Ms = 5.50 and 4.53, respectively), F(1,61) = 17.95, p <0,001. The analysis of the number of friends produced a significant main effect, F(1,42) = 23.03, p <0,001, showing that participants considered to have a larger number of ingroup friends (M = 52.39) than outgroup friends (M = 10.09).
Indirect Measures
Cued recall
Categorization effect. The stimulus materials confounds the target group membership and the content of the descriptions (in terms of the private vs. the public spheres), and therefore a categorization effect is very likely to emerge. However, in order to examine group homogeneity effects, we nonetheless need to verify that the participants effectively categorized the targets into groups. To the extent that participants categorized targets into groups, the within-groups errors should surpass the between-groups errors.4 To examine this categorization effect, we performed a 2 (type of error: within-groups vs. between-groups errors) x 2 (participant group) x 2 (target presentation order) x 2 (replication set) ANOVA, with repeated measures on the first factor.
Not surprisingly, the type of error main effect was highly significant: the number of within-group errors (M = 12.10) was higher than the number of between-groups errors (M = 3.11), F(1,1) = 203.31, p <. 001. No other effects were significant in this analysis. These results demonstrated that the participants effectively categorized the target persons into Angolans and Portuguese. They thus validate the use of the cued-recall measures to examine the main issue of interest, namely group homogeneity effects.
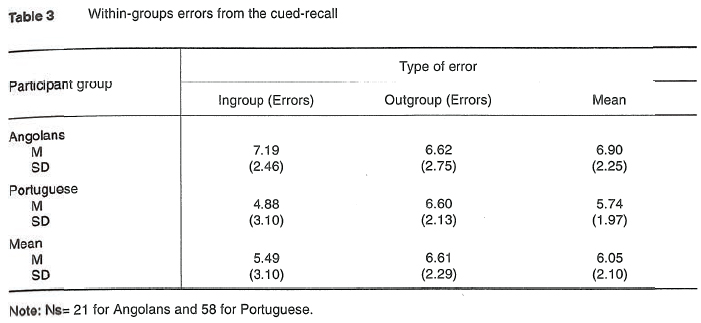
Homogeneity effects. We expect that the low-status targets will be perceived more homogeneously than the high-status targets, regardless of whether the participants are themselves members of the low-status group or the high-status group. This expectation corresponds to an interaction between the participant group and the type of within-groups errors (ingroup vs. outgroup). The Portuguese participants should display more outgroup than ingroup homogeneity. The Angolan participants should display either similar levels of ingroup and outgroup homogeneity, or more ingroup homogeneity. This prediction was examined in a 2 (type of within-groups error: ingroup vs. outgroup) x 2 (participant group) x 2 (target presentation order) x 2 (replication set) ANOVA, with repeated measures on the first factor. Table 3 displays the means of these errors.
The type of within-groups errors main effect did not reach significance (p =. 12), demonstrating the absence of an overall outgroup homogeneity effect. Consistent with our predictions, there was a significant interaction between Participant Group and Type of Within-Groups Errors, F(1,1) = 6.64, p < .02. Contrast analyses performed on these means demonstrated that Portuguese participants made more outgroup than ingroup errors, F(1,1) = 15.96, p < .01, whereas ingroup and outgroup errors did not differ for Angolan participants (p =.43).
Free recall
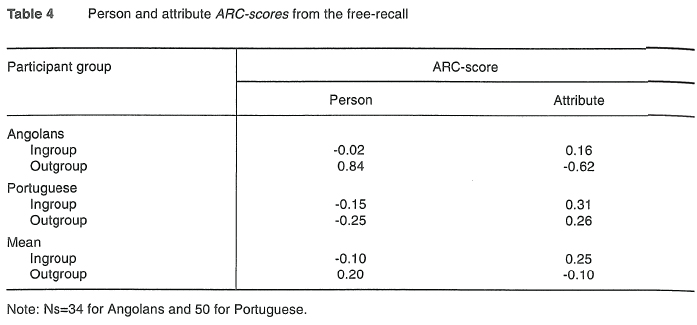
Clustering of the information. Expectations concerning the clustering of the information in free recall parallel the above mentioned expectations concerning the cued recall. We expect that participants will organize the information about the Portuguese targets by person categories and the information about the Angolan targets by attribute categories. Total amount of recall was not expected to be qualified by the target group. However, target group should influence the clustering of the information. Specifically, we expected information about Portuguese targets to be organized predominantly by person ARC-score categories, and information about Angolan targets to be organized predominantly by attribute ARC-score categories. These hypotheses were tested in a 2 (clustering category) x 2 (target group) x 2 (participant group) x 2 (replication set) x 2 (target group order) ANOVA, with repeated measures on the first two factors. Table 4 shows the means of ARC-scores.
As expected, total amount of recall (M = 16.40 attributes) did not differ according to the target group. Our main hypothesis takes the form of a three-way interaction of the Participant Group x Target Group x Clustering Category. This interaction almost reached significance, F(1,6) = 3.19, p =. 078. It was decomposed by examining the simple interactions between the target group and the clustering category for Angolan and for Portuguese participants, separately. For Angolans, this interaction reached significance, F(1,6) = 4.55, p < .04. Angolan participants tended to process ingroup information around attribute categories rather than person categories, and processed outgroup information around person categories rather than attribute categories, F(1,6) = 5.72, p < .02. Conversely, the interaction between the target group and the clustering category did no reach significance for Portuguese participants, F < 1.
Direct measures
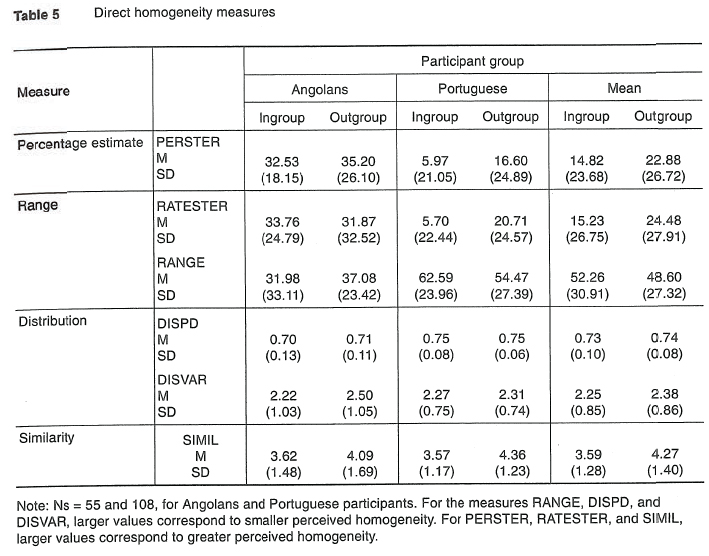
Each direct measure of perceived group homogeneity (PERSTER, RATESTER, RANGE, DISPD, DISVAR, and SIMXL) was submitted to a 2 (participant group) x 2 (target group) ANTOVA, with repeated measures on the second factor. In all analyses, our hypothesis takes the form of a Participant Group x Target Group interaction. Table 5 summarizes the results of the direct measures of perceived homogeneity.
Percentage estimates
The analysis of the PERSTER score produced a main effect of target group, showing an overall outgroup homogeneity effect. Participants perceived greater difference between stereotypic and counterstereotypic attributes for the outgroup than the ingroup, F(1,60) = 7.70, pc. 01. The interaction between participant group and target group was only marginally significant, F(1,60) = 2.70, p =. 10. Portuguese participants ascribed a higher homogeneity to the outgroup than the ingroup, F(1,60) = 14.63, p <0,001, whereas Angolan participants ascribed equal homogeneities to both groups, F < 1.
Range
The analysis of the RATESTER score produced a main effect for target group, F(1,60) = 5.52, p < .02, showing once again an overall outgroup homogeneity effect. Participants perceived greater differences between stereotypic and counterstereotypic attributes for the outgroup (M = 24.48) than for the ingroup (M = 15.23). In addition, supporting our expectation, the interaction between participant group and target group also reached significance, F(1,60) = 9.15, p < .01. Contrast performed on this interaction showed that Portuguese participants made greater differences between stereotypic and counterstereotypic attributes for the outgroup than the ingroup, F(1,60) = 51.03, p <. 001, whereas Angolan participants did not, F < 2.
The analysis of the RANGE score did not reveal any overall outgroup homogeneity effect. However, the expected Participant Group x Target Group interaction was significant, F(1,61) = 10.11, p < .01. Contrast analyses showed that Portuguese participants expressed smaller differences between the extreme members of the outgroup than between the extreme members of the ingroup, F(1,61) = 11.30, p <. 001. Angolan participants showed a nonsignificant trend (p =. 14) towards expressing larger differences between the extreme members of the outgroup than between the extreme members of the ingroup.
Distribution
The analysis of the DISPD score did not produce any significant effect. The probability of differentiation was similar for ingroup and outgroup. The analysis of the DISVAR score produced a main effect of target group. Unexpectedly, however, the participants ascribed more homogeneity to the ingroup than the outgroup, F(1,61) = 11.91, p <0,001. The Participant Group x Target Group interaction was also significant, F(1,61) = 5.91, p <0,02. In accordance with our expectations, contrast analyses showed that Angolan participants ascribed more homogeneity to the ingroup than the outgroup, F(1,61) = 13.05, p <0,001, whereas the Portuguese participants ascribed similar levels of ingroup and outgroup homogeneity (p =0,38).
Similarity
The ANOVA on SIMIL scores produced an unqualified main effect of the target group, F(1,58) = 20.84, p <0,001, showing that participants homogenized more the outgroup (M = 4.27) than the ingroup (M = 3.59).
Discussion
This present research assessed homogeneity perceptions of groups varying in status and size, using a large sample of direct and indirect measures. These measures represented the most commonly ways to assess perceptions of group homogeneity. The first goal of the present research was to test the hypothesis of a greater perceived homogeneity of the lower status, and smaller size, group, compared to the larger high-status group. The findings provided unequivocal support for this hypothesis. The positioning of the Angolan and the Portuguese groups within the social structure 'deeply influenced perceptions of the groups' homogeneity. These perceptions were in line with previous research showing a tendency for an outgroup homogeneity effect among people holding power, status, prestige, or majority positions, and for either equal ingroup and outgroup homogeneities, or ingroup homogeneity, among people occupying positions that imply lesser power, status, prestige, or size (e.g., Lorenzi-Cioldi, 1998). Angolans were found to be more homogeneous than the Portuguese, regardless of whether the perceivers were themselves members of the one or the other group. Overall, then, only members of the dominant and numerically larger group homogenized their outgroup. Members of the lower status and smaller size group displayed either intermediate and similar levels of ingroup and outgroup homogeneity, or homogenized the ingroup, depending on the measure used.
The other goal of the present study was to compare perceptions of group homogeneity using two indirect and six direct measures. We noticed in the introduction that the empirical literature shows profound inconsistencies between the direct and the indirect measures, as well as within each type of measure, even when such measures concern the same target group. These inconsistencies are problematic insofar as they question the reliability of the outgroup homogeneity phenomenon itself. A likely interpretation of inconsistencies among measures is, however, that they are used to assess homogeneity of groups that variously represent criteria such as status and size. The present research attempted to provide a clearer intergroup natural setting, by coherently matching the groups' social positionings in terms of both status and size.
The findings as for the cued-recall and the free-recall indirect measures provided ample support for our hypothesis. The cued-recall measure confirmed that the outgroup homogeneity effect was displayed by the group possessing more status and size, exclusively. Portuguese participants confused outgroup members one with another more than ingroup members. Angolan participants confused members of the two groups to an equal extent. This asymmetry in homogeneity perceptions was replicated using free recall. Angolans processed ingroup information around attribute categories rather than person categories, and processed the outgroup information around person categories rather than attribute categories. They therefore homogenized the ingroup and individuated the outgroup. However, no clear-cut pattern of homogeneities according to this measure emerged for Portuguese participants.
The direct measures also highlighted the predicted asymmetry in the perception of ingroup and outgroup homogeneity. Three direct measures provided strong support (range: RATESTER and RANGE; distribution: DISVAR), and one direct measure marginal support (percentage estimate: PERSTER) for our hypothesis. Of the remaining two measures, one yielded an unqualified outgroup homogeneity effect (similarity: SIMIL), and the other did not produce any significant effect (distribution: DISPD). As hypothesized, these asymmetries in perception of homogeneity were due, on the one hand, to the Portuguese participants ascribing more homogeneity to the outgroup than the ingroup (RATESTER, RANGE, and PERSTER), and, on the other hand, to the Angolans ascribing either equal ingroup and outgroup homogeneity (RATESTER, RANGE, and PERSTER), or a firm ingroup homogeneity (DISVAR).
Overall, then, target members of the group possessing lower status and size were more homogenized than target members of the group possessing higher status and size. It is worth mentioning that this qualification of homogeneity perceptions by the groups' status and size was evidenced in similar ways using direct measures either based on groups' stereotypes (PERSTER and RATESTER) or without connection with those stereotypes (DISVAR and RANGE), and using indirect measures derived from the recall of group members' typical characteristics. In addition, an overall outgroup homogeneity effect emerged exclusively with a subset of the direct measures (PERSTER, RATESTER, and SIMIL). This outgroup homogeneity effect was not qualified by the target group only on the SIMIL measure. Therefore, the general pattern of homogeneity perceptions is clear: the lower status and smaller size group was consensually homogenized, in comparison to the higher status and greater size group. The only exception to this pattern of means arose with a measure of global similarity (SIMIL). A likely post-hoc interpretation of this exception is based on peculiarities of this measure. Firstly, SIMIL was not based on the judgment of the groups' or the group members' characteristics, but instead it called for a global judgment of the overall groups' internal variability. Secondly, this measure can be considered more explicit than other direct measures insofar as the format of the question refers to the groups' homogeneity, that is, the response scale was anchored with the terms "completely different" and "completely alike". Thirdly, SIMIL was the only one direct measure that presented a bipolar scale format. Fourth, the 7-point scale used to gather answers on this question allows for less variability in homogeneity judgments, in comparison to 100-mm lines used for other direct measures. All together, these peculiarities of the SIMIL measure make it an ostensibly direct measure of homogeneity perceptions. It is therefore not surprising that SIMIL may have elicited social desirability concerns that may have refrained participants to acknowledge differences in groups' homogeneities due to the groups' differences in status and size.
In sum, a likely and compelling explanation of the coherence among different measures of group homogeneity effects found in the present study rests on the nature of the group setting involved. As previous research has shown, groups of little size are usually perceived as more homogeneous than larger groups (Simon, 1998). Also, groups lower in social status are usually perceived as more homogeneous than groups of higher status (Lorenzi-Cioldi, 1998). In the present research, we attempted to superpose these two concurrent factors of the perception of group homogeneity in a single natural group setting. Although the consistency of the perceptions of group homogeneity was not ubiquitous, the findings provided strong evidence that the intergroup context affects the consistency of perceptions of group homogeneity across a vast range of empirical measures. Future research should pursue this effort of identifying conditions that emphasize coherence among measures of group homogeneity, and of investigating to what extent specificities of the measures used are responsible for differences in ingroup and outgroup homogeneity perceptions.
References
Bartsch, R. A., & Judd, C. M. (1993). Majority-minority status and perceived ingroup variability revisited. European Journal of Social Psychology; 23,471-483. [ Links ]
Boldry, J. G., & Kashy, D. A. (1999). Intergroup perception in naturally occurring groups of differential status: A social relations perspective. Journal of Personality and Social Psychology, 77,1200-1212. [ Links ]
Brewer, M. B. (1993). Social identity, distinctiveness, and in-group homogeneity. Social Cognition, 11,150-164. [ Links ]
Brewer, M. B., & Weber, J. G. (1994). Self-evaluation effects of interpersonal versus intergroup social comparison. Journal of Personality and Social Psychology, 66, 268-275. [ Links ]
Brown, R., & Smith, A. (1989). Perceptions of and by minority groups: the case of women in academia. European Journal of Social Psychology, 19, 61-75. [ Links ]
Cabecinhas, R., & Amâncio, L. (1999). Asymmetries in the perception of other as a function of social position and context, Swiss Journal of Psychology, 58,40-50. [ Links ]
Carpenter, S. (1993). Organization of in-group and out-group information: The influence of gender-role orientation. Social Cognition, 11, 70-91. [ Links ]
Devos, T., Comby, L., & Deschamps, J. -C. (1996). Asymmetries in judgements of ingroup and outgroup variability. In W. Stroebe & M. Hewstone (Eds.), European Review of Social Psychology (vol. 7, pp. 95-144). Chichester: Wiley. [ Links ]
Festinger, L., Pepitone, A., & Newcomb, T. (1952). Some consequences of deindividuation in a group. Journal of Abnormal and Social Psychology; 47, 382-389. [ Links ]
Frable, D. E., & Bern, S. L. (1985). If you are gender schematic, all members of the opposite sex look alike. European Journal of Social Psychology, 49,459-468. [ Links ]
Guinote, A. (2001). The perception of group variability in a non-minority and a minority context: When adaptation leads to out-group homogeneity. British Journal of Social Psychology, 40,117-132. [ Links ]
Hurtig, M. C, Pichevin, M. R, & Piolat, M. (1991). Le sexe et l'âge, facteurs d'asymétrie de la similitude perçue entre personnes. Psychologie Française, 36,47-54. [ Links ]
Jones, E. E., Wood, G. C., & Quattrone, G. A. (1981). Perceived variability of personal characteristics in in-group and out-groups: The role of knowledge and evaluation. Personality and Social Psychology Bulletin, 7, 523-528. [ Links ]
Judd, C. M., & Park, B. (1988). Outgroup homogeneity: Judgements of variability at the individual and group levels. Journal of Personality and Social Psychology, 54, 778-788. [ Links ]
Judd, C. M., Ryan, C. S., & Park, B. (1991). Accuracy in the judgments of in-group and out-group variability. Journal of Personality and Social Psychology, 61,366-379. [ Links ]
Linville, P. W, Fischer, G. W, & Salovey, P. (1989). Perceived distributions of characteristics of in-group and out-group members: Empirical evidence and a computer simulation. Journal of Personality and Social Psychology, 57,165-188. [ Links ]
Lorenzi-Cioldi, F. (1993). They all look alike, but so do we... sometimes: Perceptions of in-group and out-group homogeneity as a function of sex and context. British Journal of Social Psychology, 32,111-124. [ Links ]
Lorenzi-Cioldi, F. (1998). Group status and perceptions of homogeneity. In W. Stroebe <& M. Hewstone (Eds.). European Review of Social Psychology (vol. 9, pp. 31-75). Chichester: Wiley. [ Links ]
Lorenzi-Cioldi, F. (2003). Lower status homogeneity as a function of the salience of the relationship between high-status and low-status groups. Manuscript submitted for publication. [ Links ]
Lorenzi-Cioldi, R, Deaux, K., & Dafflon, A. -C. (1998). Group homogeneity as a function of relative social status. Swiss Journal of Psychology, 57,255-273. [ Links ]
Lorenzi-Cioldi, R, Eagly, A. H., & Stewart, T. L. (1995). Homogeneity in gender groups in memory. Journal of Experimental Social Psychology; 31,193-217. [ Links ]
Mackie, D. M., Sherman, J. W., & Worth, L. T. (1993). On-line and memory-based processes in group variability judgements. Social Cognition, 11,44-69. [ Links ]
Marques, J. M., Robalo, E. M., & Rocha, S. A. (1992). Ingroup bias and the "black sheep" effect: Assessing the impact of social identification and perceived variability on group judgements. European Journal of Social Psychology; 22,331-352. [ Links ]
Mullen, B. (1991). Group composition, salience, and cognitive representations: The phenomenology of being in a group. Journal of Experimental Social Psychology, 27, 297-323. [ Links ]
Mullen, B., & Hu, L. (1989). Perceptions of in-group and out-group variability: A meta-analytic integration. Basic and Applied Social Psychology; 10,233-252. [ Links ]
Ostrom, T. M., & Sedikides, C. (1992). Out-group homogeneity effects in natural and minimal groups. Psychological Bulletin, 112, 536-552. [ Links ]
Ostrom, T. M., Carpenter, S. L., Sedikides, C, & Li, F. (1993). Differential processing of in-group and out-group information. Journal of Personality and Social Psychology, 64,21-34. [ Links ]
Park, B., & Judd, C. M. (1990). Measures and models of perceived group variability. Journal of Personality and Social Psychology, 59,173-191. [ Links ]
Park, B., & Rothbart, M. (1982). Perception of out-group homogeneity and levels of social categorization: Memory for the subordinate attributes of in-group and out-group members. Journal of Personality and Social Psychology, 42, 1051-1068. [ Links ]
Park, Ryan, C. S., & Judd, C. M. (1992). Role of meaningful subgroups in explaining differences in perceived variability for in-groups and out-groups. Journal of Personality and Social Psychology, 63,553-567. [ Links ]
Quattrone, G. A. (1986). On the perception of a group's variability. In S. Worchel & W. Austin (Eds.), The Psychology of Intergroup Relations (2nd ed., pp. 25-48). Chicago: Nelson-Hall. [ Links ]
Quattrone, G. A., & Jones, E. E. (1980). The perception of variability within ingroups and outgroups: Implications for the law of small numbers. Journal of Personality and Social Psychology, 38,141-152. [ Links ]
Roenker, D. L., Thompson, C. R, & Brown, S. C. (1971). Comparison of measures for the estimation of clustering in free recall. Psychological Bulletin, 76,45-48. [ Links ]
Sedikides, C. (1997). Differential processing of ingroup and outgroup information: The role of relative group status in permeable boundary groups. European Journal of Social Psychology, 27,121-144. [ Links ]
Sedikides, C, & Ostrom, T. M. (1988). Are person categories used when organizing information about unfamiliar sets of persons? Social Cognition, 6,252-267. [ Links ]
Simon, B. (1992). The perception of ingroup and outgroup homogeneity: Reintroducing the social context. In W. Stroebe & M. Hewstone (Eds.), European Review of Social Psychology (vol. 3, pp. 1-30). Chichester: Wiley. [ Links ]
Simon, B. (1998). The self in minority-majority contexts. In W. Stroebe & M. Hewstone (Eds.), European Review of Social Psychology, (vol. 9, pp. 1-30). Chichester: Wiley. [ Links ]
Simon, B., & Brown, R. (1987). Perceived intragroup homogeneity in minority-majority contexts. Journal of Personality and Social Psychology, 53, 703-711. [ Links ]
Simon, B., & Hamilton, D. L. (1994). Self-stereotyping and social context: The effects of relative in-group size and in-group status. Journal of Personality and Social Psychology; 66, 699-711. [ Links ]
Simon, B., Glâssner-Bayerl, B., & Stratentwerth, I. (1991). Stereotyping and self-stereotyping in a natural intergroup context: The case of heterosexual and homosexual men. Social Psychology Quarterly, 54,252-266. [ Links ]
Simon, B., & Pettigrew, T. F. (1990). Social identity and perceived group homogeneity: Evidence for the ingroup homogeneity effect. European Journal of Social Psychology, 20,269-286. [ Links ]
Smith, E. R., & Zarate, M. A. (1992). Exemplar-based models of social judgment. Psychological Review, 99, 3-21. [ Links ]
Stewart, T. L., Vassar, P. M., Sanchez, D. T., & David, S. E. (2000). Attitude toward women's societal roles moderates the effect of gender cues on target individuation. Journal of Personality and Social Psychology; 79,143-157. [ Links ]
Taylor, S. E., Fiske, S. T., Etcoff, N. L., & Ruderman, A. J. (1978). Categorical bases of person memory and stereotyping. Journal of Personality and Social Psychology, 36, 778-793. [ Links ]
Voci, A. (2000). Perceived group variability and the salience of personal and social identity. In W. Stroebe & M. Hewstone (Eds.), European Review of Social Psychology (vol. 11, pp. 177-221). Chichester: Wiley. [ Links ]
Wilder, D. A. (1984). Predictions of belief homogeneity and similarity following social categorization. British Journal of Social Psychology, 23,323-333. [ Links ]
Wittenbrink, B., Judd, C. M., & Park, B. (1997). Evidence for racial prejudice at the implicit level and its relationship with questionnaire measures. Journal of Personality and Social Psychology, 72, 262-274. [ Links ]
Zarate, M. A., & Smith, R. E. (1990). Person categorization and stereotyping. Social Cognition, 8,161-185. [ Links ]
Notes
1 This study was supported by a Calouste Gulbenkian Foundation grant to the first author and by a Swiss National Science Foundation grant (FNRS-1114-052345.97) to the second author. A first version of this paper was presented at the 12th General Meeting of the European Association of Experimental Social Psychology in Oxford on 1999. We express our gratitude to two anonymous reviewers, who provided constructive advice on earlier drafts of this manuscript.
2Angola was a colony of Portugal up to November 11, 1975. Since the Portuguese Revolution of 25 April 1974, many people from the former African colonies came to Portugal. Nowadays the Angolans are the second African group of immigrants in Portugal (about 30.000 people). All the Angolan participants in the present research were born in Angola and came to Portugal for educational (83.3%) or work (1.9%) purposes. They came alone (35.2%), with their families (50.0%) or with friends (9.3%). They reported having lived in Portugal for an average of seven years.
3Preliminary analyses of the data indicated that participants' gender did not produce any reliable effect. Therefore, the results reported in this paper collapsed across male and female participants.
4As the number of between-groups errors expected by chance is higher than the number of within-groups errors, we corrected the between-groups errors by multiplying by 3/4, following Taylor et al. (1978) procedure.

