


 English (pdf)
 Article in xml format
 Article references
 Send this article by e-mail
 Cited by SciELO
  Similars in
SciELO
Similars in
SciELO 
 Permalink
Social media can be defined as any electronic service through which Internet users can create and share various contents over the Internet. They include social media websites, online game zones, media content-sharing sites, online rating and review forums, and online groups (PrakashYadav & Rai, 2017). Social media sites are web-based operators that emerge as platforms where people share their information, pictures, and daily lives (Ulusoy & Atar, 2020), allowing individuals to create private or public online profiles and use them to interact and develop relationships with other users (Zhang & Rau, 2021). Users’ social media activities are generally classified as either contribution or consumption tasks (Bryant et al., 2019). However, the social media meaning (Hadley, 2017) and social media role have changed over time (Zolkepli & Kamarulzaman, 2015), as the contemporary social media user does not share the same profile as users of some years ago (Hunter et al., 2018).
Social media platforms have empowered users to share their opinions and experiences with their peers (Chetioui et al., 2020). The number of social media users worldwide in 2020 was 3,6 billion, expected to reach 4,4 billion in 2025 (Statista, 2021). The most popular social media worldwide are Facebook (2,740 million active users), YouTube (2,291 million), WhatsApp (2,000 million), and Instagram (1,221 million). Individuals have various motivations for using social media sites like Facebook, YouTube, WhatsApp, Instagram, Tumblr, and Twitter, and every social media has unique capabilities and offerings that satisfy users (Kane, 2017). In fact, on Facebook, each registered user has a personal profile showing their posts and content, and the format of individual user pages (Timeline) is a chronological feed of a user's stories, including status updates, photos, interactions with apps, and events (Nadkarni & Hofmann, 2012). Facebook has some differentiating features: user profile/personal timeline, news feed, like button, instant messaging, following and privacy controls (Nadkarni & Hofmann, 2012). YouTube is an online video sharing and social media platform that offers several services: YouTube Community, YouTube Go, YouTube Kids, YouTube Movies, YouTube Music, YouTube Premium, YouTube Shorts, YouTube Stories, TestTube, and YouTube TV. YouTube enables subscribers to create, upload, and share original content ranging from homemade videos to movie scenes (Salyer & Weiss, 2020). Interaction with YouTube as a social space allows the discovery of new materials in a self-directed mode, thus satisfying different information-seeking goals (Dubovi & Tabak, 2020). WhatsApp is a mobile instant messaging application that allows interactive multimedia one-on-one communication and communication in closed, members-only groups (Rosenberg & Asterhan, 2018). Users can switch between group and private discourse, which is the most popular WhatsApp feature among users (Rosenberg & Asterhan, 2018). Instagram, another social media platform, is “more image focus-oriented than Facebook, allowing users to enhance the appearance of their photos through several filters” (Limniou et al., 2021, p. 1). Instagram users may share their created images with private followers or with the wider public network that may “like” their photo posts and “tag” their images with identifying words (Limniou et al., 2021). Twitter is a microblogging and social networking service on which users post and interact with messages known as “tweets”. Registered users can post, like, and retweet tweets; however, unregistered users can only read tweets that are publicly available. Tweets are restricted to 280 characters, and audio and video tweets are limited to 140 seconds for most accounts (Karami et al., 2020). Tumblr is also a microblogging and social networking website allowing users to post multimedia and other content to a short-form blog. Users can follow other users’ blogs, and bloggers can also make their blogs private (McCracken et al., 2020). Finally, Snapchat is a mobile application that provides a time-limited instant messaging service (Makki et al., 2018). This application allows users to send photos, videos, and messages to select “friends,” or to post photos and videos (“snaps”), or messages that can be viewed by all “friends” for 24 hours (Piwek & Joinson, 2016). Once the receiver has looked at the “snap”, it disappears in one to ten seconds (Utz et al., 2015).
Social media is not free from controversy, being a useful developmental context for handling issues typical of adolescence, such as gender and identity exploration, self-expression, and the increased need for peer acceptance (Gerwin et al., 2018). However, several studies show evidence that social media addiction is a growing problem among emerging adults (e.g., Liu & Ma, 2018). As adolescents and young adults are primary targets for social media platforms, social media use may bring significant psychosocial benefits (such as emotional support and community building, and self-expression) but also negative impacts (such as physical conditions - obesity, diabetes; psychosocial problems, and a decrease in well-being; Griffiths et al., 2018). Moreover, although adolescents may be a more vulnerable group due to their developmental characteristics and are a target population for attracting new users to social media platforms, young adults or people of older age groups are those who tend to spend more time using social media. In fact, older people who are open to new activities are more likely to engage in social media use; younger generations use the Internet as a social media tool because they are extraverted (Correa et al., 2010).
Although only a small minority of adolescents experience negative physical, social and psychological consequences resulting from excessive and problematic social media use, such use has been found to have a negative association with academic achievement, cognitive impairment, symptoms of distraction, procrastination, and attention deficit hyperactivity disorder (Griffiths et al., 2018). Bányai et al. (2017) also found that adolescents with low self-esteem and a high level of depression symptoms presented elevated social media use. Social media platforms have addictive potential “by design” (Bayer et al., 2022), and some individuals may present vulnerability factors for addictive behaviors (Csibi et al., 2021), which provides a stronger stance for the relevance of the scale under study.
Thus, social media addiction has emerged as a global concern, with researchers worldwide conducting studies to evaluate how pervasive the problem is (Cheng et al., 2021). Several factors, such as personal (demographic characteristics, personality traits, self-esteem, well-being, loneliness, anxiety, and depression); social (need for affiliation, subjective norms, personal, professional, and academic life); and situational (amount of social media use and motives of use) impact on social media addiction (Kirezli & Aydin, 2021). Concerning personality factors, neuroticism, extraversion and psychological states, such as fear of missing out (FoMO) and nomophobia (‘no mobile phone phobia’), seem to be the aspects that are most associated with problematic use of social media (Griffiths et al., 2018). Furthermore, Casale et al. (2018) found that FoMO and self-presentational skills are associated with problematic social media use through the mediation of positive metacognitions.
Based on the assumption that behavioral addictions and substance addictions must be defined based upon their similarities and not on their differences, Griffiths et al. (2018) stated that excessive social sites use (in adolescence and emerging adulthood) might lead to symptoms associated with substance-related and behavioral addictions (such as gambling addiction). Excessive and problematic social media use in adolescence is associated with excessive and problematic smartphone use and the parallel use of multiple devices (Griffiths et al., 2018). Social media is a platform we use every day and spend much time on. Indeed, Drahošová and Balco (2017) found that one of the most important disadvantages of using social media is the increased percentage of time spent on social media. Although measuring the amount of time spent on media activities and using media devices is hard, it continues to be worth the effort (Rideout, 2016). In fact, some authors have shown that most social media users report spending time on it several times a day (Auxier & Anderson, 2021). Besides this, some authors distinguish how much time youth spend on social media from how they use it (Scott et al., 2017), and when authors speak about social media problematic use and addiction to social media, they all assess the time spent on it (Bányai et al., 2017).
Several instruments evaluate the addiction to social media, including the Bergen Social mediating Addiction Scale (BSNAS; Andreassen et al., 2016). This is an adaptation of the Bergen Facebook Addiction Scale (BFAS; Andreassen et al., 2012) and contains six items reflecting core addiction elements: salience, conflict, mood modification, withdrawal, tolerance, and relapse (Griffiths, 2005). There is also the Social Media Addiction Scale (SMAS; Al-Menayes, 2015), which was adapted from Young's Internet Addiction Test (Young, 1998), and consists of 14 items that evaluate the symptoms of addiction to social media through three factors (Withdrawal and Social Problems, Time Management and Performance and Reality Substitute).
In Portugal, Pontes et al. (2016) validated the Bergen Facebook Addiction Scale, and Assunção and Matos (2017) validated the Generalized Problematic Internet Use Scale 2 for Facebook. However, both instruments were validated for a single social media with specific characteristics and different from other social media. In Portugal, there is currently no knowledge of a validated scale of addiction to social media in general. This study aims to fill this gap by validating, for the Portuguese population, the scale of addiction to social media as proposed by Al-Menayes (2015). Accordingly, the hypotheses considered are:
Hypothesis 1 (H1): A good model to fit the Portuguese population regarding the SMAS will be found.
Hypothesis 2 (H2): Participants with higher addiction levels spend more time online.
Method
Procedures
All procedures followed the Declaration of Helsinki and later amendments or comparable ethical standards. All participants were recruited and assessed through some Google Forms. Participants were informed about the study’s purpose, and confidentiality and anonymity of the data were ensured. All participants signed informed consent. Participants under 18 years old were duly authorized by their parents or guardian authorities. The study was conducted from January to March 2020, and participants were contacted via social media. The following criteria were used to select participants: to be a minimum of 14 years old; have Portuguese nationality and residence; to be a subscriber to one or more social media and use social media at least once a week. Exclusion criteria included being under 14 and over 25; not understanding the content of the questions asked; and not using social media.
The original version of the Social Media Addiction Scale (SMAS) was first translated from English to Portuguese by two bilingual translators, one from and another not from the field of psychology. Then, a third bilingual translator from the field of psychology provided a reconciliation of the two translations. Next, a native English speaker not from the psychology field independently performed the reconciled version's back-translation. Finally, the first translator reviewed the back-translated version of the scale and compared it with the original English version to ensure linguistic and cultural equivalence consistency. 20 students enrolled in social media were invited to evaluate the items’ relevance to the scale and cultural context. Each item was rated on a three-point scale (1 - not relevant, 2 - somewhat relevant, 3 - relevant). The content validity index was computed concerning item and scale. The item content validity was calculated by the proportion of experts who rated 3, and the scale content validity was determined as the mean of the item content validity. Finally, another 20 students proficient in both English and Portuguese were invited to complete the original and Portuguese version (SMAS-PV) of the SMAS and to evaluate the face validity of the scale through comments on the item appropriateness and interpretability and the time needed to answer the scale. Data were randomly split into two subsamples, and a two-step analysis was applied (Fabrigar et al., 1999).
Measurements
A self-report questionnaire was developed for data collection, including questions to assess the socio-demographic profile of the respondents (age, sex, and educational level); evaluation and description of the use level of social media; and the SMAS-PV questionnaire. The Social Media Addiction Scale (SMAS; (Al-Menayes, 2015) was adapted from the Young's Internet Addiction Test (Young, 1998). This instrument evaluates the symptoms of addiction to social media through three factors and 14 items (Table 1). Each item is answered on a 5-point Likert scale ranging from “1 - strongly disagree” to “5 - strongly agree”. Factor 1 includes the deterioration of school performance, driving, not meeting friends, and thinking about social media, when not using them (Young items 10, 11, 12, 13; Al-Menayes items 1, 2, 3, 4; ( = 0.70). Factor 2 involves social media overuse, neglecting schoolwork, feeling irritable, and lacking sleep due to social media usage (Young items 1, 3, 4, 7; Al-Menayes items 5, 6, 7, 8; ( = .73). Factor 3 has two items, one dealing with boredom and the other with the need to use social media (Al-Menayes, 2015; Young items 2, 5; Al-Menayes items 9, 10; ( = 0.94). Al-Menayes (2015) excluded Young items (6, 8, 9, and 14) with low loadings (under 0.50). High values are associated with high addiction to social media.
Table 1 Social Media Addiction Scale - SMAS (14 items).
| 1. I often find myself using social media longer than intended. |
| 2. I often find life to be boring without social media. |
| 3. I often neglect my schoolwork because of my usage of social media. |
| 4. I get irritated when someone interrupts me when I am using social media. |
| 5. Several days could pass without me feeling the need to use social media* |
| 6. Time passes by without me feeling it when I am using social media. |
| 7. I find it difficult to sleep shortly after using social media. |
| 8. I would be upset if I had to cut down the amount of time that I spend using social media. |
| 9. My family frequently complains of my preoccupation with social media. |
| 10. My school grades have deteriorated because of my social media usage. |
| 11. I often use social media while driving. |
| 12. I often cancel meeting my friends because of my occupation with social media. |
| 13. I find myself thinking about what happened on social media when I am away from them. |
| 14. I feel my social media usage has increased significantly since I began using them. |
Note: Item wording was reversed.
Data analysis
Prior to analysis, the normality of items was examined by skewness (SI) and kurtosis (KI) indexes. Absolute values of SI less than 3 and KI less than 10 indicate non-severe violations of normality (Kline, 2015). An Exploratory Factorial Analysis (EFA) with polychoric matrix (for ordinal data) of SMAS was carried out using the FACTOR program (Ferrando & Lorenzo-Seva, 2017; Lorenzo-Seva & Ferrando, 2006; 2013). The number of extracted factors were two (no second order factors) and the procedure for determining the number of dimensions included three methods: (1) optimal implementation of Parallel Analysis (PA) with 2,000 random samples (Timmerman, & Lorenzo-Seva, 2011); (2) Velicer’s (1976) minimum average partial test (MAP); and (3) the Hull method (Lorenzo-Seva et al., 2011). Item location and item adequacy indices were also assessed by the quartile of ipsative means (QIM); the relative difficulty index (RDI) and the measure of sampling adequacy (MSA). Concerning QIM, in a normal-range test, few items should be placed in the extreme quartiles, whereas most items should be placed in the central quartiles. Regarding RDI, for a normal-range test, an optimal pool of items should have about 75% RDI values between 0.40 and 0.60 and the remaining values evenly distributed in both tails. Concerning MAS, values below 0.50 suggest that the item does not measure the same domain as the remaining items in the pool, and so should be removed. The method for factor extraction was robust unweighted least squares (RULS), with the rotation to achieve factor simplicity being robust Promin oblique rotation (Lorenzo-Seva & Ferrando, 2019). To ensure discriminant validity, items should load significantly only on one factor. The minimum loading accepted is 0.32, and communalities lower than 0.40 suggest that items may not be related to other items. Complex items, loading over 0.32 on more than one factor and differing less than 0.20, were excluded (Tabachnick & Fidell, 2007).
Construct replicability was also assessed (the proportion of the factor variance that can be accounted for by its indicators) using the H index, ranging from 0 to 1, with acceptable values when H ≥ 0.70 (Hancock & Mueller, 2001). Internal consistency was measured by Cronbach’s coefficient alpha (() and considered acceptable for values above 0.70 (Hair et al., 2013). The component structure of SMAS-PV was subject to a CFA procedure with maximum likelihood estimation (MLE). The model fit evaluation was based on test statistics and approximate fit indexes, following the thresholds presented in Kline’s book (Kline, 2015). Thus, a statistically non-significant model chi-square statistic, χ², states that the model fits the data acceptably in the population: the higher the probability related to χ², the closer the fit to the perfect fit. A value of the parsimony-corrected index Steiger-Lind root mean square error of approximation (RMSEA) close to 0 represents a good fit. RMSEA ≤ 0.05 may indicate a good fit, but the upper bound of the 90% confidence interval exceeding 0.10 may indicate a poor fit. Moreover, this test should be non-significant at the 0.05 level. Values of the incremental fit index (IFI), the Tucker-Lewis index (TLI) and the Bentler incremental comparative fit index (CFI), close to 1 (0.95 or better), are indicators of best fit.
Besides goodness-of-fit index evaluation, model re-specification involved analyzing path estimates, standardized residuals of items, and the modification indices for all non-estimated parameters. For construct validity, items with low individual standardized factor loadings (regression weights below 0.50) are candidates for removal. The modification indices (MI) provide information about potential cross-loadings and error term correlations not specified in the model, as well as about the expected change in the chi-square value for each fixed parameter if it were to be freed. Only modifications theoretically meaningful and MI > 11 were considered. To compare the fit across models, two indexes were used: the parsimony-adjusted index Akaike Information Criterion (AIC), and the standardized root mean square residual (SRMR), a statistic related to the correlation residuals (SRMR over 0.10 suggests fit problems). The smaller the values, the more parsimonious the model. Finally, to ascertain the model reliability, convergent and discriminant validity, Cronbach’s alpha coefficients, composite reliability (CR), and average variance extracted (AVE) were calculated. A CR value of 0.70 or higher suggests good model reliability; an AVE of 0.50 or higher suggests adequate convergence, and if AVE is less than 0.50 with CR higher than 0.60, the convergent validity of the model is still adequate (Fornell & Larcker, 1981).
Group differences were analyzed. The decision about what comparison test to use relied on the evaluation of normality and homogeneity assumptions. To compare the means of two groups, the independent means t-test, or the Welch- Satterthwaite’s t-test were applied. The first assumes the normality and homoscedasticity of the distribution variable; the second relaxes these assumptions, approximating the t distribution and the degrees of freedom. In case of unequal sample size, the decision between applying the t-test or the alternative Welch’s t-test is supported by the one-way analysis of variance (ANOVA) or F-test result. If the F-statistic is not statistically significant at the 0.025 alpha level, then the t-test is chosen; otherwise, the alternative test is used. To compare the means of more than two groups, the F-test was applied. The test assumes that the variable is normally and independently distributed, with equal variances among groups. According to Tabachnick and Fidell (2007), the F-test is robust if samples sizes are large enough and variances within levels are relatively equal. The Central Limit Theorem assures that the sampling distribution of means is normally distributed for large enough samples. An adequate homogeneity of variance requires that the ratio of largest to smallest sample size should be no greater than 4:1 and the ratio of largest to smallest variance should be no greater than 10:1. Two measures of the effect-size, the point-biserial correlation and the eta squared, were used according to the level of measurement of the variables: interpretation followed Cohen (1988) guidelines. The statistical significance level was set at 0.05. Statistical analysis was performed using SPSS version 28, AMOS version 28 and FACTOR.
Sample characterization
The sample consists of 605 students, about 62.5% women. The ages range from 15 to 25 years, with the approximate average age being 20 years (M = 19.5, SD = 2.4), and the median age of the sample 19. The majority are high school students (46.1%), followed by students attending a bachelor’s (37.4%) or a master’s (11.2%) degree. Only 5.3% attend the 9th grade of the basic education level. The majority of the participants have been using the Internet (60.8%) and social media (64.3%) for 5 to 10 years. The devices used to access are the telephone (98.2%) or the computer (82.6%). They use up to 13 different social media, a third of the sample use three (33.2%), and on average, 3.3 (SD = 1.7). The most used social media are Facebook (92.2%), Instagram (82.5%), and Snapchat (56.5%). Regarding the frequency of use, most use it from 1 to 4 hours a day (48.1%), and during school hours (78.2%). The characteristics of the two randomly created subsamples and the total sample are similar, as shown in Table 2. The EFA subsample presents a mean age of 19 years (M = 19.35, SD = 2.31) and the CFA subsample a mean age of 19 years (M = 19.22, SD = 2.41).
Table 2 Social media (SM) usage and demographic variables’ frequencies (%).
| Analyzed aspects | Characteristics | Sample (%) | Subsample EFA (%) | Subsample CFA (%) |
|---|---|---|---|---|
| Demographics | 605 | 305 | 300 | |
| Gender | Women | 62.5 | 62.6 | 60.0 |
| Men | 37.5 | 37.4 | 40.0 | |
| Level of school enrolment | 9th degree | 5.3 | 3.6 | 7.7 |
| Secondary degree | 46.1 | 50.5 | 43.7 | |
| Bachelor’s degree | 37.4 | 36.1 | 35.3 | |
| Master’s degree | 11.2 | 9.8 | 13.3 | |
| Social Media | ||||
| Years of Internet use | 1 to 4 years | 10.1 | 10.2 | 14.0 |
| 5 to 10 years | 60.8 | 58.7 | 63.3 | |
| More than 10 years | 29.1 | 31.1 | 22.7 | |
| Years of SM use | Less than 1 year | 1.3 | 2.0 | 1.7 |
| 1 to 4 years | 27.1 | 28.2 | 33.3 | |
| 5 to 10 years | 64.3 | 63.9 | 61.3 | |
| More than 10 years | 7.3 | 5.9 | 3.7 | |
| Used SM | 92.2 | 93.8 | 92.3 | |
| 82.5 | 82.0 | 79.0 | ||
| Snapchat | 56.5 | 57.0 | 60.0 | |
| 30.2 | 31.1 | 22.7 | ||
| Other* | 63.4 | 66.9 | 59.7 | |
| Number of SM used | 1 | 12.4 | 10.2 | 16.7 |
| 2 | 20.8 | 22.6 | 22.3 | |
| 3 | 33.2 | 34.8 | 38.3 | |
| 4 | 16.9 | 13.8 | 16.3 | |
| 5 | 7.6 | 9.5 | 4.7 | |
| 6 | 4.5 | 5.6 | 1.7 | |
| ≥ 7 | 4.8 | 3.7 | 3.6 | |
| Daily frequency of SM | Less than 1 hour | 20.0 | 21.3 | 22.0 |
| 1 to 4 hours | 48.1 | 44.9 | 57.7 | |
| 5 to 7 hours | 21.0 | 23.9 | 13.7 | |
| More than 7 hours | 10.9 | 9.8 | 6.7 | |
| Device used to access SM | Personal computer | 82.6 | 82.3 | 84.0 |
| Phone | 98.2 | 97.4 | 98.0 | |
| SM use during school hours | Yes | 78.2 | 77.0 | 76.3 |
Note: *Google Plus, Linkedin, Skype, YouTube, Tumbler, Tinder, Happn, and WhatsApp.
Results
Exploratory Factorial Analysis (EFA) with polychoric matrix (for ordinal data) of SMAS
The sample used for EFA consisted of 305 cases. Item normality was evaluated by skewness and kurtosis indexes; except for item 12 (SI = 4.10 and KI = 19.70), the items did not present severe violations of normality (SI from -0.50 to 2.12 and KI from -1.21 to 4.52). However, since the sample size is over 200, the effect of significant departure from normality may be negligible (Hair et al., 2013). The means of the items range from 1.15 (CI 1.08 - 1.23; item 12) to 3.32 (CI 3.12 - 3.51; item 1) and the variance from 0.26 (item 12) to 1.94 (item 11). Following the guidelines by Field (2013), the calibration sample data were verified for items with zero or near-zero variance. Item variance ranged from 0.225 (item 12) to 1.941 (item 11). The covariance matrix (polychoric correlation) ranges from 0.02 (between items 5 and 12) to 0.611 (between items 13 and 14). Item location and item adequacy indices were also assessed by QIM, RDI and MSA. Based on these criteria, three items (items 5, 10 and 12) could be removed. The PA (based on the 95% percentile) in conjunction with the MAP test and the Hull method suggested a two-factor structure. The AFE was performed after this, as the KMO value of 0.86 indicated good adequacy of the tetrachoric correlation matrix. The significance of Bartlett’s sphericity test, χ2(91)= 2038.60; p< .001, revealed that the correlations between items were adequate to conduct an EFA. The two-component structure (with eigenvalues equal to 6.08 and 1.44 that explained 53.7% of total variance) presented items with communalities lower than 0.30 (items 5 and 7); consequently, four items (5, 7, 10 and 12) were removed.
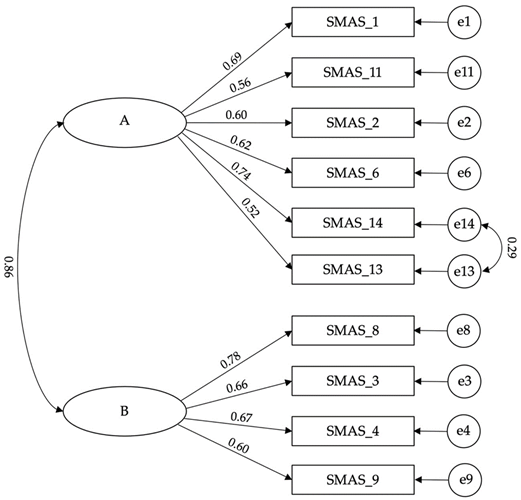
After removing the four items, all the procedures were repeated. Item normality, evaluated by skewness and kurtosis did not present violations of normality (SI from 0.03 to 1.94 and KI from 0.19 to 2.14). The means of the 10 items range from 1.60 (CI 1.08 - 1.23; item 4) to 3.32 (CI 3.12 - 3.51; item 1) and the variance from 0.85 (item 4) to 1.94 (item 11). The covariance matrix (polychoric correlation) ranges from 0.23 (between items 2 and 3) to 0.611 (between items 13 and 14). The PA (based on the 95% percentile) in conjunction with the MAP test and the Hull method again suggested a two-factor structure. The Bartlett's statistic was 1348.6, df = 45, p < .001; the Kaiser-Meyer-Olkin (KMO) test was 0.87 (good). The two-component structure (with eigenvalues equal to 4.93 and 1.03) explained 59.6% of total variance. All items on each factor presented significant loadings (0.30 or more) and communalities above 0.300 (from 0.325 to 0.613). Construct replicability was good (H = 0.91). Semantic analysis of the items was performed, and Factor 1 was named Social Consequences (items 3, 4, 8 and 9), and Factor 2, Compulsive Feelings (items 1, 2, 6, 11, 13 and 14). Both factors showed good reliability (0.72 and 0.81, respectively; Table 3).
Table 3 SMAS-PV: loadings on components and communalities (h 2).
| Items | SC | CF | h 2 |
|---|---|---|---|
| 1 | -0.00 | 0.80 | 0.61 |
| 2 | 0.04 | 0.61 | 0.43 |
| 6 | 0.03 | 0.60 | 0.42 |
| 11 | -0.07 | 0.64 | 0.39 |
| 13 | 0.18 | 0.43 | 0.39 |
| 14 | 0.17 | 0.62 | 0.61 |
| 3 | 0.47 | -0.23 | 0.49 |
| 4 | 0.94 | 0.20 | 0.86 |
| 8 | 0.44 | 0.33 | 0.59 |
| 9 | 0.34 | 0.24 | 0.33 |
| Eigenvalues | 1.03 | 4.93 | |
| Variance explained (%) | 10.32 | 49.26 | |
| Cronbach’s alpha | 0.72 | 0.81 |
Confirmatory Factorial Analyses (CFA)
The subsample used for CFA included 300 cases. The normality of the items was evaluated by skewness and kurtosis indexes; the items (1, 2, 3, 4, 6, 8, 9, 11, 13, 14) did not present severe violations of normality (SI from -0.60 to 1.72 and KI from -1.14 to 2.60). The fitness statistics for the one-factor model were unsuitable, providing evidence that the SMAS has multiple factors (Table 6). The model of the two factors suggested by the EFA was also unsuitable. Modification indices (MI) suggested a correlation between items 13 and 14 on the Compulsive Feelings dimension (MI = 19). With this modification, all model statistics and indexes improved significantly (Fig. 1, Table 4). The values of AIC and SRMR were better for the third model, indicating that the modified model was the most parsimonious. The composite reliability for Compulsive Feelings (CF: items 1, 2, 6, 11, 13 and 14) was 0.79, and 0.70 for Social Consequences (SC: items 3, 4, 8, and 9), both achieving the threshold of 0.70. In terms of discriminant validity, the AVE for Social Consequences was 0.50, and 0.55 for the Compulsive Feelings’ AVE. The square root of AVE for Compulsive feelings was 0.74, and 0.71 for Social Consequences. Cronbach’s alpha for Compulsive feelings was 0.79, and 0.74 for Social Consequences.
Table 4 Goodness of fit indexes for the one-factor, two-factors and two-factors with one correlation between errors models for the Portuguese version of SMAS.
| χ2 | DF | χ2/DF | IFI | TLI | CFI | GFI | SRMR | RMSEA | LO90 | HI90 | AIC | |
|---|---|---|---|---|---|---|---|---|---|---|---|---|
| One factor | 148.70 | 35 | 4.25 | 0.892 | 0.860 | 0.891 | 0.904 | 0.058 | 0.104 | 0.087 | 0.122 | 188.70 |
| Two factors | 132.52 | 34 | 3.90 | 0.907 | 0.875 | 0.906 | 0.912 | 0.055 | 0.098 | 0.081 | 0.116 | 174.52 |
| Two factors with 1 correlation between errors | 67.17 | 33 | 204 | 0.966 | 0.950 | 0.965 | 0.958 | 0.044 | 0.062 | 0.042 | 0.083 | 115.17 |
Note: χ 2= qui-squared; DF = default freedom; IFI = incremental fit index; TFI= Tucker-Lewis index; CFI = comparative fit index; GFI = SRMS = standard root mean square; RMSEA = root mean square error of approximation; CI = confidence interval; AIC = Akaike information criterion.
Comparison of mean SMAS score for independent groups
To compare the independent groups defined by the demographic variables and the use of social media variables with respect to their average SMAS-PV scores, the assumptions of normality and homogeneity were evaluated, and the appropriate tests applied. The test results are presented in Table 5.
The SMAS-PV total score ranged from 1.00 to 4.70, with an average of 2.49 and a large coefficient of sample size variation (37.1%). Half of the sample presented mean scores above 2.47 and the middle fifty, between 1.86 and 3.05 (IQR = 1.19). The Compulsive Feelings SMAS component mean score was higher than the total mean score, 2.88, and had a similar variation (31.7%). The median score was 2.91, and the central half of the sample scored from 2.35 to 3.85 (IQR = 1.50). The Social Consequences SMAS component scored from 1.00 to 4.50 and presented the lowest mean, 1.90, and the largest variation, 43.3%. The upper half of the sample presented results above 1.75, and 50% of the sample scored below 2.00.
The mean scores of males and females on the Compulsive Feelings SMAS-PV factor are significantly different, with women presenting greater mean scores than men, according to Welch's t-test. The association between CF and gender is significantly small. Students attending a higher level of education showed statistically significant higher scores on social media addiction mean scores, according to Welch's t-test. Significantly small correlations were found between the higher education level and SMAS (higher level of education accounts for 2% to 6% of the SMAS variability). Students who use social media during school hours revealed significantly higher SMAS mean scores, according to Welch's t-test. Students’ use of social media during school hours accounts for 18%, 21%, and 4% of the variability in, respectively, total social media addiction, compulsive feelings, and social consequence components.
The comparison of SMAS mean scores by daily frequency of SM usage required the recategorization of the variable: low (less than 1 hour), moderate (1 to 4 hours), and high (more than 4 hours) usage. Each group’s final size ensured the normality of the sampling distribution of means. The sample size ratio (2.18) and the variance ratios for SMAS total (2.67), SMAS CF (2.51), and SMAS SC (4.10) met the criterion of adequate homogeneity of variance. The variance test analysis showed a significant effect of daily frequency on SM usage on all SMAS scores, medium to large. Pairwise comparisons of the means, using Tukey’s HSD procedure, indicated that those with a low daily level of SM use have significantly lower social media addiction scores (total, CF, and SC), p < .001, than those with moderate and high daily level use. Furthermore, those with moderate daily level use have significantly lower social media addiction scores (total, CF, and SC), p < .001, than those with high daily level use.
Table 5 Independent group comparison: Mean (M) and standard deviation (SD) distributions, tests results and corresponding effect sizes (d and η 2).
| SMAS-PV Total | SMAS-PV CF | SMAS -PV SC | |||||||||||
|---|---|---|---|---|---|---|---|---|---|---|---|---|---|
| M (SD) | M (SD) | M (SD) | |||||||||||
| n | t | p | d | t | p | d | t | p | d | ||||
| Gender | |||||||||||||
| Females | 378 | 2.54 (0.80) | 1.85 | .065 | 0.16 | 2.96 (0.91) | 2.81 | .005 | 0.24 | 1.90 (0.78) | -0.13 | .887 | -0.01 |
| Males | 227 | 2.41 (0.81) | 2.75 (0.91) | 1.91 (0.86) | |||||||||
| Higher level of education attendance | |||||||||||||
| No | 311 | 2.30 (0.84) | -6.16 | <.001 | -0.50 | 2.65 (0.98) | -6.73 | <.001 | -0.55 | 1.78 (0.82) | -3.88 | <.001 | -0.32 |
| Yes | 294 | 2.69 (0.71) | 3.13 (0.77) | 2.03 (0.79) | |||||||||
| Use of social media during school | |||||||||||||
| No | 132 | 1.87 (0.69) | -10.89 | <.001 | -1.07 | 2.12 (0.80) | -12.09 | <.001 | -1.19 | 1.51 (0.67) | -6.58 | <.001 | -0.65 |
| Yes | 473 | 2.66 (0.75) | 3.09 (0.83) | 2.02 (0.82) | |||||||||
| Daily frequency of social media | |||||||||||||
| F | p | η2 | F | p | η2 | F | p | η2 | |||||
| Low (less than 1 hour) | 121 | 1,83 (0.65) | 77.93 | <.001 | 0.21 | 2,13 (0.86) | 78.02 | <.001 | 0.21 | 1,38 (0.53) | 43.97 | <.001 | 0.13 |
| Moderate (1 to 4 hours) | 291 | 2,51 (0.73) | 2,91 (0.80) | 1,92 (0.79) | |||||||||
| High (more than 4 hours) | 193 | 2,87 (0.75) | 3,31 (0.81) | 2,21 (0.84) | |||||||||
Note: d = Cohen’s d size effect correlation; η2 = eta squared size effect.
ppp
Discussion
The addiction to social media is a current problem that is becoming more relevant every day because of the widespread use of the Internet. It is highly important to identify a problematic use of social media and to intervene psychologically in a timely manner. Thus, this study aims to validate the scale of addiction to social media for a Portuguese sample (SMAS-PV).
The Social Media Addiction Scale (SMAS; Al-Menayes, 2015) was adapted from Young's Internet Addiction Test (Young, 1998), consisting of 14 items, with the aim of evaluating the symptoms of addiction to social media through three factors. (Factor 1 includes the deterioration of school performance, driving, not meeting friends, and thinking about social media when not using them. Factor 2 includes social media overuse, neglecting schoolwork, feeling irritable, and lacking sleep due to social media usage. Factor 3 has two items, dealing with boredom and the need to use social media). After performing a categorical principal component analysis, followed by confirmatory factor analysis, the Portuguese version of this instrument includes nine items distributed by two dimensions: compulsive feelings (5 items) and social consequences (4 items). In fact, five items were removed to achieve a better model for the study sample. The reliability values of the subscales are very close to those of the author’s original version. However, it is impossible to compare these subscales because the rearrangement of the items changed considerably, notwithstanding the fact that we kept the designation of two of the three original factors. One of the reasons that may explain the difference between the original version and the Portuguese version is the fact that there are seven years between one version and the other. As a result, there have been: (1) numerous changes in the social media themselves (Kane, 2017), with the development of new services on each social media (Limniou et al., 2021); (2) new social media have appeared with a new and different ethos from the existing ones (Bryant et al., 2019); (3) the meaning (Hadley, 2017) and role of social media have changed (Zolkepli & Kamarulzaman, 2015); (4) social media users do not share the same profile as users seven years’ ago (Hunter et al., 2018). Besides these aspects, the significant changes in the content and structure of a scale focusing on the dimensions of salience (e.g., Frequency or intensity of use), compulsivity/emotion regulation, or social consequences characteristic of addictive behaviors may be the harbinger of the differentiation between substance and behavioral addictions. Despite all this, our results confirm H1: the hypothesis that it would be expected to find a good model to fit the Portuguese sample.
The results also showed that those participants with a low daily level of SM use have significantly lower social media addiction scores than those with moderate and high daily level use. Those with moderate daily level use have significantly lower social media addiction scores than those with high daily level use, confirming the second hypothesis (H2), in line with previous studies (e.g., Kreski et al., 2021; Marttila et al., 2021).
This research contributes to the literature by providing a scale that measures social media addiction in a Portuguese sample and has good psychometric properties. The SMAS-PV scale could be used to assess social media addiction in both clinical and non-clinical settings, providing a tool to explore further the behavioral effects of social media overuse amongst Portuguese participants.
Some limitations affect the generalizability of the findings: variables were analyzed based on self-reports, and the concept of social media addiction may not reflect the complexity of the use patterns. Future research should include more comprehensive samples (especially concerning age) in longitudinal designs, using more objective measures (for example, real control of the time of use of social media and its different options, such as chat or the number of followers). Another limitation of this research is that the scale does not provide cut-off points to distinguish addictive from non-addictive; only the structure, internal consistency, and validity of the scale were examined. Finally, the fact that social media users have undergone changes in their profile over the years raises the question of the suitability of this measure for future generations. In future research, the scale could be used to assess behavioral addiction in older and in clinical samples.
Credit authorship contribution statement
Ângela Leite: Conceptualization; Methodology; Investigation; Data Curation; Formal Analysis; Writing - Original Draft; Writing - Review & Editing. Ana Ramires: Methodology; Investigation; Data Curation; Formal Analysis; Writing - Review & Editing. Vítor Lira: Data Curation; Writing - Review & Editing. José Magano: Conceptualization; Methodology; Investigation; Data Curation; Formal Analysis; Writing - Original Draft; Writing - Review & Editing.

